. 2020 Sep 11;369(6509):eaaz5900.
doi: 10.1126/science.aaz5900. Epub 2020 Sep 10.

Transcriptomic signatures across human tissues identify functional rare genetic variation

Collaborators, Affiliations

Transcriptomic signatures across human tissues identify functional rare genetic variation

Nicole M Ferraro et al. Science. .

Abstract

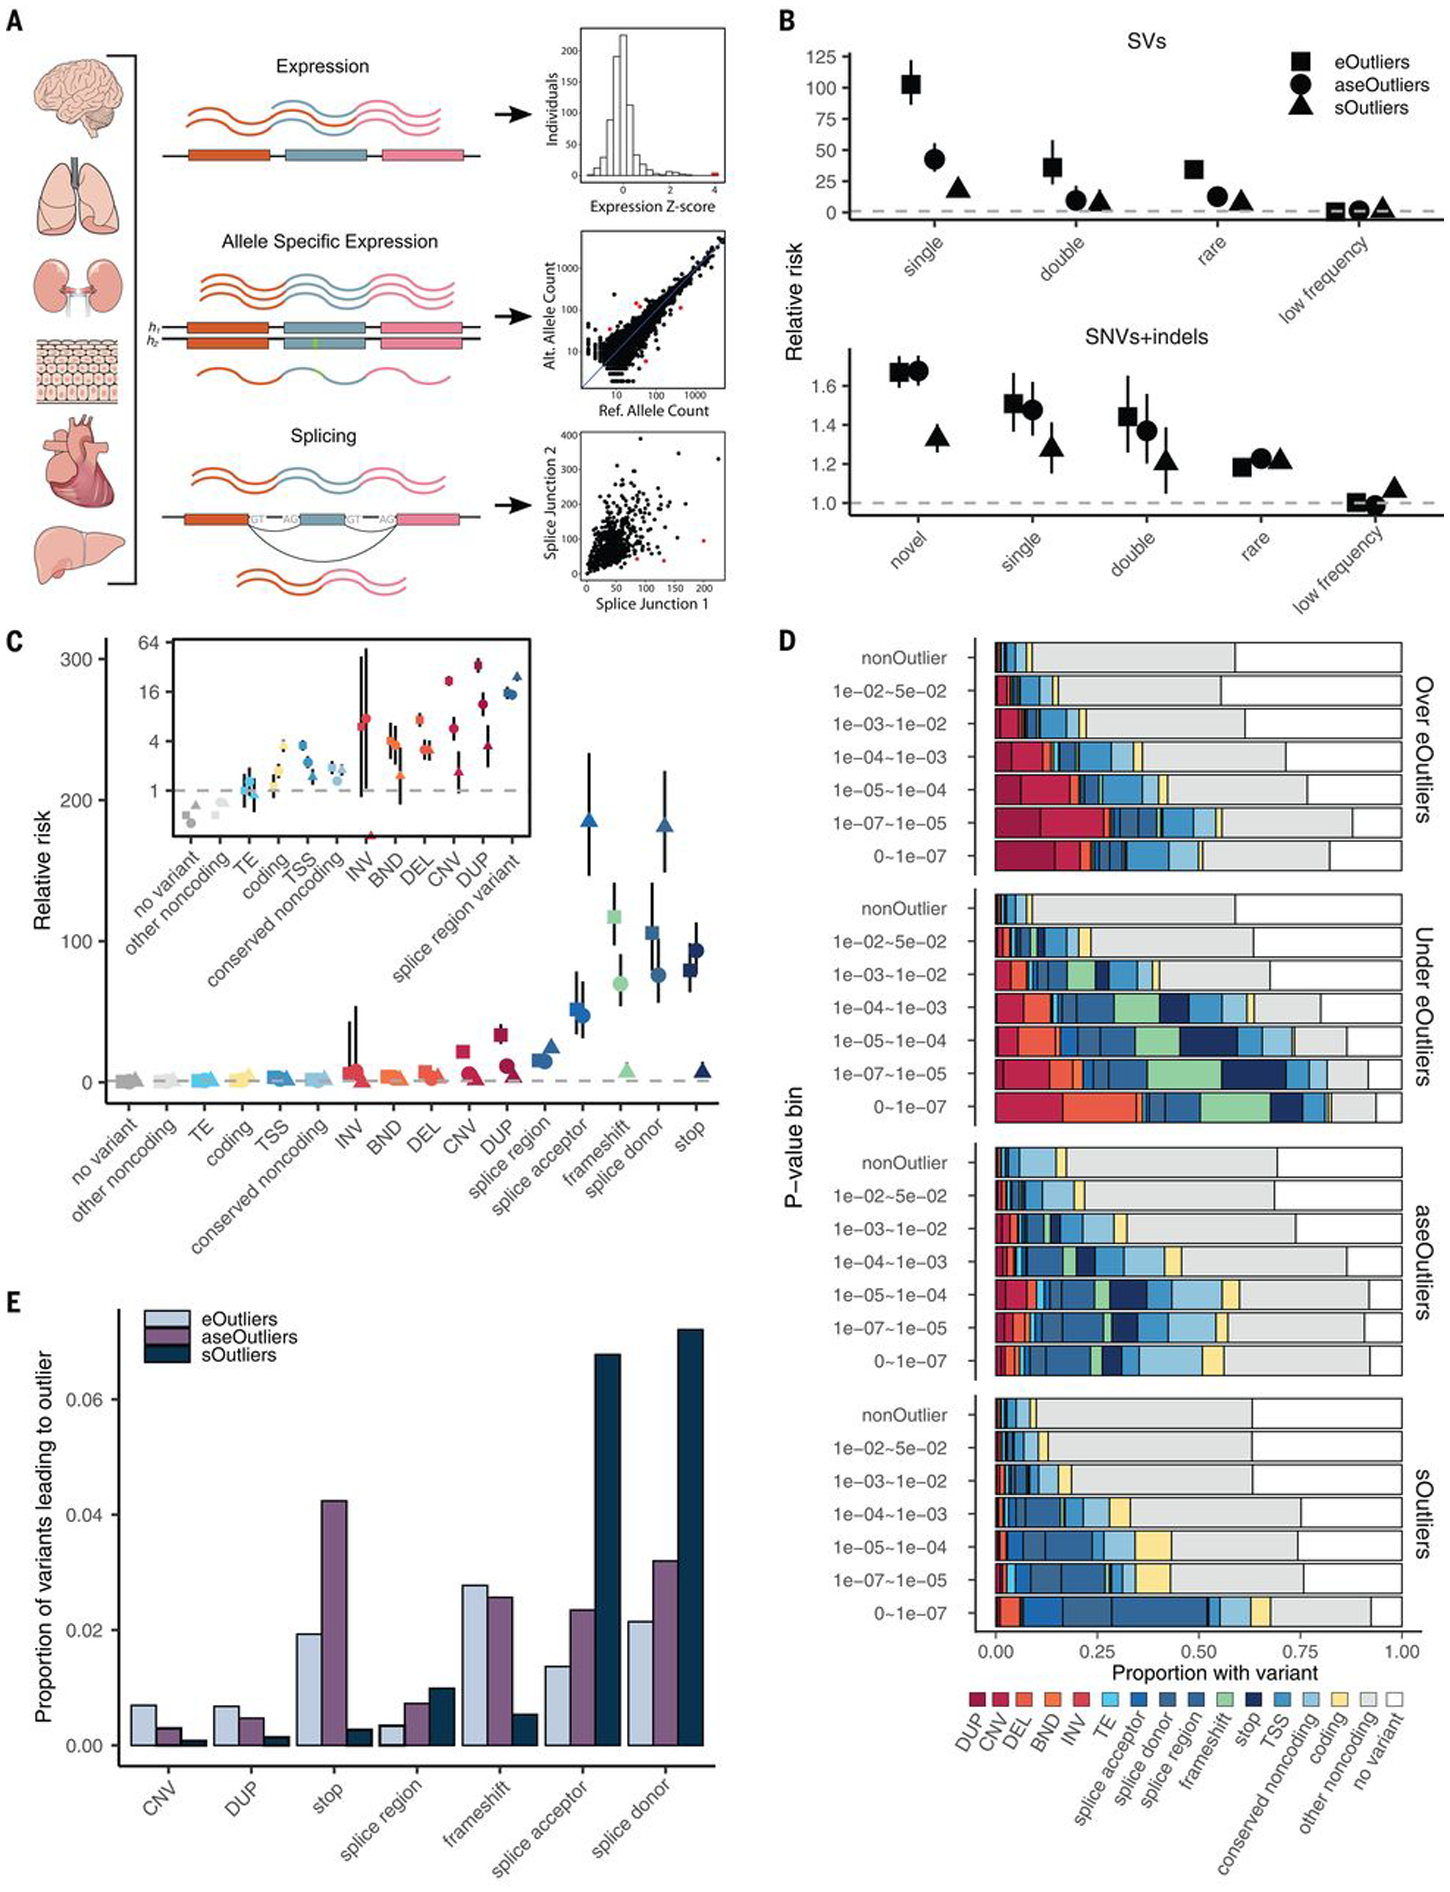
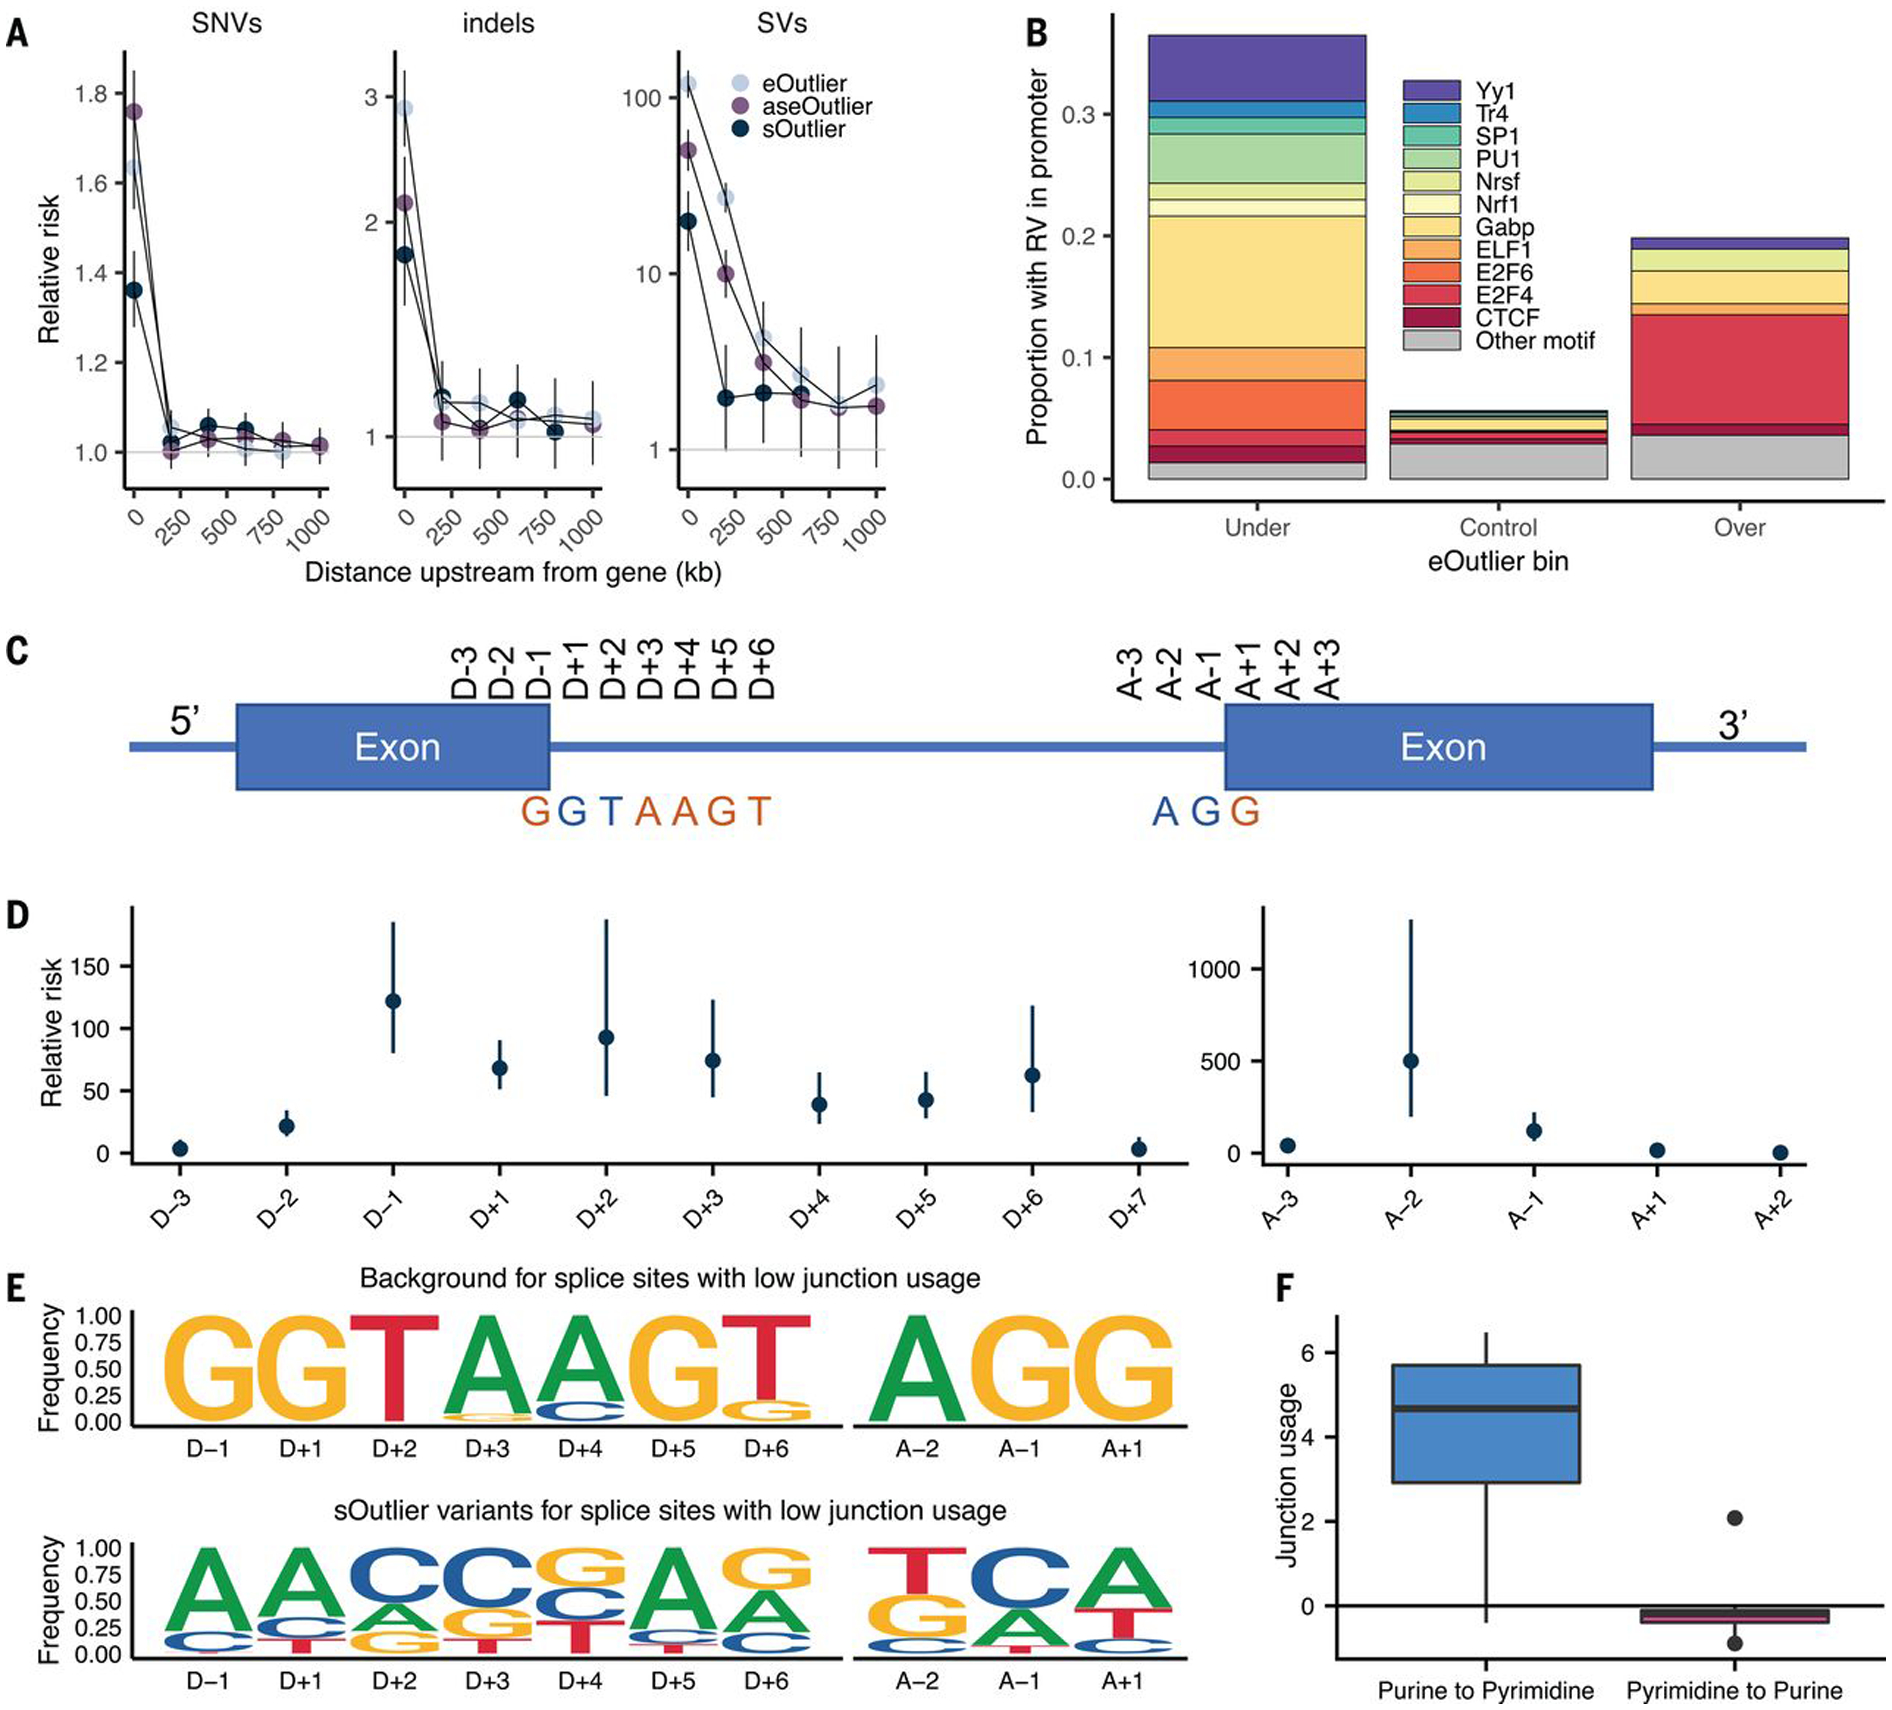
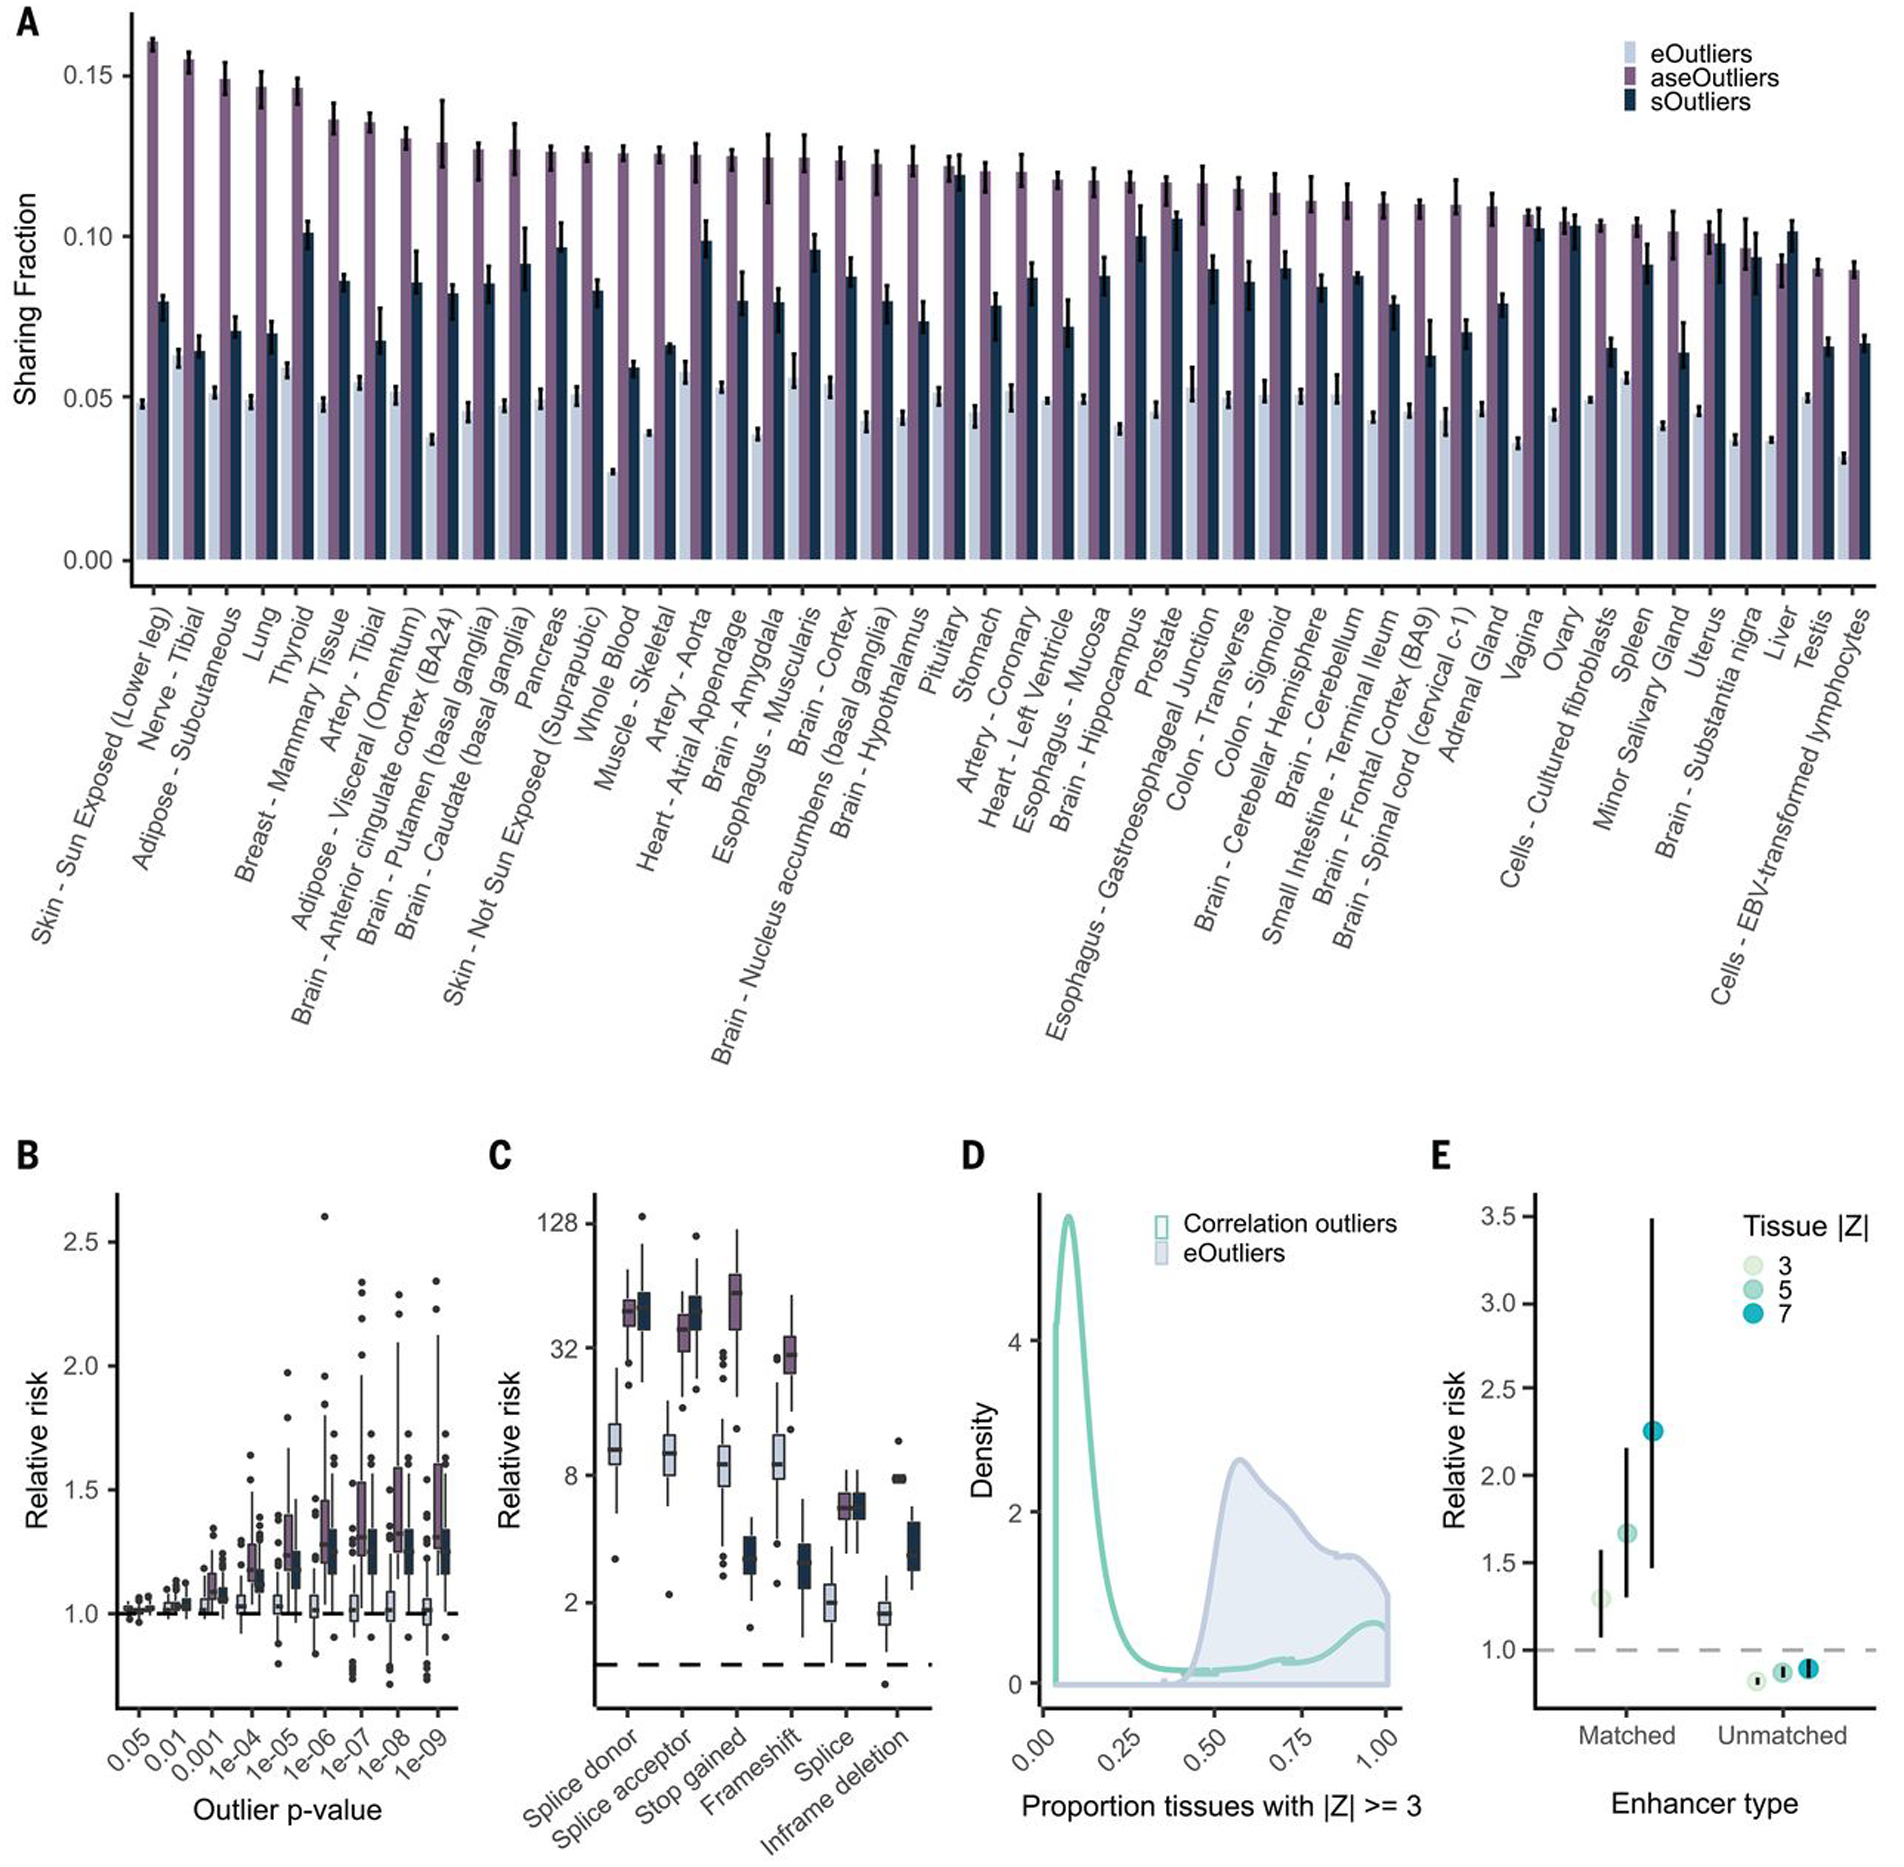
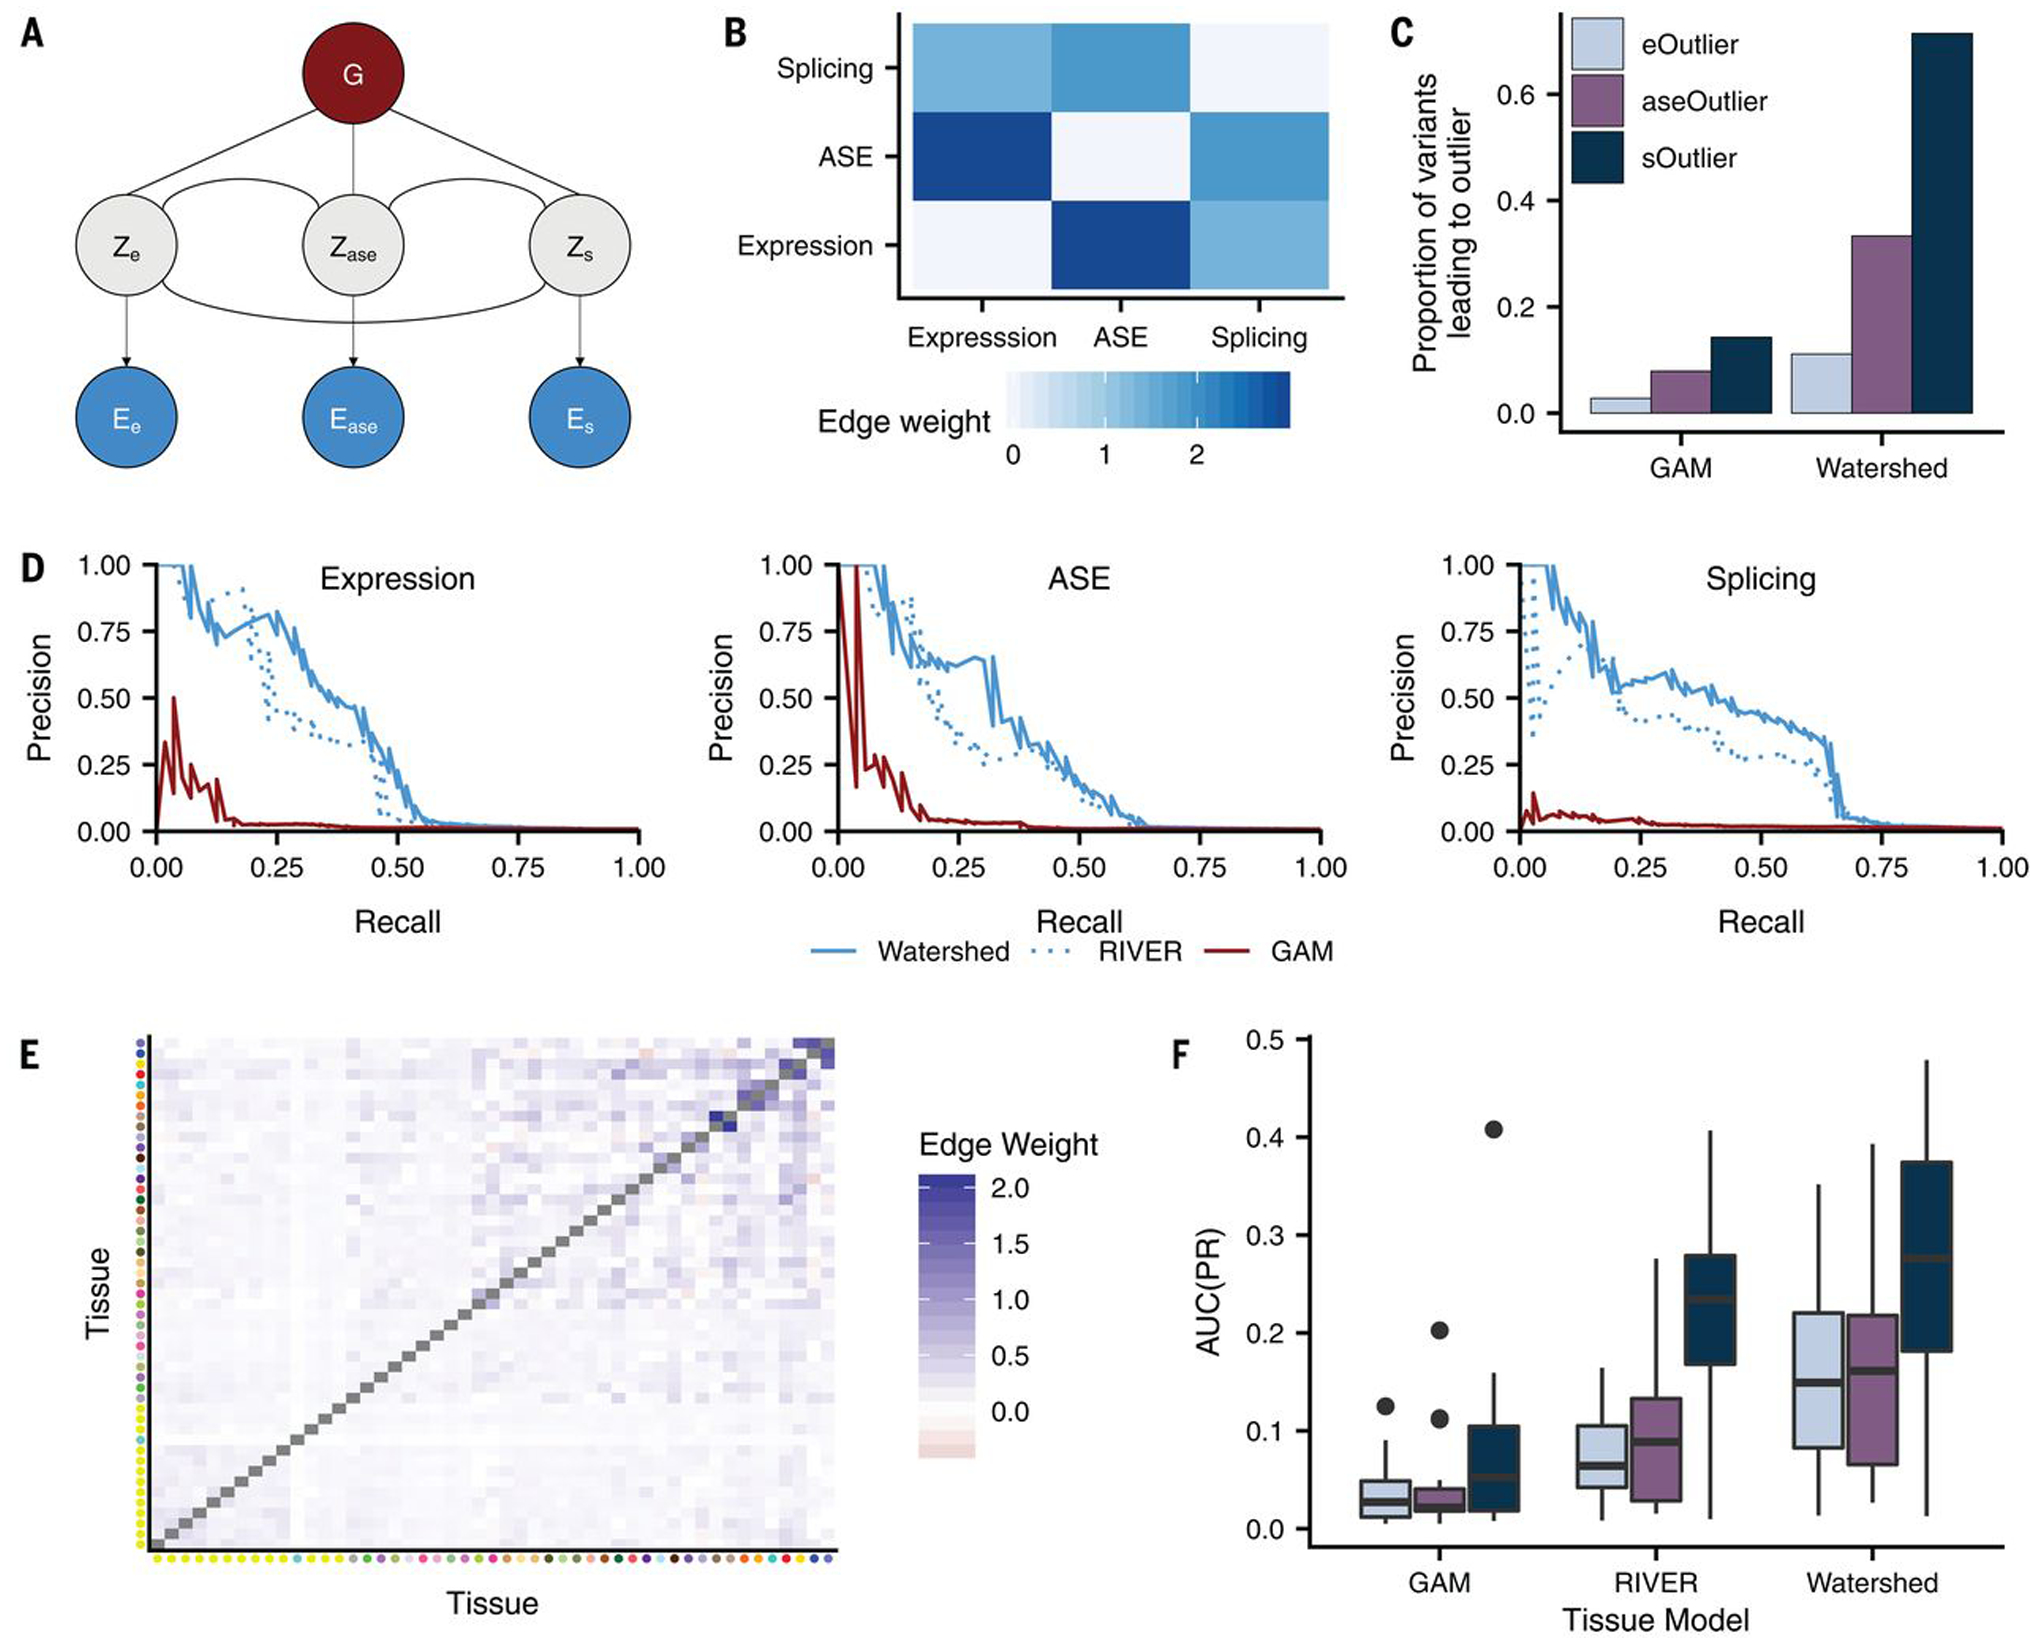
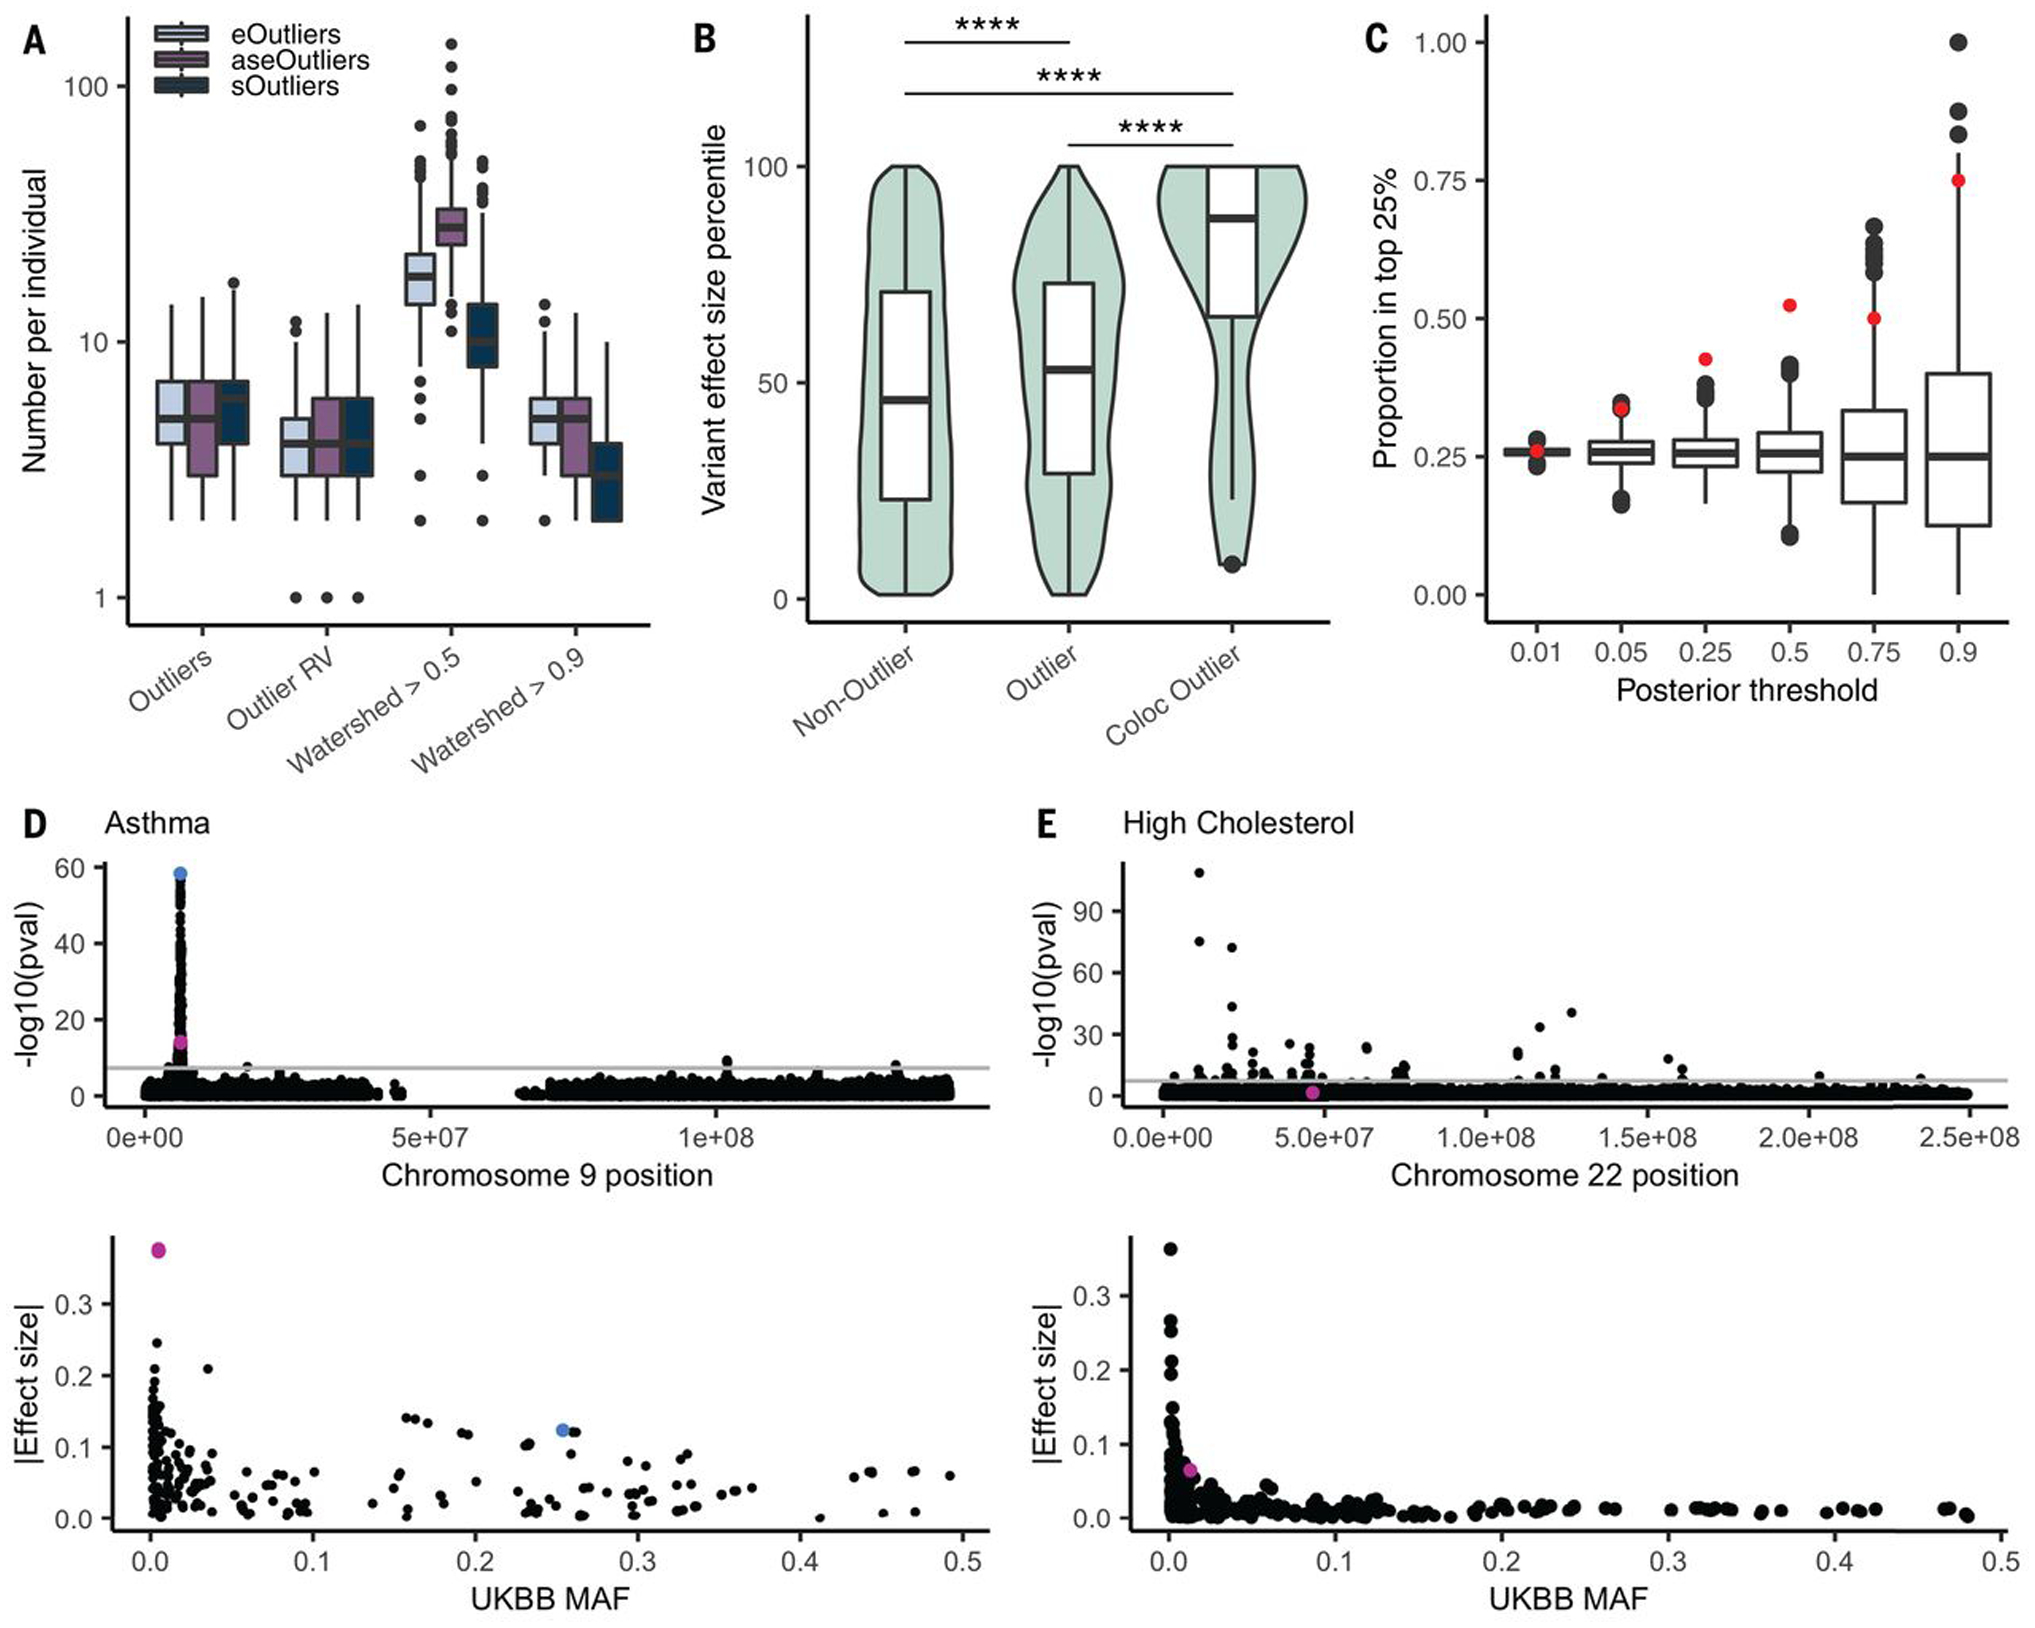
Rare genetic variants are abundant across the human genome, and identifying their function and phenotypic impact is a major challenge. Measuring aberrant gene expression has aided in identifying functional, large-effect rare variants (RVs). Here, we expanded detection of genetically driven transcriptome abnormalities by analyzing gene expression, allele-specific expression, and alternative splicing from multitissue RNA-sequencing data, and demonstrate that each signal informs unique classes of RVs. We developed Watershed, a probabilistic model that integrates multiple genomic and transcriptomic signals to predict variant function, validated these predictions in additional cohorts and through experimental assays, and used them to assess RVs in the UK Biobank, the Million Veterans Program, and the Jackson Heart Study. Our results link thousands of RVs to diverse molecular effects and provide evidence to associate RVs affecting the transcriptome with human traits.


Conflict of interest statement

Competing interests: F.A. is an inventor on a patent application related to TensorQTL. S.E.C. is a cofounder, chief technology officer, and stock owner at Variant Bio. E.R.G. is on the editorial board of Circulation Research and does consulting for the City of Hope/Beckman Research Institute. E.T.D. is chairman and member of the board of Hybridstat Ltd. B.E.E. is on the scientific advisory boards of Celsius Therapeutics and Freenome. G.G. receives research funds from IBM and Pharmacyclics and is an inventor on patent applications related to MuTect, ABSOLUTE, MutSig, POLYSOLVER and TensorQTL. S.B.M. is on the scientific advisory board of MyOme. D.G.M. is a cofounder with equity in Goldfinch Bio and has received research support from AbbVie, Astellas, Biogen, BioMarin, Eisai, Merck, Pfizer, and Sanofi-Genzyme. H.K.I. has received speaker honoraria from GSK and AbbVie. T.L. is a scientific advisory board member of Variant Bio with equity and of Goldfinch Bio. P.F. is member of the scientific advisory boards of Fabric Genomics, Inc., and Eagle Genomes, Ltd. P.G.F. is a partner of Bioinf2Bio. G.G. is a founder, consultant, and holds privately held equity in Scorpion Therapeutics. P.N. reports investigator-initiated research grants from Amgen, Apple, and Boston Scientific and is a scientific adviser to Apple and Blackstone Life Sciences. The remaining authors have no competing interests.

Figures

Fig. 1.
Fig. 1.. Enrichment of RVs underlying aberrant expression, splicing, and ASE.
(A) RNA-seq data in 838 individuals were combined across 49 tissues and used to identify shared tissue expression, ASE, and alternative splicing outliers. (B) Relative risk of new (not in gnomAD), singleton, doubleton, rare (MAF <1%), and low-frequency (MAF 1 to 5%) variants in a 10-kb window around the outlier genes across all data types compared with nonoutlier individuals for the same genes. Outliers were defined as those with values >3 SDs from the mean (|median Z| > 3) or, equivalently, a median P < 0.0027. Bars represent the 95% confidence interval. (C) Assigning each outlier its most consequential nearby RV, the relative risk for different categories of RVs falling within 10 kb of each outlier type. The inset panel shows enrichments for a subset of variant categories on a log(2)-transformed y-axis scale for better visibility. (D) Proportion of outliers at a given threshold that have a nearby RV in the given category. eOutlier |median Z scores| were converted to P values using the cumulative probability density function for the normal distribution. TE, transposable element; INV, inversion; BND, break end; DEL, deletion; DUP, duplication. (E) Proportion of RVs in a given category that lead to an outlier at a P-value threshold of 0.0027 across types.
Fig. 2.
Fig. 2.. RV enrichments in specific genomic positions.
(A) Relative risk of SNVs and indels (not found in gnomAD), and SVs (singleton in GTEx) at varying distances upstream of outlier genes (bins exclusive) across data types. (B) Proportion of eOutliers with TSS RVs in promoter motifs within 1000 bp. Under and over bins are defined with a median Z score threshold of 3, and controls are all individuals with a median Z score <3 for the same set of outlier genes. (C) Graphic summarizing positional nomenclature relative to observed donor and acceptor splice sites. (D) Relative risk (y-axis) of an sOutlier (median LeafCutter cluster P < 1 × 10⁻⁵) RV being located at a specific position relative to the splice site (x-axis) compared with nonoutlier RVs. Relative risk calculation was done separately for donor and acceptor splice sites. (E) Independent position weight matrices showing mutation spectra of sOutlier (median LeafCutter cluster P < 1 × 10⁻⁵) RVs at positions relative to splice sites with negative junction usage (i.e., splice sites used less in outlier individuals than in nonoutliers). (F) Junction usage of a splice site is the natural log of the fraction of reads in a LeafCutter cluster mapping to the splice site of interest in sOutlier (median LeafCutter cluster P < 1 × 10⁻⁵) samples relative to the fraction in nonoutlier samples aggregated across tissues by taking the median (16). Junction usage (y-axis) of the closest splice sites to RVs that lie within a polypyrimidine tract (A − 5, A − 35) binned by the type of variant (x-axis).
Fig. 3.
Fig. 3.. Single-tissue outlier enrichments and replication.
(A) Median replication of outliers identified per tissue across every other tissue for each outlier type. (B) Relative risk point estimate for nearby rare SNVs for outliers across all tissues individually. (C) Relative risk enrichments for likely gene disrupting RVs nearby single-tissue outliers at a threshold of |Z| > 4 (equivalently SPOT or ANEVA-DOT P < 0.000063), with one point per tissue. (D) Distribution of number of tissues with aberrant expression underlying expression outliers defined by median Z score (eOutliers) or Mahalanobis distance P value (correlation). (E) Relative risk of correlation outliers driven by a single tissue, defined as significant correlation outliers for which an expression change of the degree indicated by the point color is observed in only a single tissue (16) carrying a RV in enhancers annotated to that tissue within a 500-kb window of the outlier gene. Unmatched are defined as all tissue-specific enhancer regions regardless of outlier tissue.
Fig. 4.
Fig. 4.. Prioritizing functional RVs with Watershed.
(A) Graphic summarizing plate notation for the Watershed model when it is applied to three median outlier signals (expression, ASE, and splicing). (B) Symmetric heatmap showing learned Watershed edge parameters (weights) between pairs of outlier signals after training Watershed on three median outlier signals. (C) The proportion of RVs with Watershed posterior probability >0.9 (right) and with GAM probability greater than a threshold set to match the number of Watershed variants for each outlier signal (left) that lead to an outlier at a median P-value threshold of 0.0027 across three outlier signals (colors). Watershed and GAM models were evaluated on held-out pairs of individuals. (D) Precision-recall curves comparing performance of Watershed, RIVER, and GAM (colors) using held-out pairs of individuals for three median outlier signals. (E) Symmetric heatmap showing learned tissue-Watershed edge parameters (weights) between pairs of tissue outlier signals after training tissue-Watershed on eOutliers across single tissues. Tissue color to tissue name mapping can be found in fig. S21D. (F) Area under precision recall curves [AUC(PR); y-axis] in a single tissue between tissue-GAM, tissue-RIVER, and tissue-Watershed (x-axis) when applied to outliers across single tissues in all three outlier signals (colors). Precision recall curves in each tissue were generated using held-out pairs of individuals.
Fig. 5.
Fig. 5.. Trait associations for RVs underlying outlier genes.
(A) Distribution of the number of outlier genes, outlier genes with a nearby RV, and genes with a high Watershed posterior variant per data type. We added one to all values so that individuals with 0 are included. (B) Distribution of effect sizes, transformed to a percentile, for the set of GTEx RVs that appear in UKBB and are not outlier variants, those that are outlier variants, and those outlier variants that fall in colocalizing genes for the matched trait across 34 traits. Percentiles were calculated on the set of rare GTEx variants that overlap UKBB. The set of genes was restricted to those with at least one outlier individual in any data type and a nearby variant included in the test set (4787 variants and 1323 genes). P values were calculated from a one-sided Wilcoxon rank-sum test. (C) Proportion of variants filtered by Watershed posterior that fell in the top 25% of effect sizes for a colocalized trait (red) and the proportion of randomly selected variants of an equal number that also fall in these regions over 1000 iterations (black). (D) Manhattan plot (top) across chromosome 9 for asthma in the UKBB, filtered for non–low-confidence variants, with two high-Watershed variants, rs149045797 and rs146597587, shown in pink and the lead colocalized variant, rs3939286, shown in blue. The variants’ effect size ranks were similarly high for both self-reported and diagnosed asthma, but the summary statistics are shown for asthma diagnosis here. The UKBB MAF versus absolute value of the effect size for all variants within 10 kb of the Watershed variant is also shown (bottom). (E) Manhattan plot across chromosome 22 for self-reported high cholesterol in the UKBB, filtered to remove low confidence variants, with the high-Watershed variant rs564796245 shown in pink. The UKBB MAF versus absolute value of the effect size for all variants within 10 kb of the Watershed variant is also shown (bottom).

Comment in

  • Reaching completion for GTEx.
    Burgess DJ. Burgess DJ. Nat Rev Genet. 2020 Dec;21(12):717. doi: 10.1038/s41576-020-00296-7. Nat Rev Genet. 2020. PMID: 33060849 No abstract available.

References

    1. Keinan A, Clark AG, Recent explosive human population growth has resulted in an excess of rare genetic variants. Science 336, 740–743 (2012). doi: 10.1126/science.1217283; - DOI - PMC - PubMed
    1. Wright CF, FitzPatrick DR, Firth HV, Paediatric genomics: Diagnosing rare disease in children. Nat. Rev. Genet 19, 325 (2018). doi: 10.1038/nrg.2018.12; - DOI - PubMed
    1. Bomba L, Walter K, Soranzo N, The impact of rare and low-frequency genetic variants in common disease. Genome Biol. 18, 77 (2017). doi: 10.1186/s13059-017-1212-4; - DOI - PMC - PubMed
    1. Montgomery SB, Lappalainen T, Gutierrez-Arcelus M, Dermitzakis ET, Rare and common regulatory variation in population-scale sequenced human genomes. PLOS Genet. 7, e1002144 (2011). doi: 10.1371/journal.pgen.1002144; - DOI - PMC - PubMed
    1. Zeng Y et al. , Aberrant gene expression in humans. PLOS Genet. 11, e1004942 (2015). doi: 10.1371/journal.pgen.1004942; - DOI - PMC - PubMed

Publication types

Grants and funding

LinkOut - more resources