. 2020 Sep 11;369(6509):eaaz6876.
doi: 10.1126/science.aaz6876.

Determinants of telomere length across human tissues

Collaborators, Affiliations

Determinants of telomere length across human tissues

Kathryn Demanelis et al. Science. .

Abstract

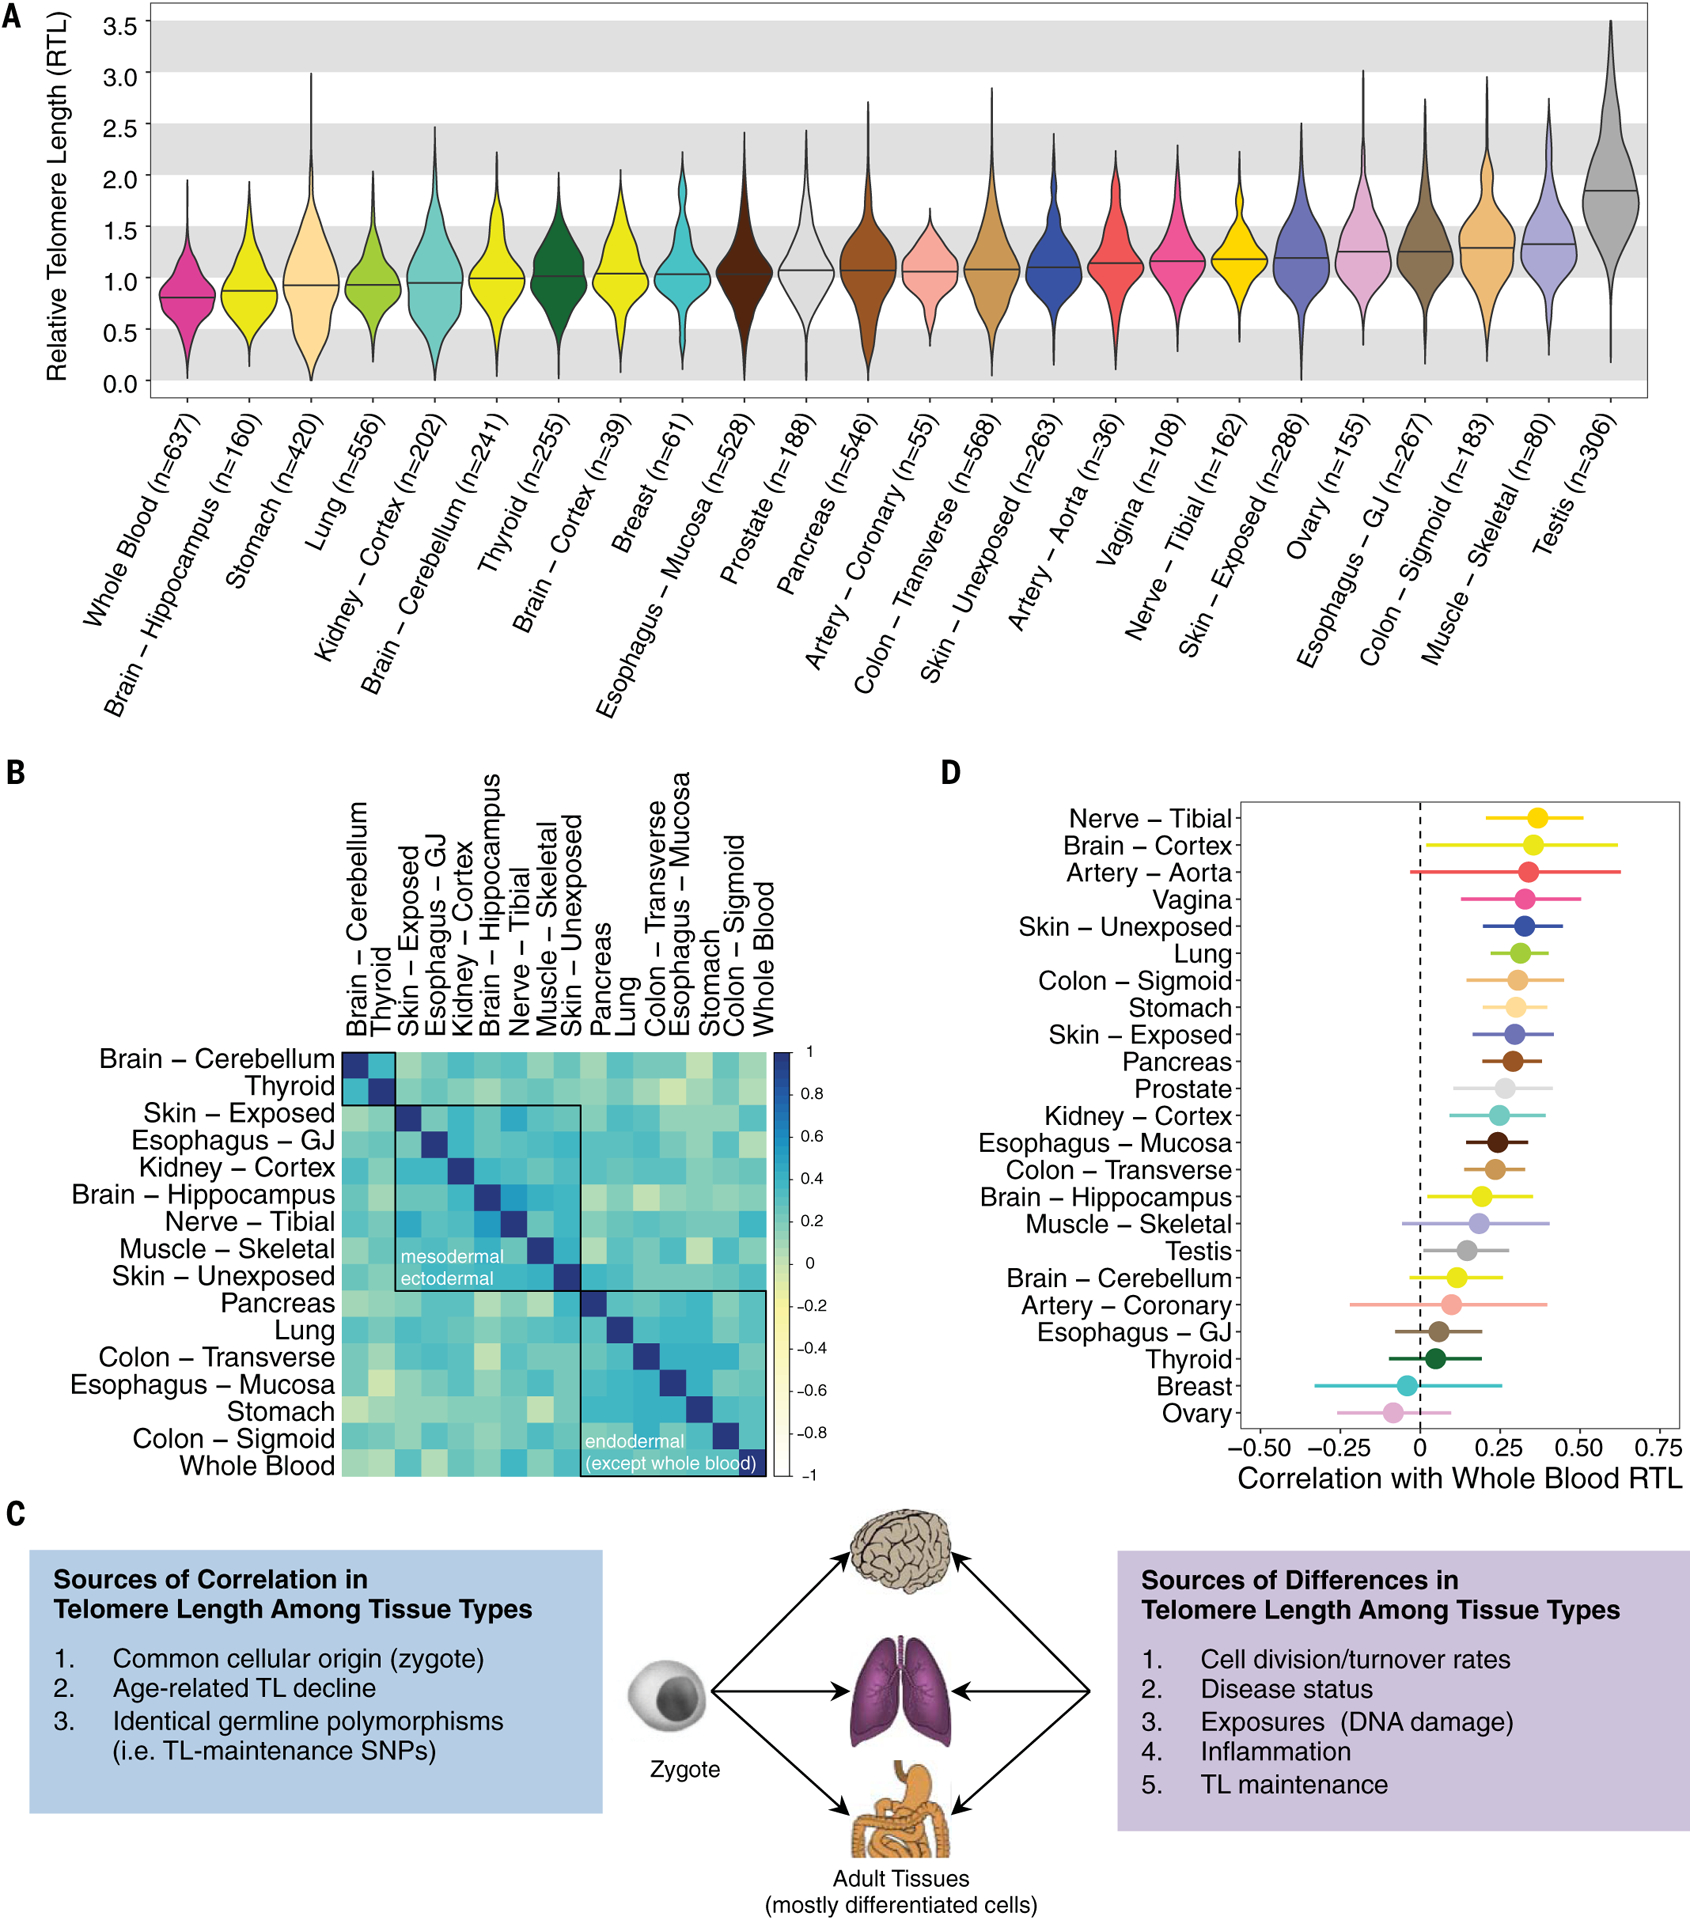
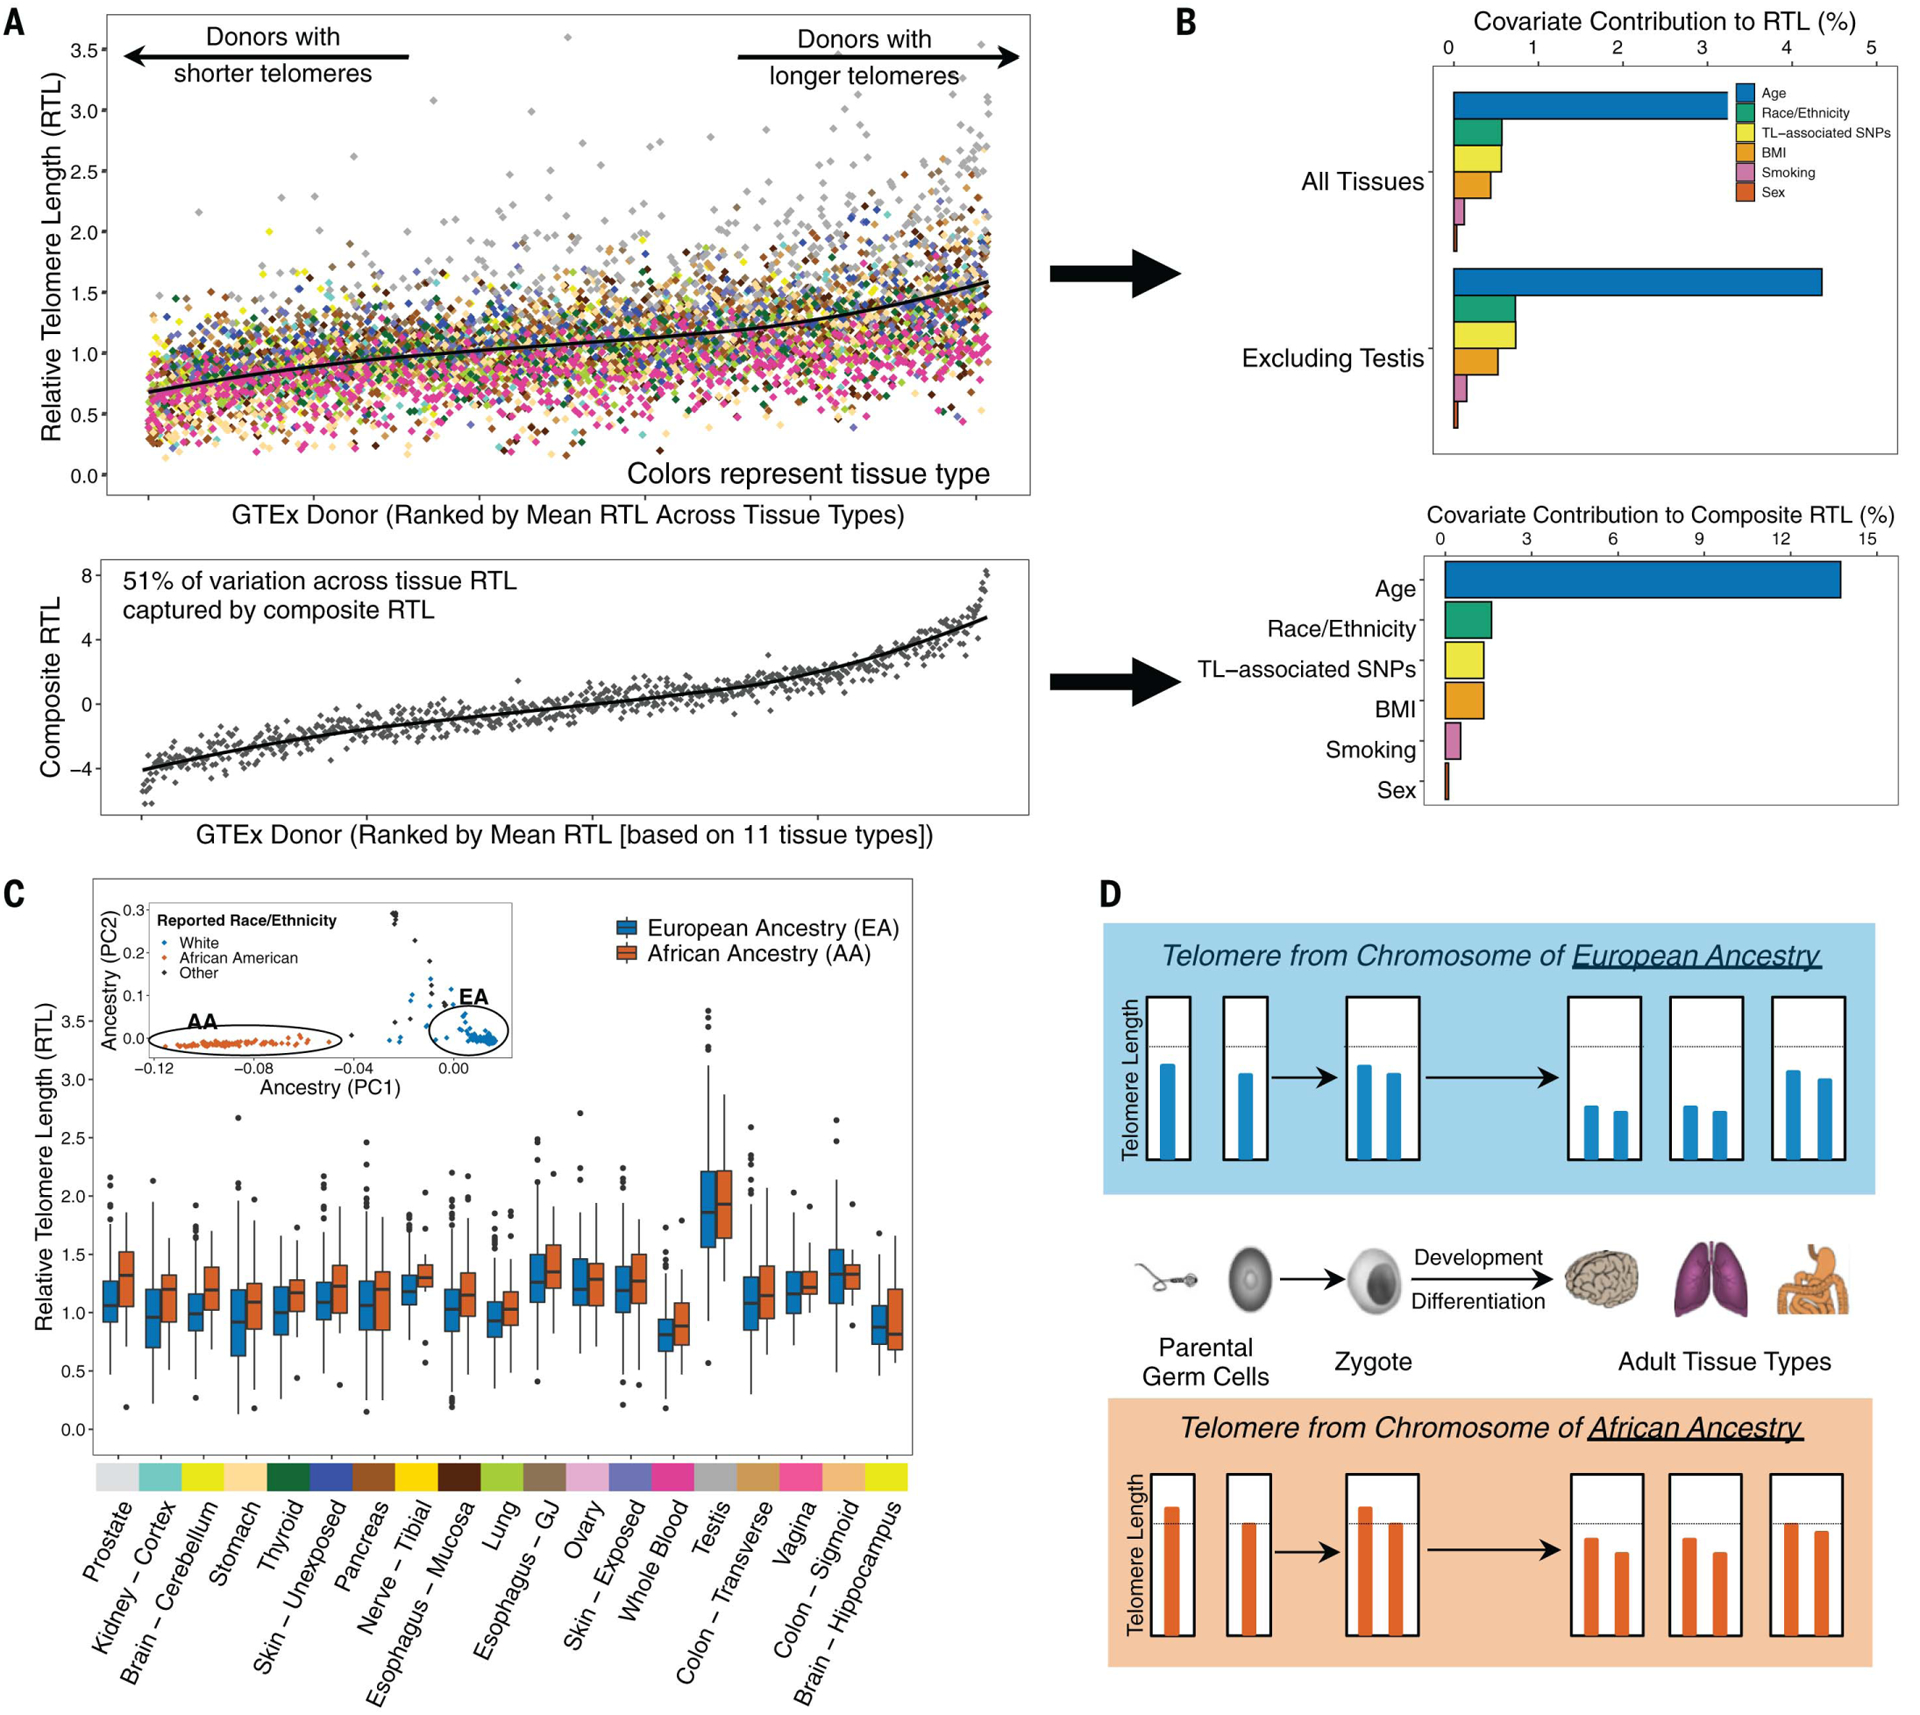
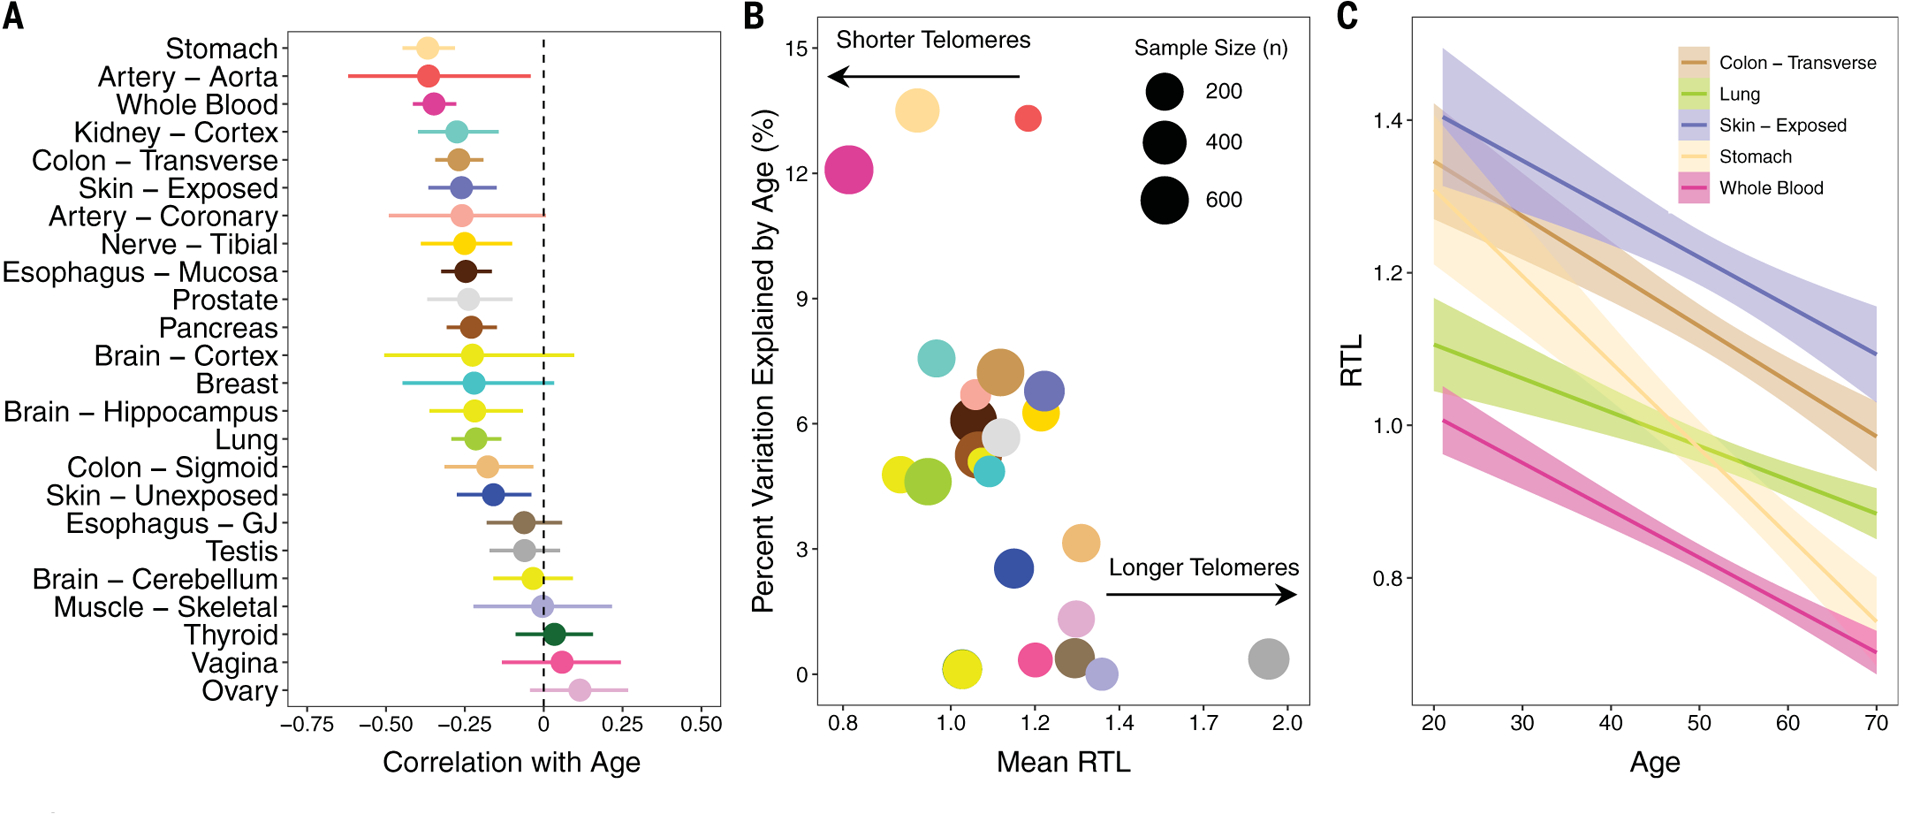
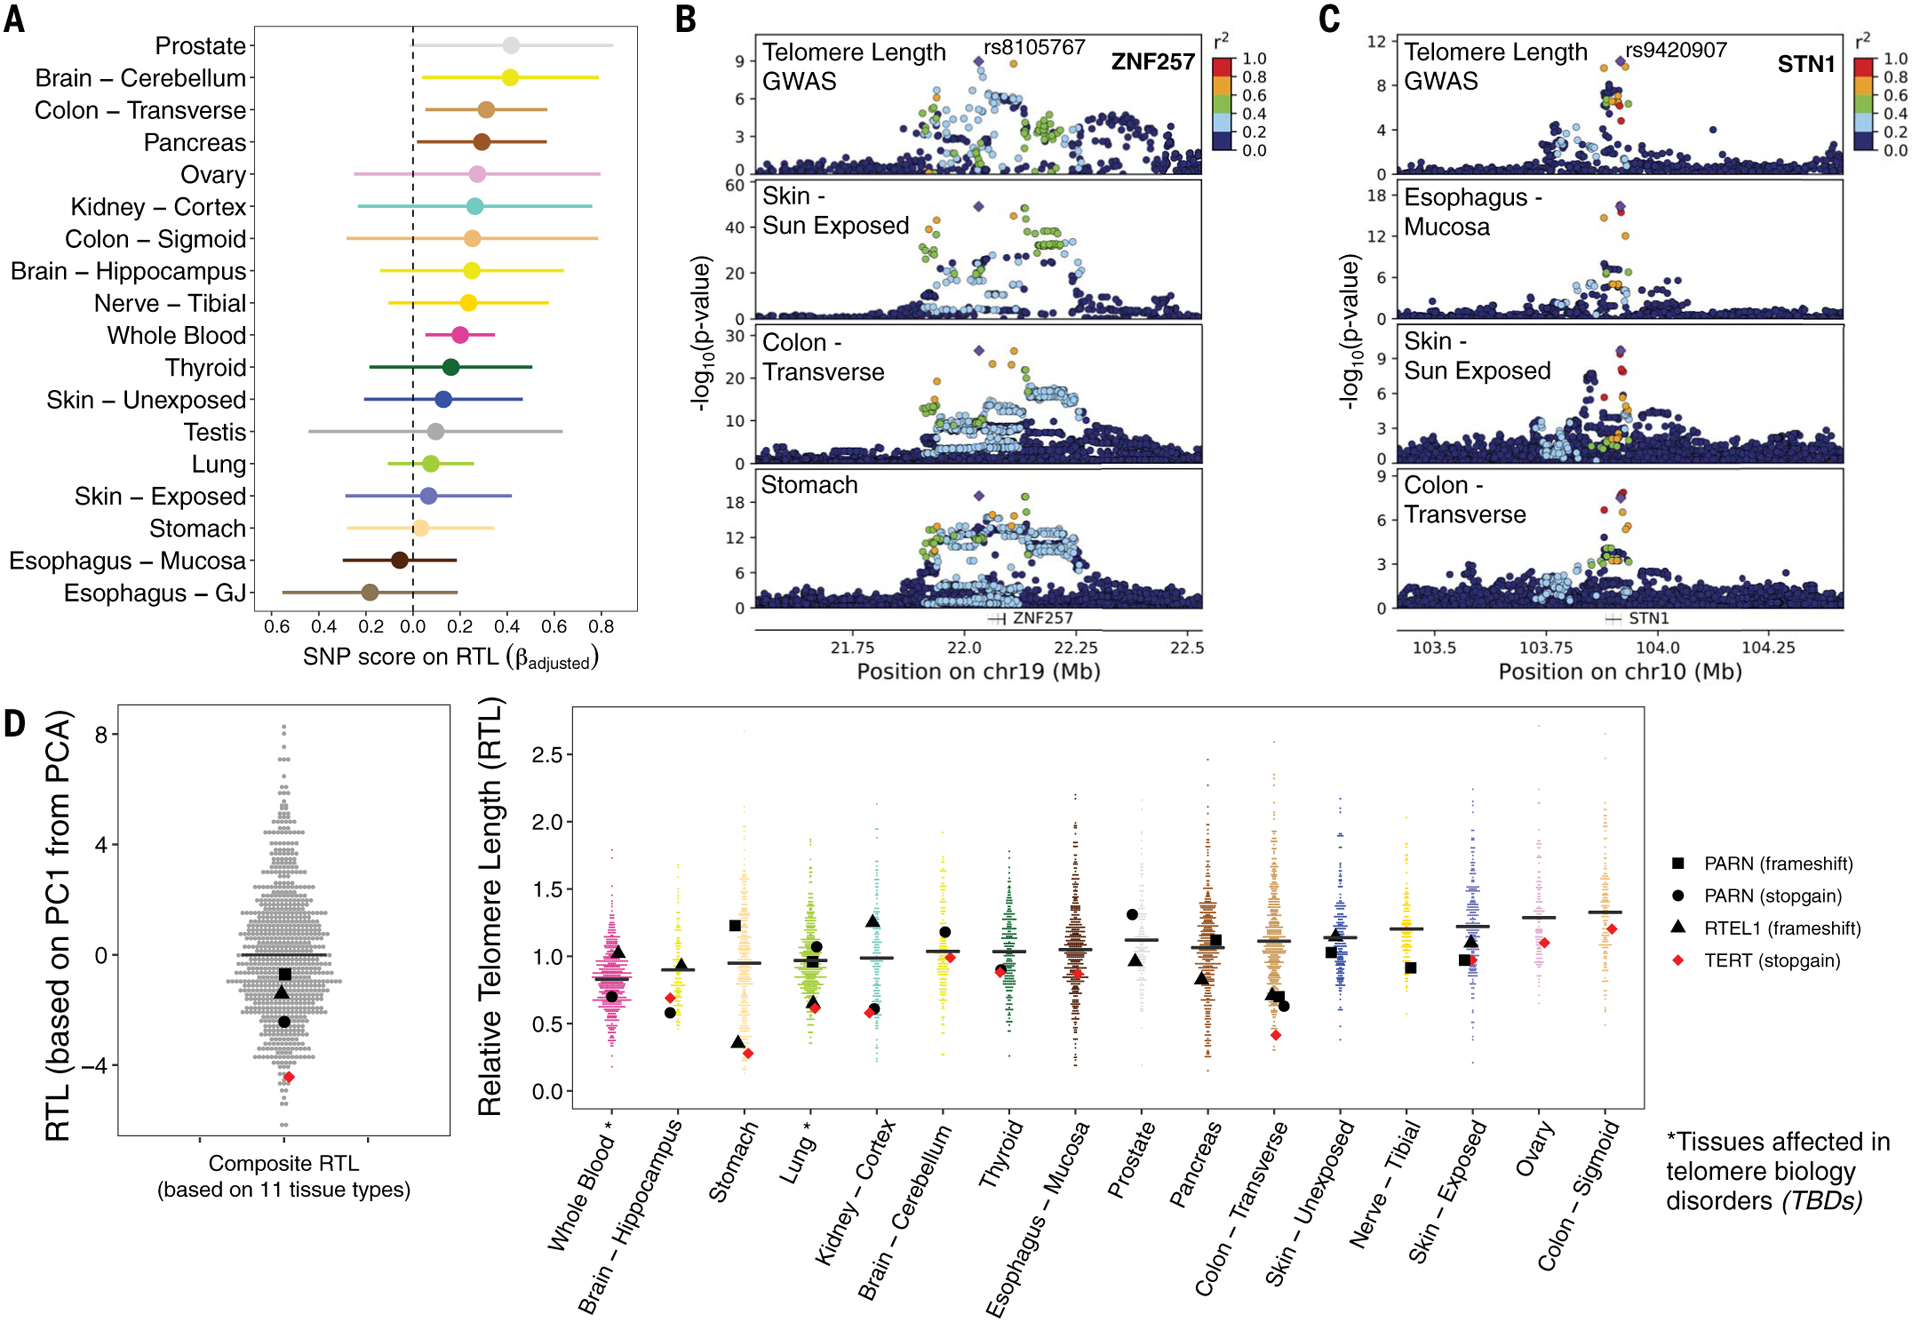
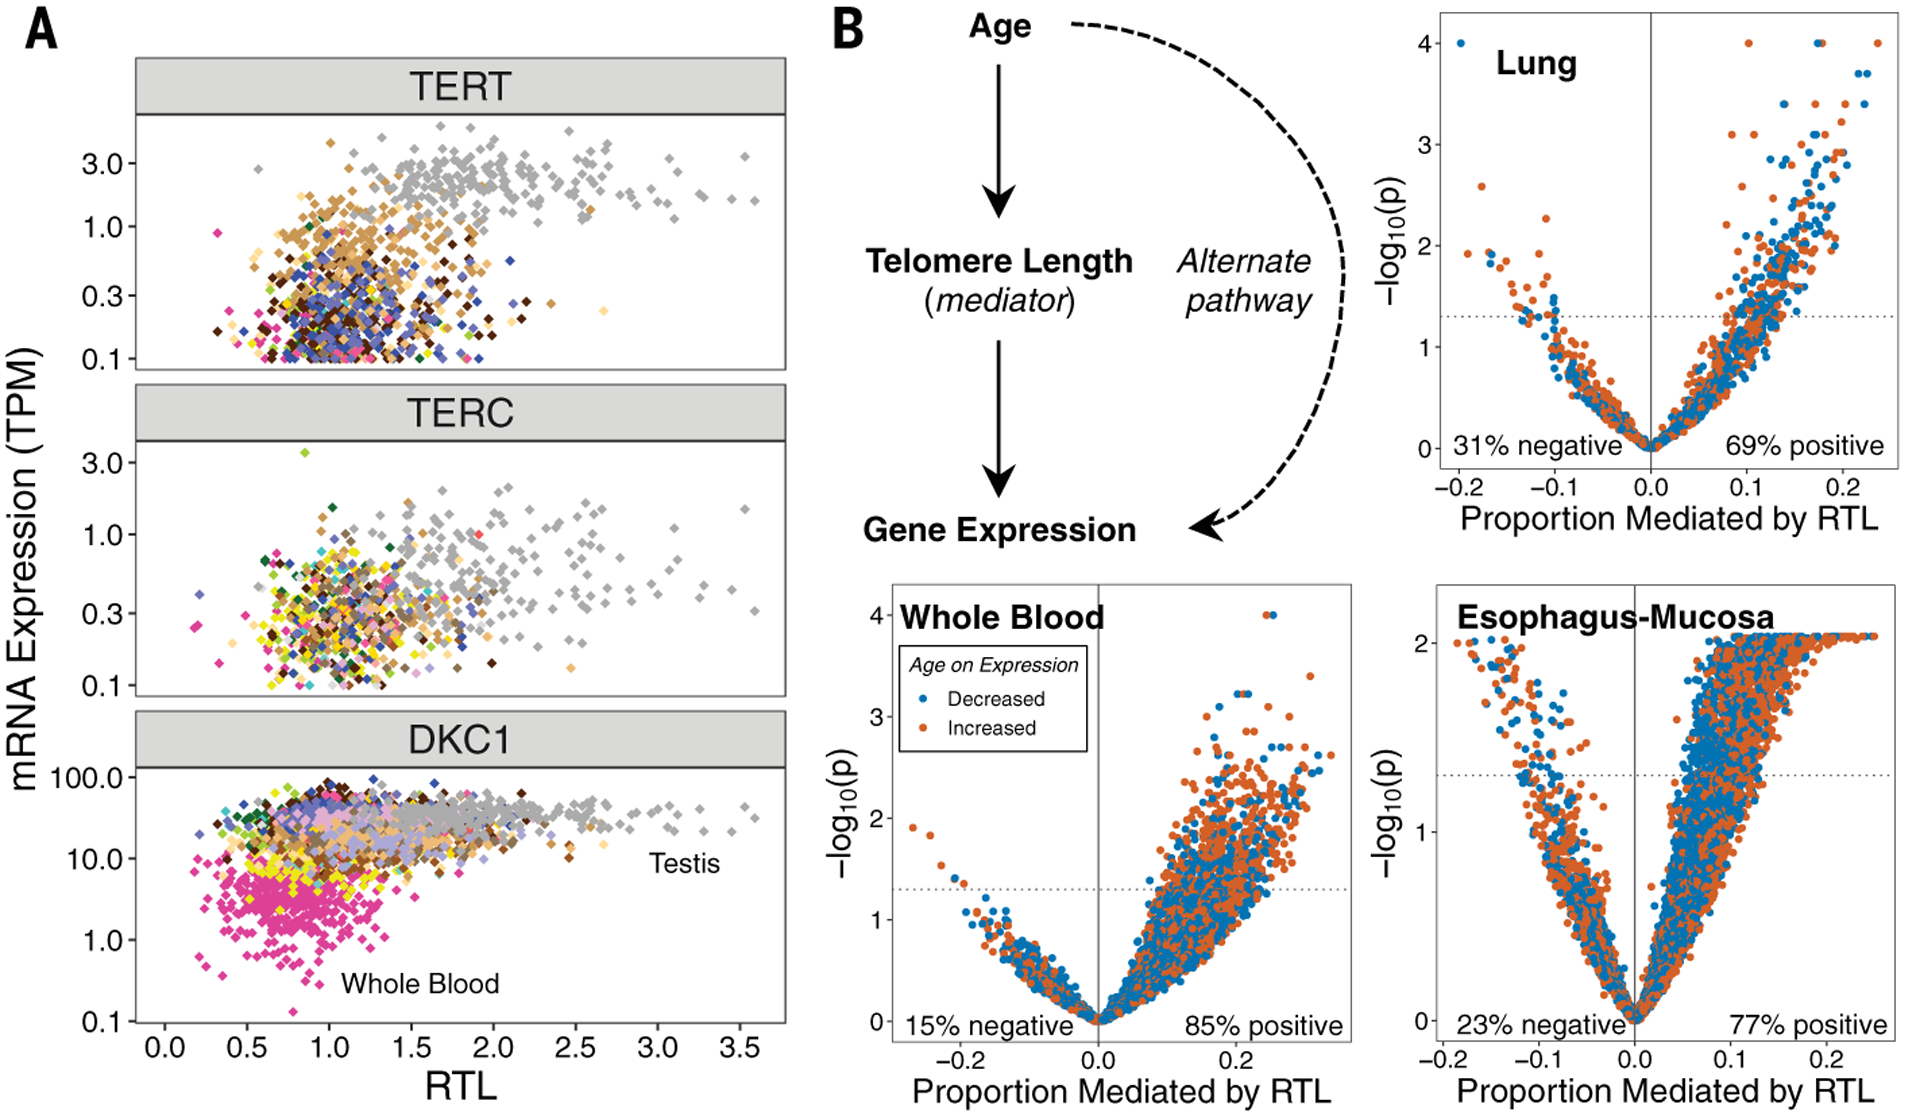
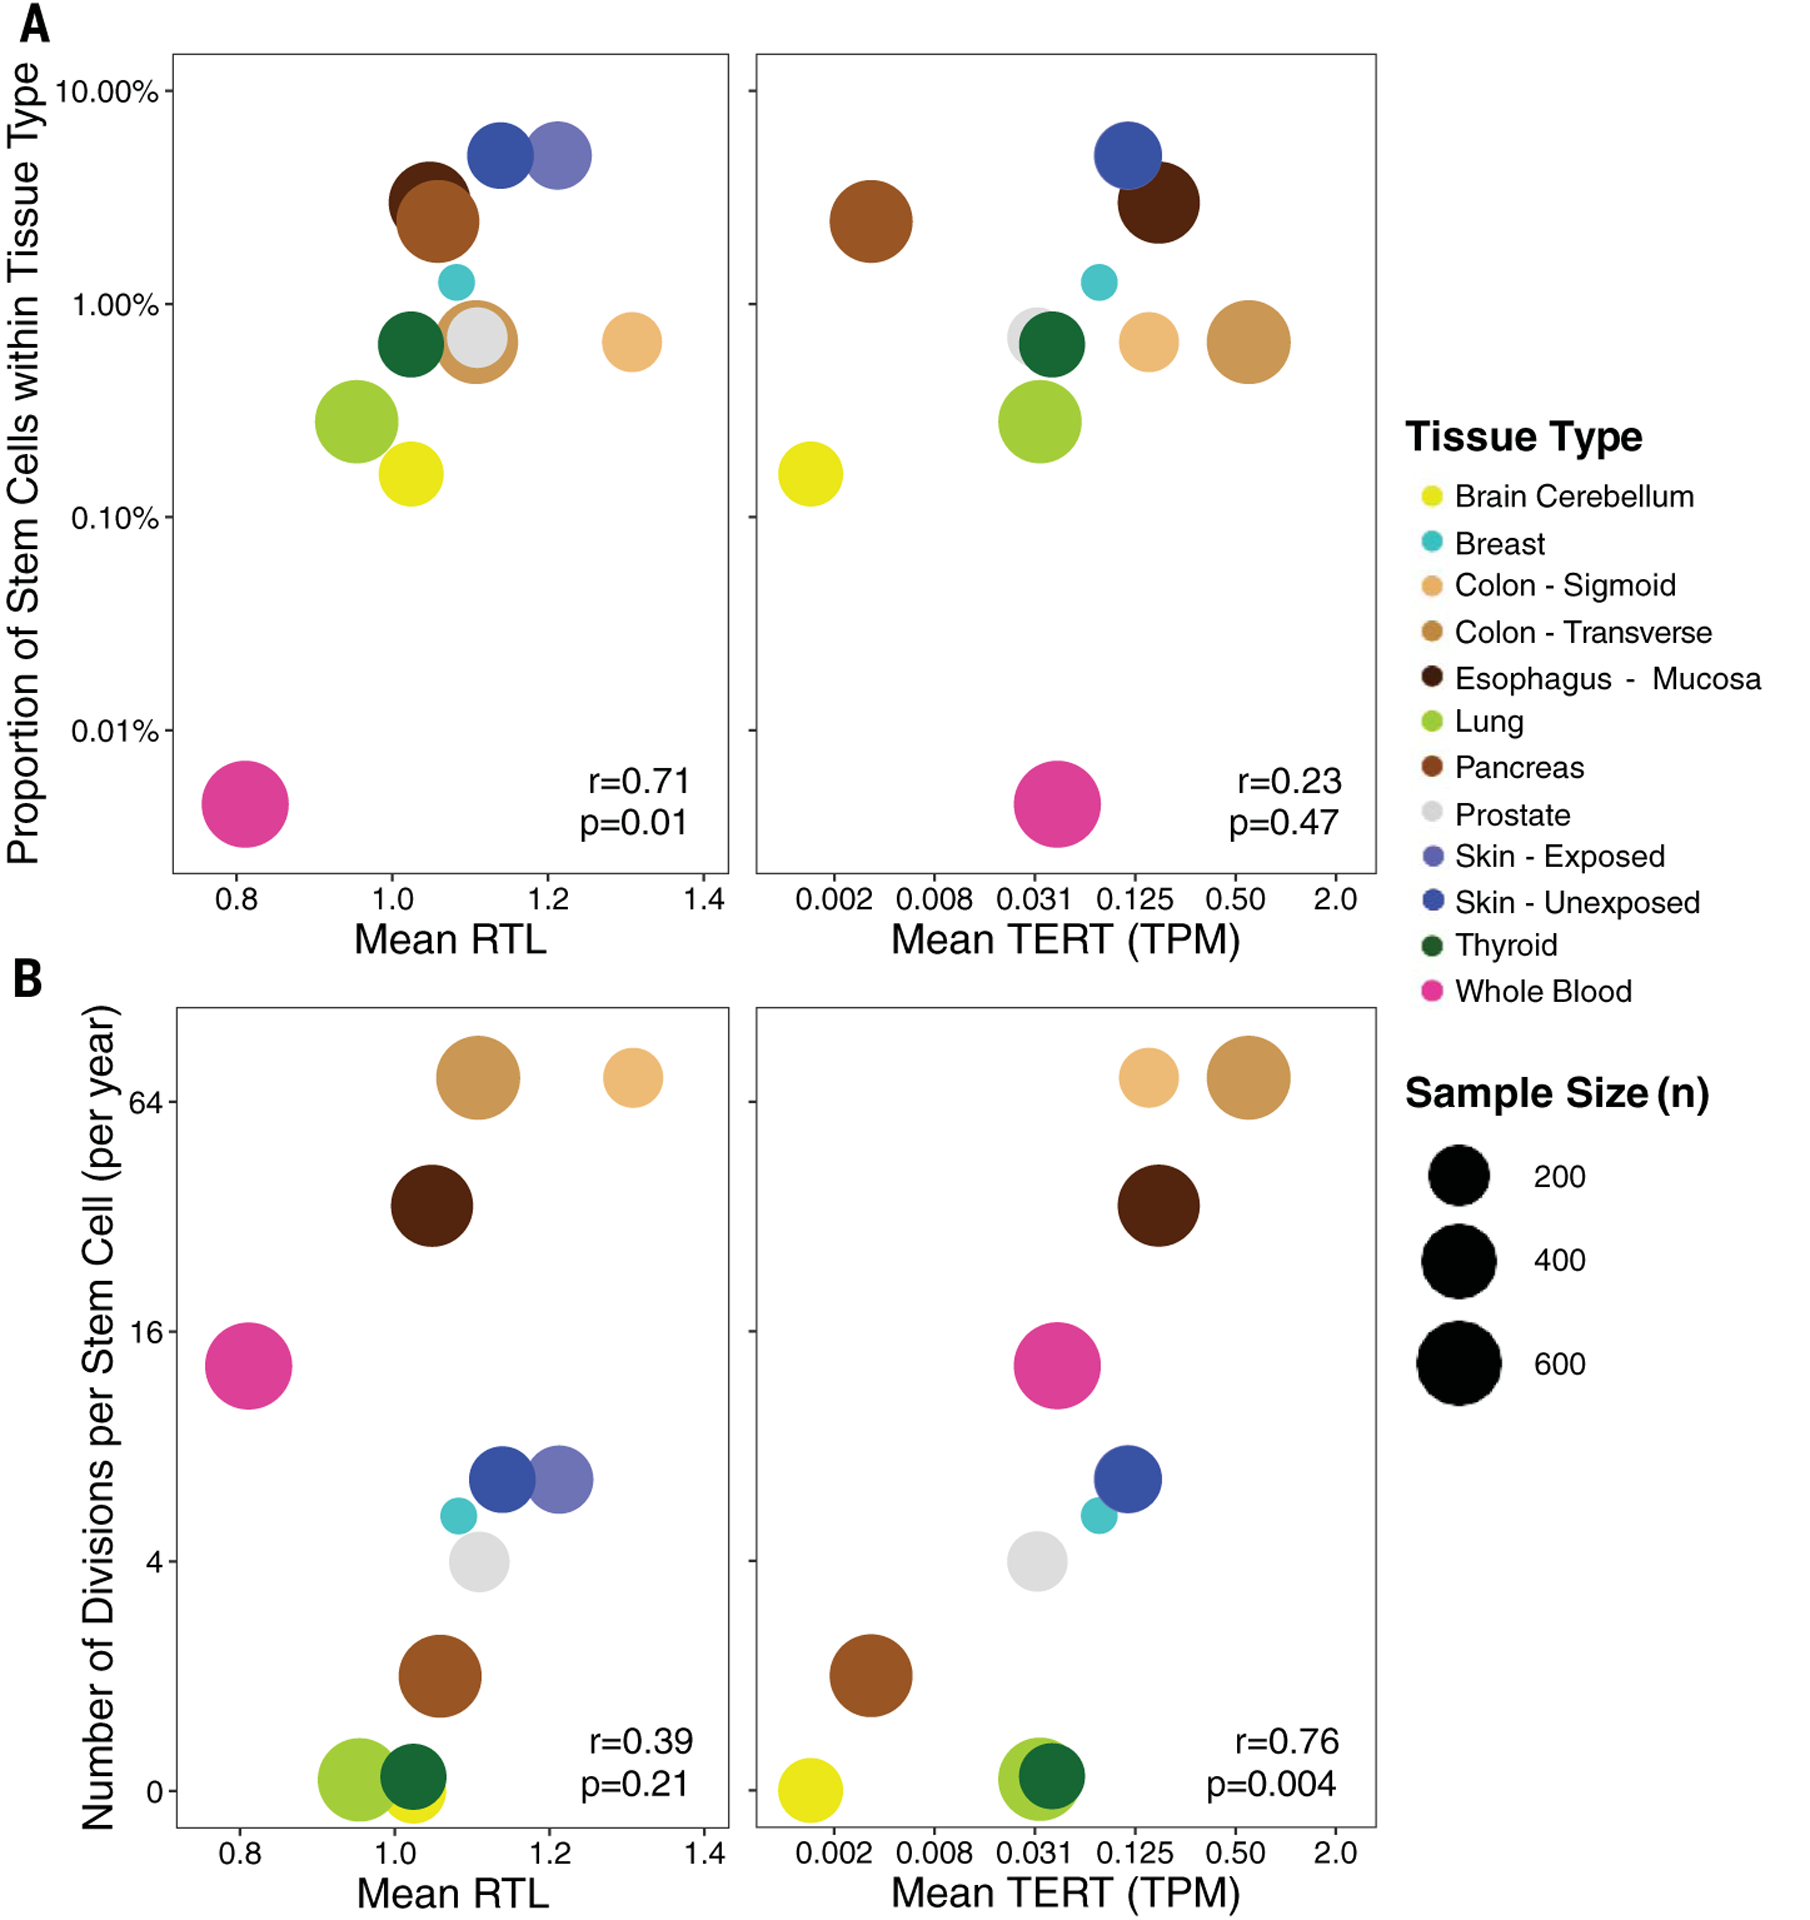
Telomere shortening is a hallmark of aging. Telomere length (TL) in blood cells has been studied extensively as a biomarker of human aging and disease; however, little is known regarding variability in TL in nonblood, disease-relevant tissue types. Here, we characterize variability in TLs from 6391 tissue samples, representing >20 tissue types and 952 individuals from the Genotype-Tissue Expression (GTEx) project. We describe differences across tissue types, positive correlation among tissue types, and associations with age and ancestry. We show that genetic variation affects TL in multiple tissue types and that TL may mediate the effect of age on gene expression. Our results provide the foundational knowledge regarding TL in healthy tissues that is needed to interpret epidemiological studies of TL and human health.


Conflict of interest statement

Competing interests: J.A.D. is an affiliate investigator at the Fred Hutchinson Cancer Research Center, Seattle, WA, and an adjunct associate professor at The Geisel School of Medicine at Dartmouth, Hanover, NH. F.A. is an inventor on a patent application related to TensorQTL. GTEx Consortium members: S.E.C. is a co-founder, chief technology officer, and stock owner at Variant Bio; E.R.G. is on the Editorial Board of Circulation Research and does consulting for the City of Hope/Beckman Research Institute; E.T.D. is chairman and member of the board of Hybridstat, Ltd.; B.E.E. is on the scientific advisory boards of Celsius Therapeutics and Freenome; G.G. receives research funds from IBM and Pharmacyclics and is an inventor on patent applications related to MuTect, ABSOLUTE, MutSig, MSMuTect, MSMutSig, POLYSOLVER, and TensorQTL. G.G. is a founder of and consultant to and holds privately held equity in Scorpion Therapeutics; S.B.M. is on the scientific advisory board of MyOme; D.G.M. is a co-founder with equity in Goldfinch Bio and has received research support from AbbVie, Astellas, Biogen, BioMarin, Eisai, Merck, Pfizer, and Sanofi-Genzyme; H.K.I. has received speaker honoraria from GSK and AbbVie; T.L. is a scientific advisory board member of Variant Bio with equity and Goldfinch Bio. P.F. is a member of the scientific advisory boards of Fabric Genomics, Inc., and Eagle Genomes, Ltd. P.G.F. is a partner of Bioinf2Bio.

Figures

Fig. 1.
Fig. 1.. TLs differ across human tissue types but are correlated among tissues types.
(A) Distribution of RTL across 24 GTEx tissue types (ordered by median RTL) (see table S1). Nine-hundred fifty-two donors contributed one or more tissue samples to the analysis, and the sample size for each tissue type corresponds to unique donors (i.e., no donors are represented twice for a given tissue type). (B) Pearson (r) correlations between RTL measures from different tissue types. Tissues included have ≥75 samples and were not sex specific. Red, yellow, and blue correspond to r = 1, 0, and −1, respectively. Black boxes are results from hierarchical clustering (three clusters). (Exact correlations are in table S3.) (C) Theoretical framework describing determinants of TL across human tissue types. (D) Pearson correlations between WB RTL and tissue-specific RTL measurements (with 95% confidence intervals).
Fig. 2.
Fig. 2.. TL varies among individuals and by ancestry.
(A) Distribution of RTL across GTEx donors ranked by donors’ mean RTL across all measured tissue types (top) and distribution of a “composite RTL” measure (bottom), estimated as the first PC from a PC analysis (PCA) of 11 tissue types (21). Colors correspond to GTEx tissue type. (B) Contribution of selected covariates to variability in RTL across all tissues (top) and composite RTL (bottom). For the analysis across all tissues, estimates were extracted as marginal R2 values from LMMs adjusted for tissue type and donor as random effects. (C) Distribution of RTL measures for individuals of European ancestry (EA) and African ancestry (AA). Tissue types are ranked by the largest difference between median RTL of the two ancestry groups. The inset shows genotyping PCs, demonstrating consistent clustering of individuals by genetically predicted ancestry. Sample-size information and associations between African ancestry and RTL are reported in table S5. (D) Schematic describing the direct inheritance of TL from parental germ cells and expected relationship to TL across adult tissue types for individuals of African and European ancestry. Genetic (and reported race and ethnicity category) ancestry was color coded for African (red) and European (blue) in (C) and (D).
Fig. 3.
Fig. 3.. Age is negatively correlated with TL in most tissues, and correlation is strongest in tissues with shorter telomeres.
(A) Pearson correlations between age and tissue-specific RTL measures. (B) Scatterplot of mean RTL for each tissue versus the percent variation explained by age (r2) for each tissue. The size of each point is proportional to sample size for that tissue type. (C) Relationship between RTL and age for five selected tissue types [WB, lung, stomach, transverse colon, and skin (exposed)]. For all plots, colors correspond to tissue type.
Fig. 4.
Fig. 4.. Inherited genetic variation affects telomere length in multiple tissue types and expression of nearby genes.
(A) Associations between a polygenic SNP score for leukocyte TL and tissue-specific RTL measures. Colors correspond to tissue type. (B) Leukocyte TL association signal from GWASs colocalizes with a cis-eQTL for ZNF257 (~40 kb upstream of ZNF208). The top plot shows results from the ENGAGE Consortium GWAS of leukocyte TL, and the bottom three plots correspond to cis-eQTL results from GTEx tissues: skin–sun exposed, colon–transverse, and stomach. chr19, chromosome 19. (C) Leukocyte TL association signal colocalizes with a cis-eQTL for STN1 (also known as OBFC1 in human genome reference hg19). The top plot corresponds to results from the ENGAGE Consortium GWAS of leukocyte TL, and the bottom three plots correspond to cis-eQTL results from GTEx tissues: skin–sun exposed, EM, and colon–transverse. (D) Distribution of composite RTL (based on PC1 from PCA of 11 tissue types) (left) and tissue type RTL (right), with highlighted dots representing GTEx donors carrying a rare LOF variant in a telomere maintenance gene previously implicated in TBDs. LOF variants are noted in the legend. The black horizontal line corresponds to median composite RTL and tissue type RTL. The tissue types presented contain one or more LOF carriers, and colors correspond to tissue type.
Fig. 5.
Fig. 5.. TL is associated with telomerase subunit gene expression and may mediate the effect of age on gene expression.
(A) RTL plotted against TERC, TERT, or DKC1 expression across tissue types. Colors correspond to GTEx tissue types. (B) Analyses addressing the hypothesis that TL mediates the effect of age on expression of specific genes. Scatterplots show estimates of the proportion of the effect of age on gene expression mediated by RTL (for each gene) and the −log10(p value) corresponding to the average causal mediation effect of RTL (for each gene). Results are presented for all age-associated genes in each of the three selected tissue types (WB, lung, and EM). The mediation p value was obtained using a nonparametric bootstrapping approach (n = 10,000 bootstraps).
Fig. 6.
Fig. 6.. TL and TERT expression are associated with estimated stem cell features.
(A) Estimated proportion of stem cells within tissues and its relationship between mean RTL (left) and mean TERT expression (right). (B) Estimated number of divisions per stem cell (per year) within tissues and its relationship between mean RTL (left) and mean TERT expression (right). Colors correspond to GTEx tissue types, and the size of each point reflects the sample size of the tissue type. Pearson correlations and corresponding p values are reported. Analysis included nonreproductive tissues only.

Comment in

  • Reaching completion for GTEx.
    Burgess DJ. Burgess DJ. Nat Rev Genet. 2020 Dec;21(12):717. doi: 10.1038/s41576-020-00296-7. Nat Rev Genet. 2020. PMID: 33060849 No abstract available.

References

    1. Blackburn EH, Epel ES, Lin J, Human telomere biology: A contributory and interactive factor in aging, disease risks, and protection. Science 350, 1193–1198 (2015). doi: 10.1126/science.aab3389; - DOI - PubMed
    1. Harley CB, Futcher AB, Greider CW, Telomeres shorten during ageing of human fibroblasts. Nature 345, 458–460 (1990). doi: 10.1038/345458a0; - DOI - PubMed
    1. Zou Y, Sfeir A, Gryaznov SM, Shay JW, Wright WE, Does a sentinel or a subset of short telomeres determine replicative senescence? Mol. Biol. Cell 15, 3709–3718 (2004). doi: 10.1091/mbc.e04-03-0207; - DOI - PMC - PubMed
    1. Shay JW, Role of telomeres and telomerase in aging and cancer. Cancer Discov. 6, 584–593 (2016). doi: 10.1158/2159-8290.CD-16-0062; - DOI - PMC - PubMed
    1. López-Otín C, Blasco MA, Partridge L, Serrano M, Kroemer G, The hallmarks of aging. Cell 153, 1194–1217 (2013). doi: 10.1016/j.cell.2013.05.039; - DOI - PMC - PubMed

Publication types

Substances

Grants and funding