. 2020 Sep 11;369(6509):1318-1330.
doi: 10.1126/science.aaz1776.

The GTEx Consortium atlas of genetic regulatory effects across human tissues

Collaborators

The GTEx Consortium atlas of genetic regulatory effects across human tissues

GTEx Consortium. Science. .

Abstract

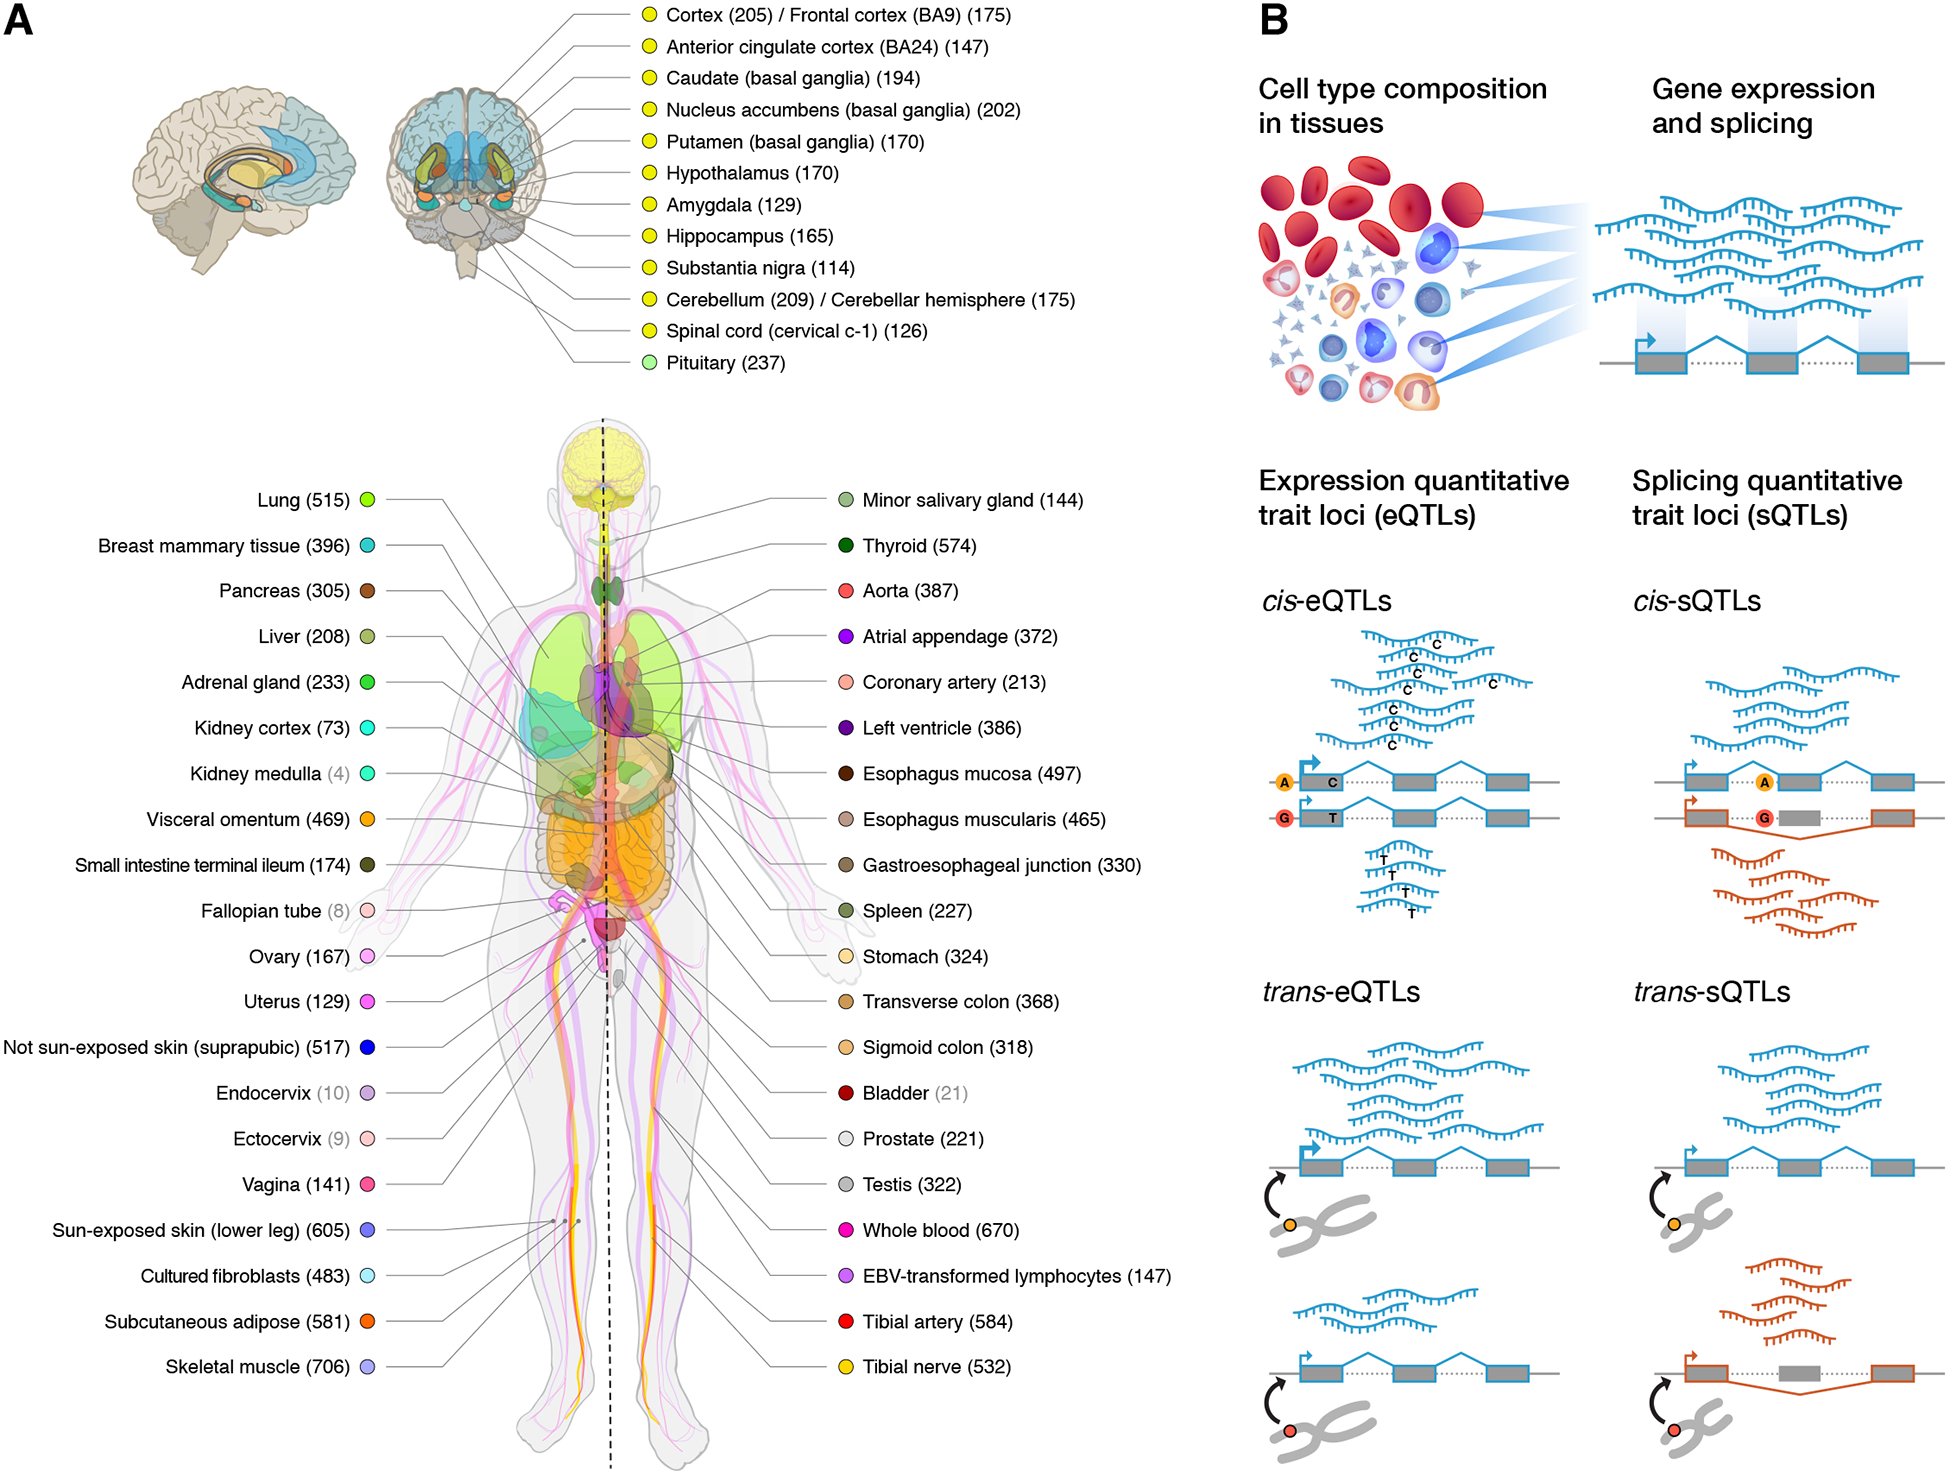
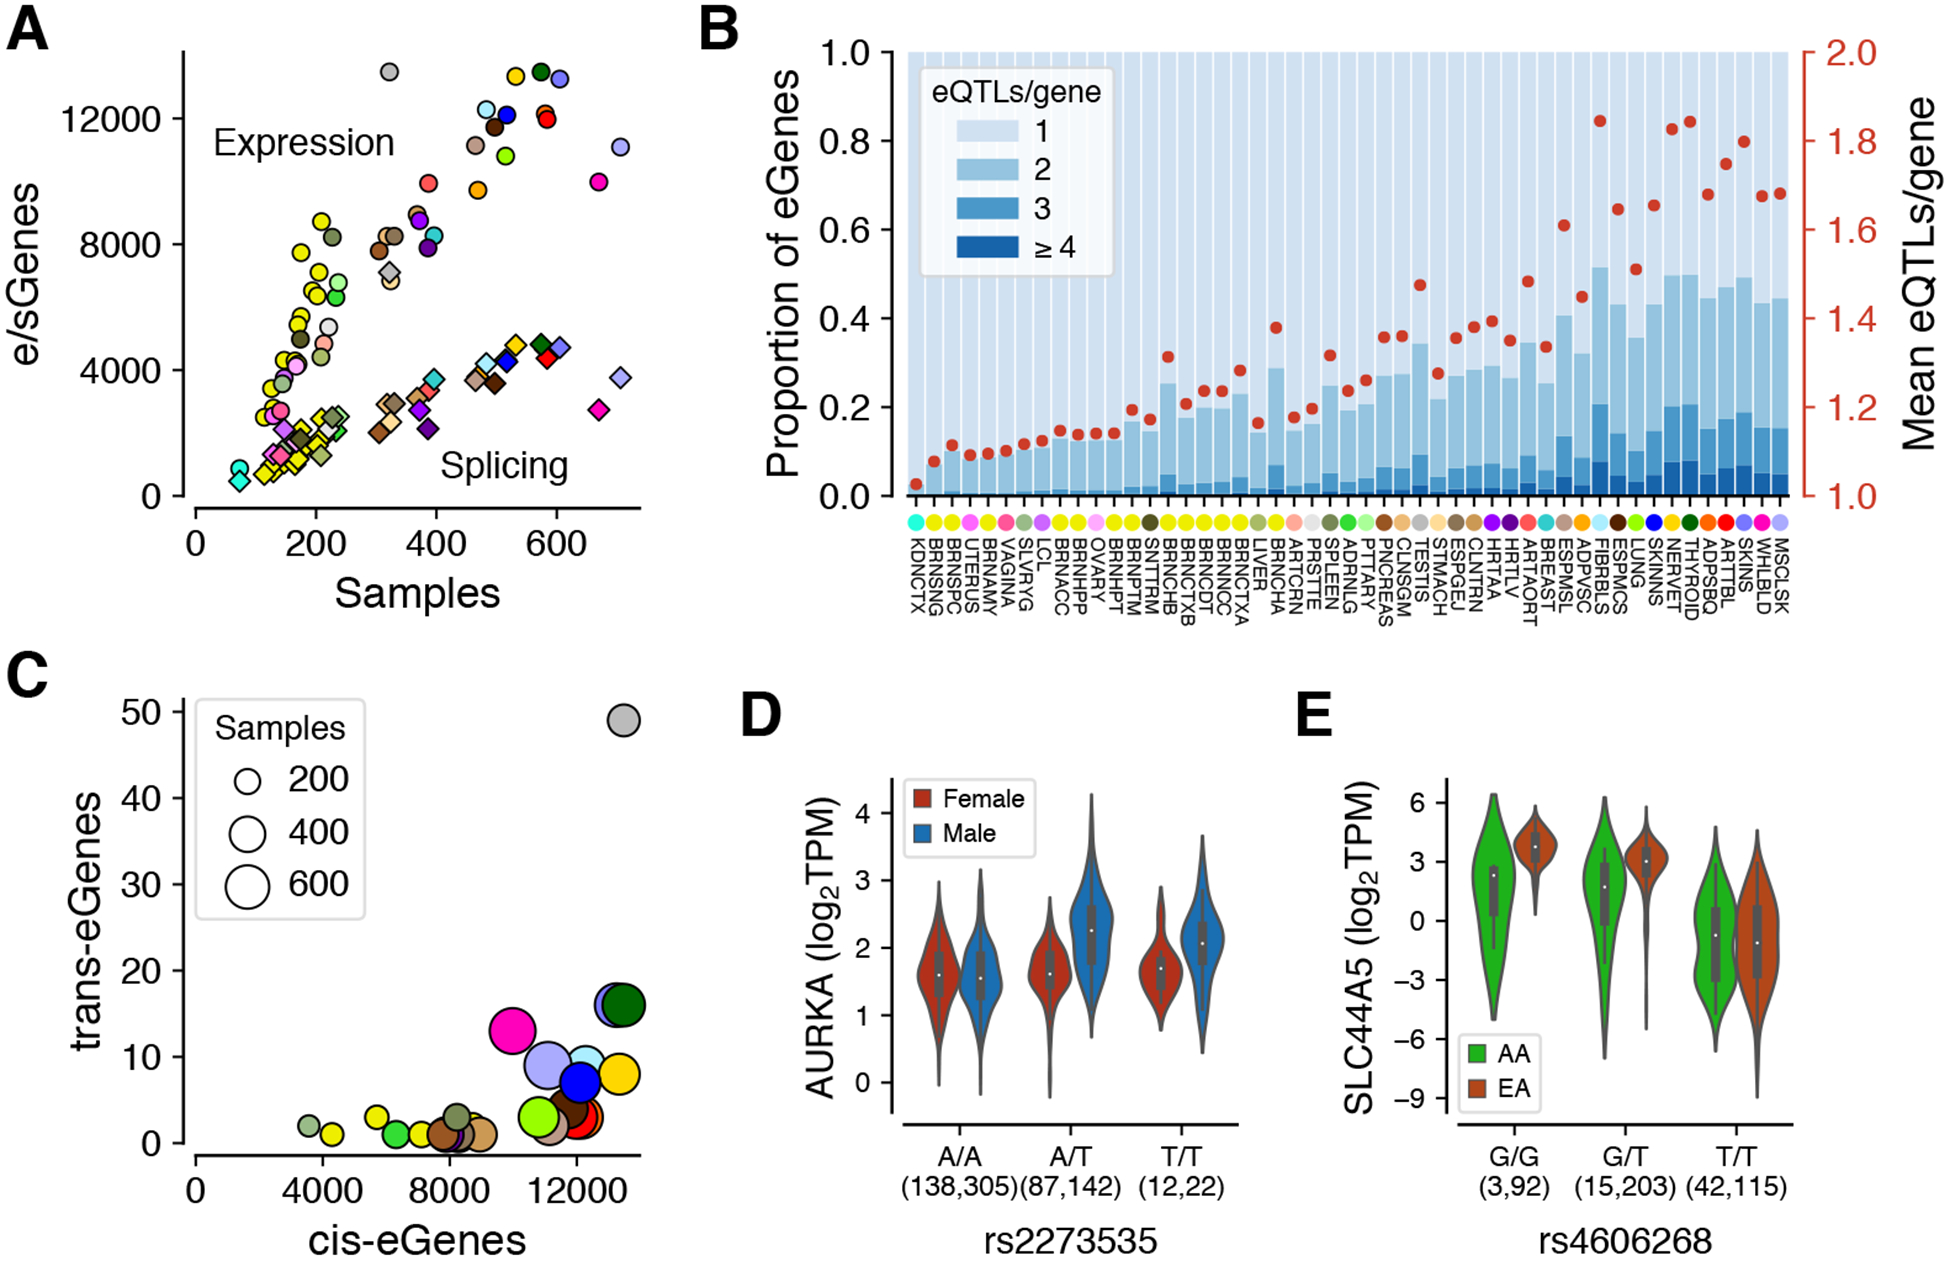
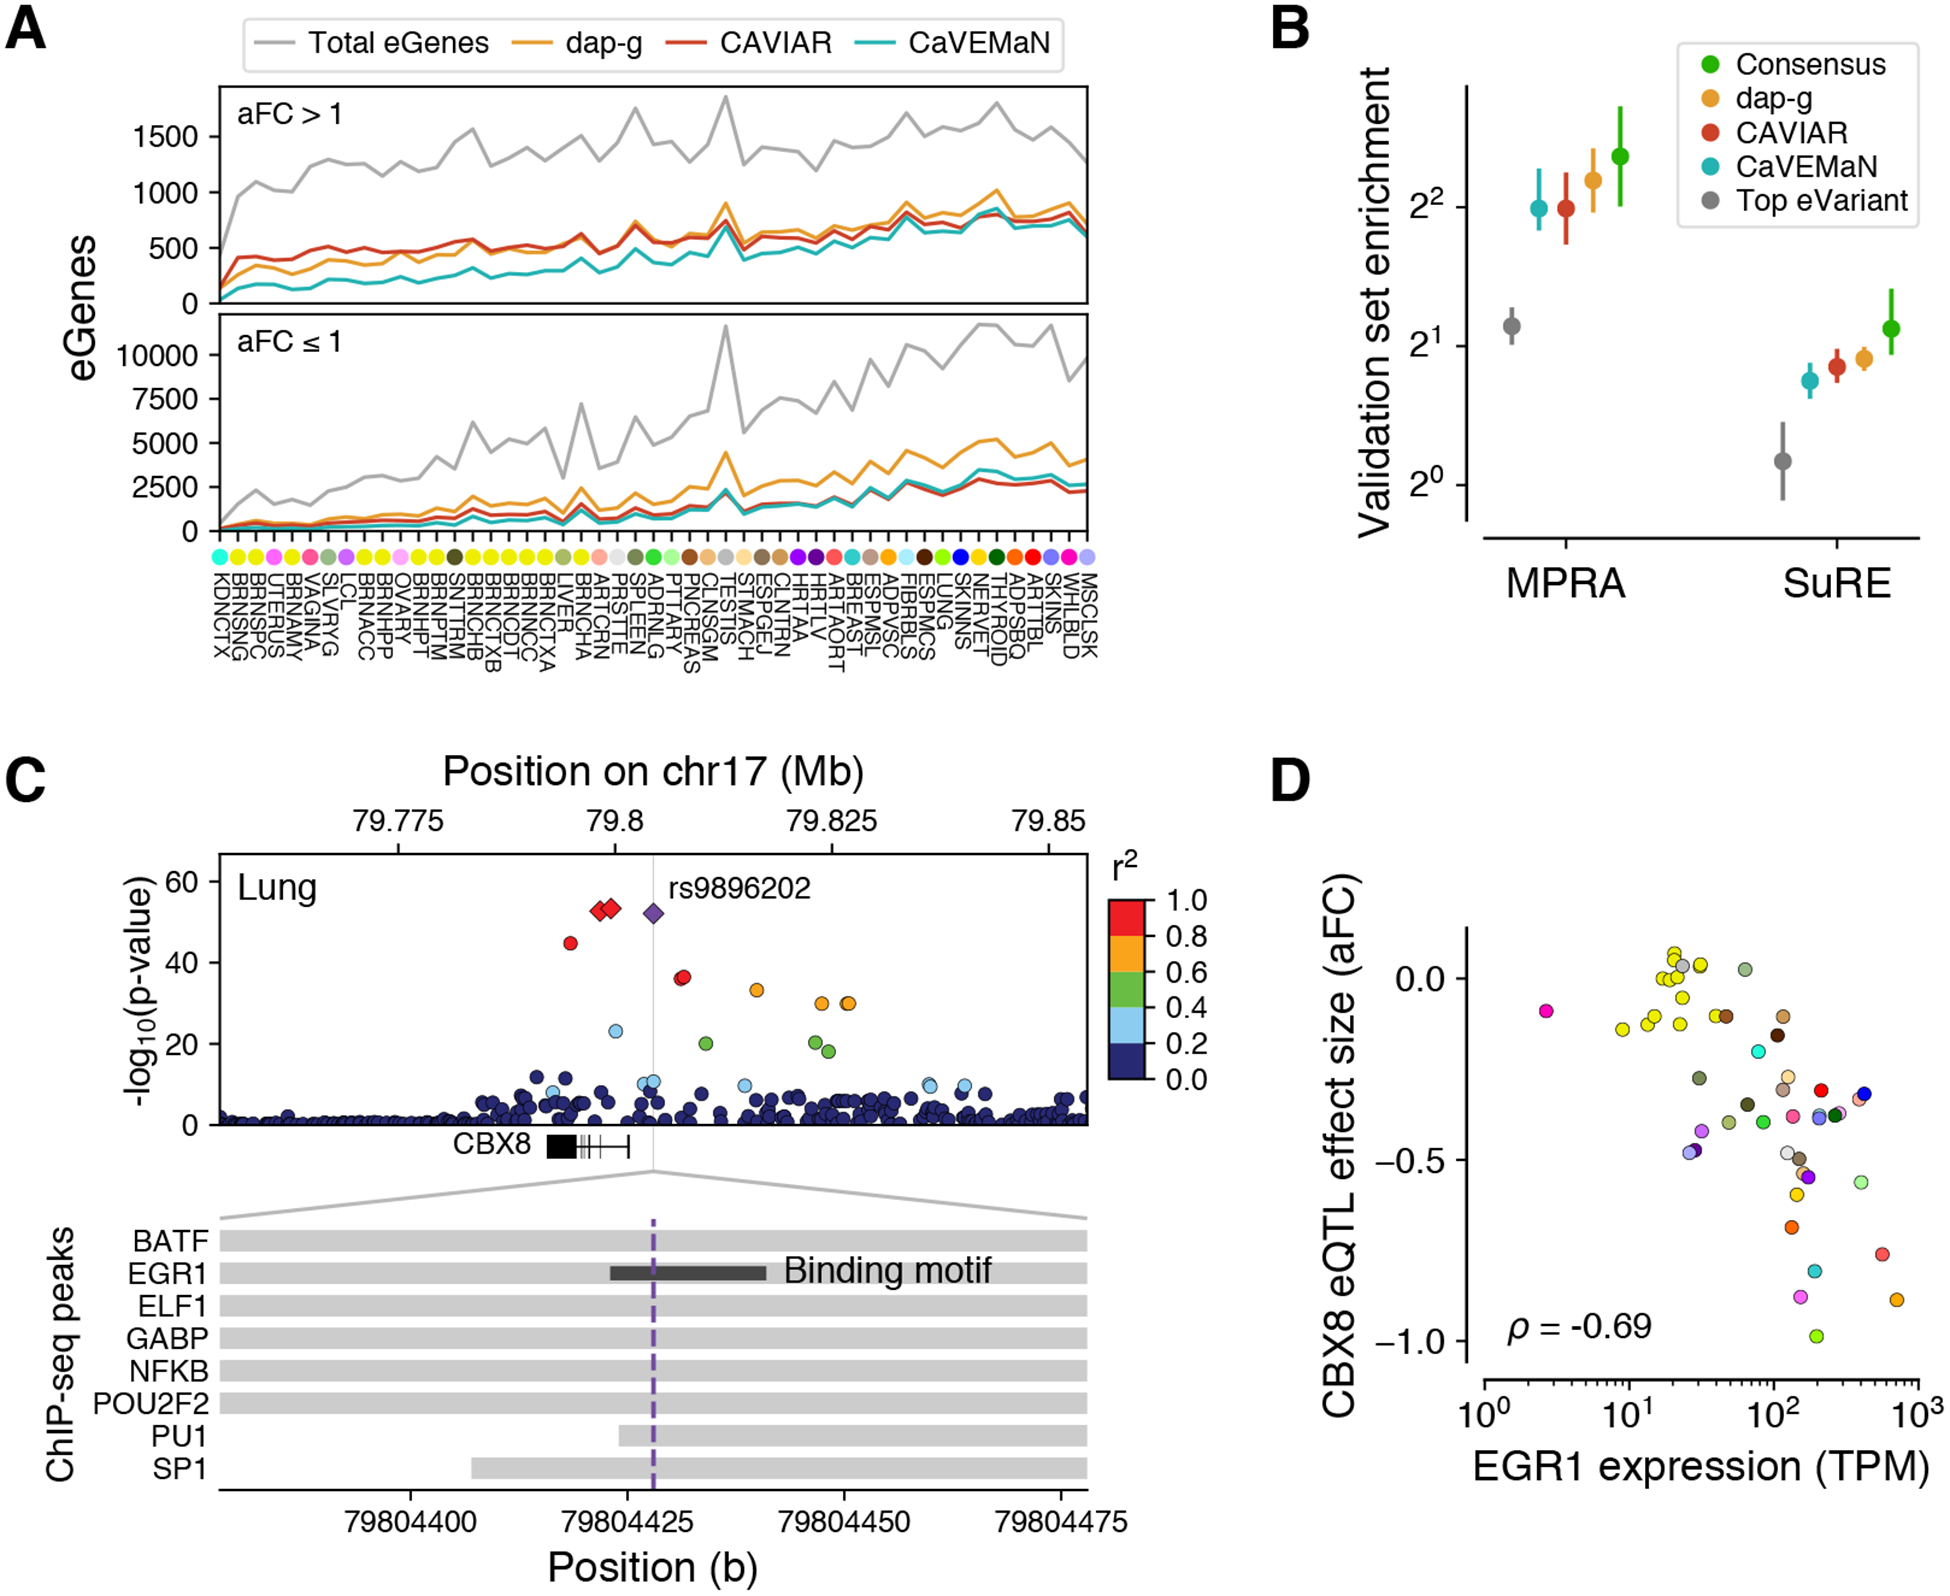
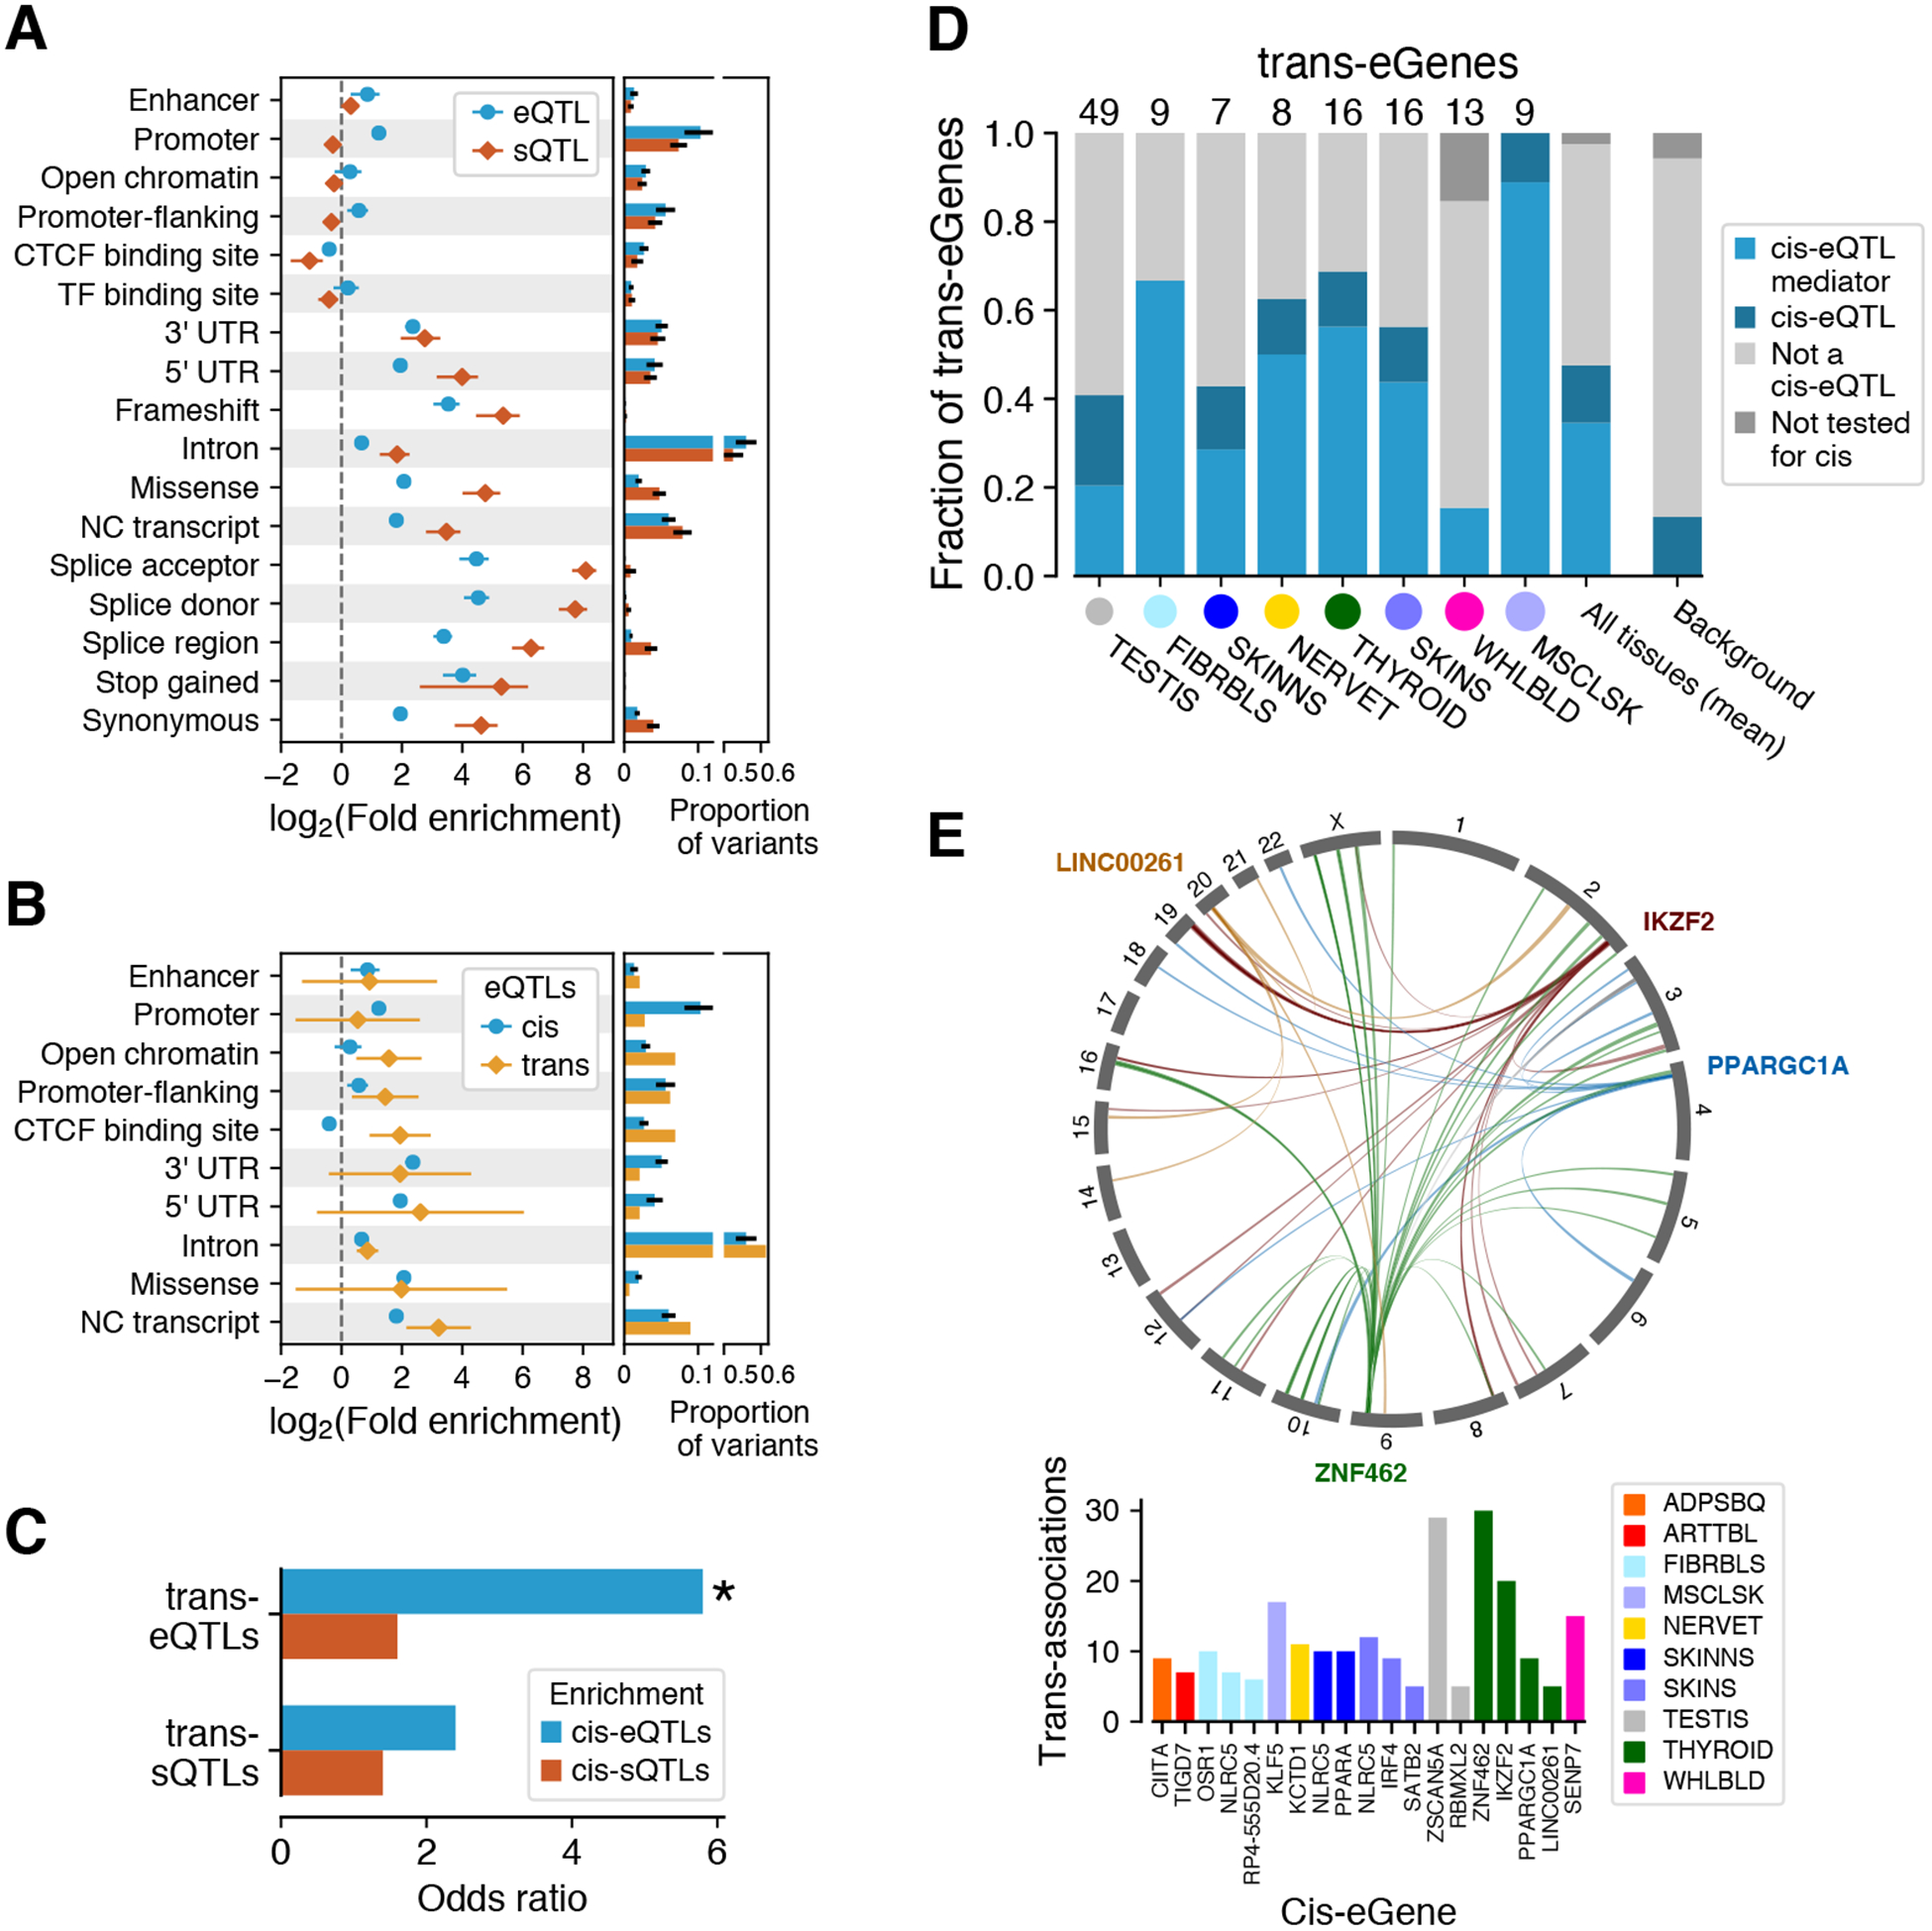
The Genotype-Tissue Expression (GTEx) project was established to characterize genetic effects on the transcriptome across human tissues and to link these regulatory mechanisms to trait and disease associations. Here, we present analyses of the version 8 data, examining 15,201 RNA-sequencing samples from 49 tissues of 838 postmortem donors. We comprehensively characterize genetic associations for gene expression and splicing in cis and trans, showing that regulatory associations are found for almost all genes, and describe the underlying molecular mechanisms and their contribution to allelic heterogeneity and pleiotropy of complex traits. Leveraging the large diversity of tissues, we provide insights into the tissue specificity of genetic effects and show that cell type composition is a key factor in understanding gene regulatory mechanisms in human tissues.


Conflict of interest statement

Competing interests

F.A. is an inventor on a patent application related to TensorQTL; S.E.C. is a co-founder, chief technology officer and stock owner at Variant Bio; E.R.G. is on the Editorial Board of Circulation Research, and does consulting for the City of Hope / Beckman Research Institut; E.T.D. is chairman and member of the board of Hybridstat LTD.; B.E.E. is on the scientific advisory boards of Celsius Therapeutics and Freenome; G.G. receives research funds from IBM and Pharmacyclics, and is an inventor on patent applications related to MuTect, ABSOLUTE, MutSig, MSMuTect, MSMutSig, POLYSOLVER and TensorQTL. G.G. is a founder, consultant and holds privately held equity in Scorpion Therapeutics; S.B.M. is on the scientific advisory board of MyOme; D.G.M. is a co-founder with equity in Goldfinch Bio, and has received research support from AbbVie, Astellas, Biogen, BioMarin, Eisai, Merck, Pfizer, and Sanofi-Genzyme; H.K.I. has received speaker honoraria from GSK and AbbVie.; T.L. is a scientific advisory board member of Variant Bio with equity and Goldfinch Bio. P.F. is member of the scientific advisory boards of Fabric Genomics, Inc., and Eagle Genomes, Ltd. P.G.F. is a partner of Bioinf2Bio.

Figures

Figure 1.
Figure 1.. Sample and data types in the GTEx v8 study.
(A) Illustration of the 54 tissue types examined (including 11 distinct brain regions and 2 cell lines), with sample numbers from genotyped donors in parentheses and color coding indicated in the adjacent circles. Tissues with ≥70 samples were included in QTL analyses. (B) Illustration of the core data types used throughout the study. Gene expression and splicing were quantified from bulk RNA-seq of heterogenous tissue samples, and local and distal genetic effects (cis-QTLs and trans-QTLs, respectively) were quantified across individuals for each tissue.
Figure 2.
Figure 2.. QTL discovery.
(A) The number of genes with a cis-eQTL (eGenes) or cis-sQTL (sGenes) per tissue, as a function of sample size. See Fig. 1A for the legend of tissue colors. (B) Allelic heterogeneity of cis-eQTLs depicted as proportion of eGenes with ≥1 independent cis-eQTLs (blue stacked bars; left y-axis) and as a mean number of cis-eQTLs per gene (red dots; right y-axis). The tissues are ordered by sample size. (C) The number of genes with a trans-eQTL as a function of the number of cis-eGenes. (D) Sex-biased cis-eQTL for AURKA in skeletal muscle, where rs2273535-T is associated with increased AURKA expression in males (p = 9.02×10⁻²⁷) but not in females (p = 0.75). (E) Population-biased cis-eQTL for SLC44A5 in esophagus mucosa (allelic fold change = −2.85 and −4.82 and in African Americans (AA) and European Americans (EA), respectively; permutation p-value = 1.2×10⁻³).
Figure 3.
Figure 3.. Fine mapping of cis-eQTLs.
(A) Number of eGenes per tissue with variants fine-mapped with >0.5 posterior probability of causality, using three methods. The overall number of eGenes with at least one fine-mapped eVariant increases with sample size for all methods. However, this increase is in part driven by better statistical power to detect small effect size cis-eQTLs (aFC or allelic fold change ≤1 in log2 scale; see also fig. S14) with larger sample sizes, and the proportion of well fine-mapped eGenes with small effect sizes increases more modestly with sample size (bottom vs. top panels), indicating that such cis-eQTLs are generally more difficult to fine-map. (B) Enrichment of variants among experimentally validated regulatory variants, shown for the cis-eVariant with the best p-value (top eVariant), and those with posterior probability of causality >0.8 according to each of the three methods individually or all of them (consensus). Error bars: 95% CI. (C) The cis-eQTL signal for CBX8 is fine-mapped to a credible set of three variants (red and purple diamonds), of which rs9896202 (purple diamond) overlaps a large number of transcription factor binding sites in ENCODE ChIP-seq data and disrupts the binding motif of EGR1. (D) The potential role of EGR1 binding driving this cis-eQTL is further supported by correlation between EGR1 expression and the CBX8 cis-eQTL effect size across tissues.
Figure 4.
Figure 4.. Functional mechanisms of genetic regulatory effects.
QTL enrichment in functional annotations for (A) cis-eQTLs and cis-sQTLs and for (B) trans-eQTLs. cis-QTL enrichment is shown as mean ± s.d. across tissues; trans-eQTL enrichment as 95% C.I. (C) Enrichment of lead trans-e/sVariants that have been tested for in cis-QTL effects being significant also cis-e/sVariants in the same tissue. * denotes significant enrichment, p < 10−21. (D) Proportion of trans-eQTLs that are significant cis-eQTLs or mediated by cis-eQTLs. (E) Trans associations of cis-mediating genes identified through colocalization (PP4 > 0.8 and nominal association with discovery trans-eVariant p < 10−5). Top: associations for four Thyroid cis-eQTLs (indicated by gene names); bottom: cis-mediating genes with ≥5 colocalizing trans-eQTLs.
Figure 5.
Figure 5.. Regulatory mechanisms of GWAS loci.
(A) GWAS enrichment of cis-eQTLs, cis-sQTLs, and trans-eQTLs measured with different approaches: enrichment calculated from GWAS summary statistics of the most significant cis-QTL per eGene/sGene with QTLEnrich and LD Score regression with all significant cis-QTLs (S-LDSC all cis-QTLs), simple QTL overlap enrichment with all GWAS catalog variants, and LD Score regression with fine-mapped cis-QTLs in the 95% credible set (S-LDSC credible set) and using posterior probability of causality as a continuous annotation (S-LDSC causal posterior). Enrichment is shown as mean and 95% CI. (B) Number of GWAS loci linked to e/sGenes through colocalization (ENLOC) and association (PrediXcan), aggregated across tissues. (C) Concordance of mediated effects among independent cis-eQTLs for the same gene, shown for different levels of regional colocalization probability (RCP (32)), which is used as a proxy for the gene’s causality. As the null, we show the concordance for LD matched genes without colocalization. (D) Proportion of colocalized cis-eQTLs with a matching phenotype for genes with different level of rare variant trait association in the UK Biobank (UKB). (E) Horizontal GWAS trait pleiotropy score distribution for cis-eQTLs that regulate multiple vs. a single gene (left), and for cis-eQTLs that are tissue-shared vs. specific.
Figure 6.
Figure 6.. Tissue-specificity of cis-QTLs.
(A) Tissue clustering with pairwise Spearman correlation of cis-eQTL effect sizes. (B) Similarity of tissue clustering across core data types quantified using median pairwise Rand index calculated across tissues. (C) Tissue activity of cis expression and splicing QTLs, where an eQTL was considered active in a tissue if it had a mashr local false sign rate (LFSR, equivalent to FDR) of < 5%. This is shown for all cis-QTLs and only those that could be tested in all 49 tissues (red and blue). (D) Spearman correlation (corr.) between cis-eQTL effect size and eGene expression level across tissues. cis-eQTL counts are shown for those not tested due to low expression level, tested but without significant (FDR < 5%) correlation (uncorrelated), a significant correlation but effect sizes crossed zero which made the correlation direction unclear (uninterpretable), positively correlated, and negatively correlated. (E-F) The effect of genomic function on cis-QTL tissue sharing modeled using logistic regression with functional annotations (E) and chromatin state (F). CTCF Peak, Motif, TF Peak, and DHS indicate if the cis-QTL lies in a region annotated as having one of these features in any of the Ensembl Regulatory Build tissues. For chromatin states, model coefficients are shown for the discovery and replication tissues that have the same or different chromatin states.
Figure 7.
Figure 7.. Cell type interacting cis-eQTLs and cis-sQTLs.
(A) Number of cell type interacting cis-eQTLs and cis-sQTLs (ieQTLs and isQTLs, respectively) discovered in seven tissue-cell type pairs, with shading indicating whether the ieGene or isGene was discovered by cis-eQTL/cis-sQTL analysis in bulk tissue. Colored dots are proportional to sample size. (B) Functional enrichment of neutrophil ieQTLs and isQTLs compared to cis-eQTLs and cis-sQTLs from whole blood. (C) Proportion of conditionally independent cis-eQTLs per eGene, for eGenes that do or do not have ieQTLs in GTEx, and for eGenes that have shared (= eQTLs) or non-shared (≠ eQTLs) cis-eQTL across five sorted blood cell types. (D) Whole blood cis-eQTL p-value landscape for NCOA4, for the standard analysis (top row, Unconditional) and for two independent cis-eQTLs (bottom rows). In a data set of 5 sorted cell types (56), analyses of all cell types yielded a lead eVariant, rs2926494 (left), which is in high LD with the first independent cis-eQTL but not the second. The lead variant in monocyte cis-eQTL analysis, rs10740051, is in high LD with the second conditional cis-eQTL, indicating that this cis-eQTL is active specifically in monocytes. Thus, the full GTEx whole blood cis-eQTL pattern and allelic heterogeneity is composed of cis-eQTLs that are active in different cell types. (E) COLOC posterior probability (PP4) of GWAS colocalization with whole blood ieQTLs and eQTLs of the same eGene. 349 gene-trait combinations across 132 genes and 36 GWAS traits showed evidence of colocalization (PP4 > 0.5) with an ieQTL and/or eQTL.

Comment in

  • Reaching completion for GTEx.
    Burgess DJ. Burgess DJ. Nat Rev Genet. 2020 Dec;21(12):717. doi: 10.1038/s41576-020-00296-7. Nat Rev Genet. 2020. PMID: 33060849 No abstract available.

Similar articles

Cited by

References

    1. ENCODE Project Consortium, An integrated encyclopedia of DNA elements in the human genome. Nature 489, 57–74 (2012). - PMC - PubMed
    1. Roadmap Epigenomics Consortium, et al., Integrative analysis of 111 reference human epigenomes. Nature 518, 317–330 (2015). - PMC - PubMed
    1. Battle A, et al., Characterizing the genetic basis of transcriptome diversity through RNA-sequencing of 922 individuals. Genome Research 24, 14–24 (2014). - PMC - PubMed
    1. Lappalainen T, et al., Transcriptome and genome sequencing uncovers functional variation in humans. Nature 501, 506–511 (2013). - PMC - PubMed
    1. Bonder MJ, et al., Disease variants alter transcription factor levels and methylation of their binding sites. Nature Genetics 49, 131–138 (2017). - PubMed

Publication types

Grants and funding