. 2020 Oct;15(10):3264-3283.
doi: 10.1038/s41596-020-0373-x. Epub 2020 Sep 10.

Efficient low-cost chromatin profiling with CUT&Tag

Affiliations

Efficient low-cost chromatin profiling with CUT&Tag

Hatice S Kaya-Okur et al. Nat Protoc. 2020 Oct.

Abstract

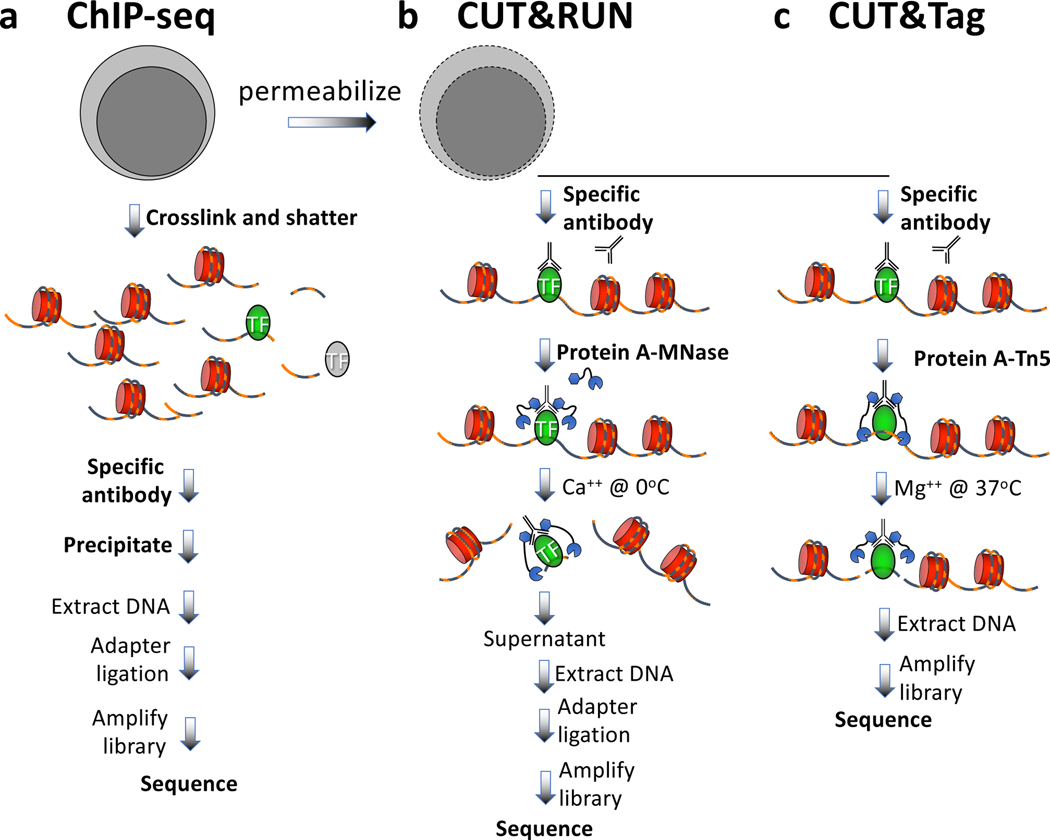
We recently introduced Cleavage Under Targets & Tagmentation (CUT&Tag), an epigenomic profiling strategy in which antibodies are bound to chromatin proteins in situ in permeabilized nuclei. These antibodies are then used to tether the cut-and-paste transposase Tn5. Activation of the transposase simultaneously cleaves DNA and adds adapters ('tagmentation') for paired-end DNA sequencing. Here, we introduce a streamlined CUT&Tag protocol that suppresses DNA accessibility artefacts to ensure high-fidelity mapping of the antibody-targeted protein and improves the signal-to-noise ratio over current chromatin profiling methods. Streamlined CUT&Tag can be performed in a single PCR tube, from cells to amplified libraries, providing low-cost genome-wide chromatin maps. By simplifying library preparation CUT&Tag requires less than a day at the bench, from live cells to sequencing-ready barcoded libraries. As a result of low background levels, barcoded and pooled CUT&Tag libraries can be sequenced for as little as $25 per sample. This enables routine genome-wide profiling of chromatin proteins and modifications and requires no special skills or equipment.


Figures

Figure 1 |
Figure 1 |. Steps in antibody-targeted chromatin profiling strategies.
a) ChIP-seq, b) CUT&RUN; c) CUT&Tag. Cells are indicated in grey, chromatin as red nucleosomes, and a specific chromatin protein in green. See text for details of each procedure.
Figure 2 |
Figure 2 |. CUT&Tag provides high signal-to-noise and reproducibility for native and lightly cross-linked cells and nuclei.
H3K4me3 CUT&Tag was performed on native and cross-linked cells and nuclei from the same batch on two different occasions (biological replicates 1 and 2 using the DNA extraction option for nuclei). Barcoded libraries were mixed with 70 other barcoded libraries and sequenced, yielding at least 1 million fragments. a) H3K4me3 CUT&Tag (blue), ENCODE H3K4me3 ChIP-seq (magenta GSM733680), ATAC-seq (GSM2695560) and Omni-ATAC (SRX2894091–2) tracks (green) for K562 cells. b) MACS2 was used to call peak counts for datasets shown in (a) and additional datasets from ENCODE (H3K4me3) and GEO (Omni-ATAC) to calculate the Fraction of Reads in Peaks (FRiP). The multicolored curves without marker dots represent the 8 CUT&Tag replicates. c) The 8 CUT&Tag datasets were pooled for FRiP comparisons to ChIP-seq for up to 18 million fragments. d) A correlation matrix of MACS2 narrow peak calls for biological replicates representing the 8 CUT&Tag datasets and pooled IgG datasets and the 6 ENCODE datasets from three laboratories. Peaks were called using MACS2 on the pooled CUT&Tag H3K4me3 resulting in 12,224 peaks, from which 223 were removed because of high IgG density. Pairwise correlations of mean normalized counts were calculated over a span of ±150 bp around each summit. Numbers along the diagonal are R2 values between successive rows; for example between IgG and USC1 R2 = 10−4, between USC1 and USC2 R2 = 0.74, and between USC2 and Broad1 R2 = 0.44.
Figure 3 |
Figure 3 |. Comparison of single-cell CUT&Tag (scCUT&Tag) to single-cell ChIP-seq.
The same monoclonal antibody was used for H3K27me3 scCUT&Tag and scChIP-seq allowing a direct comparison of aggregated single-cell datasets. a) Tracks from a representative region of the human genome. Although different hematopoetic cancer cell lines were used, this region shows similar profiles for diverse cancer and normal lines (indicated on right). To quantify approximate signal-to-noise differences, we calculated the fold enrichment over the H3K27me3-enriched domain (132,768,919–132,935,822) relative to that for the flanking regions (132,467,734–132,768,918 and 132,935,823–133,789,152) for each track relative to the fold enrichment for the ENCODE USC K562 input track (“Enr” numbers for each track). b) Noisiness of scChIP-seq data relative to CUT&Tag data is confirmed by FRiP analysis. c) Knee plot showing the read/cell distribution estimated from aggregate data using the Picard Mark Duplicates program. Medians are indicated, where for scCUT&Tag all cells were scored and for scChIP-seq cells below a threshold were not scored.
Figure 4 |
Figure 4 |. Similar results are obtained using DNA extraction and single-tube CUT&Tag options.
a) Image of a capillary electrophoretic gel for a typical experiment. Native and cross-linked nuclei were prepared and frozen in advance. Samples were thawed, mixed with beads and ~120,000 nuclei were aliquoted into each PCR tube. All steps through TapeStation analysis were performed in one day in parallel for both the extraction and single-tube (direct) options. The 16 samples were mixed in equimolar amounts with 56 other samples and sequenced (paired-end 25×25), yielding a median of 2.7 million mapped reads per sample. Estimated library size is indicated below. b) Length distribution for sequenced fragments from H3K27me3 CUT&Tag. The striking 10-bp sawtooth pattern that diminishes with length suggests a tagmentation preference for one surface of the DNA double-helix at a fixed distance on and around the bound particle. c) The same 300-kb GART-SON region displayed in Figure 2 is shown for the Direct-to-PCR single-tube samples. The negative control had been incubated with a validated H3K27ac mouse monoclonal antibody followed by the anti-rabbit secondary antibody, which suppressed the signal. d) Mapped fragments were sampled and narrow peaks were called using MACS2 with p-value = 10−5 and FRiP values were calculated.
Figure 5|
Figure 5|. Suppression of accessible DNA tagmentation.
a) A representative region spanning a large H3K27me3 domain flanked by oppositely oriented promoters marked by H3K4me3 nucleosomes just downstream of the TSSs in K562 cells. CUT&Tag with DNA extraction was performed on ~70,000 lightly cross-linked frozen and thawed nuclei per sample using the DNA extraction option except that the third wash and tagmentation steps were done in 10 mM TAPS pH8.5. This resulted in peaks over the TSSs for H3K27me3 that are nearly absent in the presence of 300 mM NaCl. For clarity 5 kb regions around both promoters are expanded on the right, revealing that the low-salt peaks align with the Omni-ATAC peaks and the promoters, but are offset from the H3K4me3 nucleosomes downstream (dashed lines). b) Heatmap representations and c) average plots of 24,183 annotated promoters (top) and 56,622 ATAC-seq MACS2 peak summits (bottom) for CUT&Tag histone modifications and the NPAT chromatin protein, showing genome-wide suppression of accessible DNA peaks when tagmentation is performed in the presence of 300 mM NaCl. Heatmaps were separately ordered by signal over the displayed region using Deeptools.
Figure 6 |
Figure 6 |. CoBATCH and ACT-seq peaks correspond to ATAC-seq peak summits genome-wide.
a) Heatmaps are similar between ATAC-seq summits and CoBATCH H3K27me3 signals but correspond to depleted H3K27me3 ChIP-seq signals in mESCs. LIkewise, CoBATCH CBP, P300 and EZH2 summits correspond to one another genome-wide with an ~10-fold larger dynamic range than is seen for ATAC-seq (0 to 200–350 for CoBATCH, 0–20 for ATAC-seq). For each dataset, heatmaps are ordered by decreasing normalized count density. The ATAC-seq track shown is better than average based on comparing mESC ATAC-seq tracks from 8 different laboratories (Supplementary Fig. 1). b) Representative examples from tracks shown Figure 2C of Ref. . The EZH2 track from the figure image (yellow) is superimposed over the track of the same region reproduced from the data in GEO, confirming correspondence between the published CoBATCH image and the source data used here. Profiles for CBP, P300 and EZH2 closely correspond to one another and to ATAC-seq peaks, although with much lower background, and lack the broad domains seen for H3K27me3 ChIP-seq profiles. c) Average plots of the data shown in panel a. d) Comparison of H3K4me3 ChIP-seq to ACT-seq and ATAC-seq heatmaps. ACT-seq shows a chromatin accessibility profile with a ~10-fold larger dynamic range than is seen for ATAC-seq (0 to 250 for ACT-seq, 0–20 for ATAC-seq). e) Average plot of the dataset shown in top panels of (d). f) A representative region showing bidirectional housekeeping promoters and R2 Pearson correlation coefficients over the region between ACT-seq, ATAC-seq and ChIP-seq from human K562 cells. g) A nearby representative gene region showing the promoter marked by ACT-seq, ATAC-seq and H3K4me3 ChIP and an intronic region marked by ACT-seq and ATAC-seq, but not by ChIP-seq. Heatmaps were separately ordered by signal over the displayed region using Deeptools.

References

    1. Rodriguez-Ubreva J & Ballestar E Chromatin immunoprecipitation. Methods Mol Biol 1094, 309–18 (2014). - PubMed
    1. Solomon MJ & Varshavsky A Formaldehyde-mediated DNA-protein crosslinking: a probe for in vivo chromatin structures. Proc Natl Acad Sci U S A 82, 6470–4 (1985). - PMC - PubMed
    1. Rossi MJ, Lai WKM & Pugh BF Simplified ChIP-exo assays. Nat Commun 9, 2842 (2018). - PMC - PubMed
    1. He Q, Johnston J & Zeitlinger J ChIP-nexus enables improved detection of in vivo transcription factor binding footprints. Nat Biotechnol 33, 395–401 (2015). - PMC - PubMed
    1. Skene PJ & Henikoff S A simple method for generating high-resolution maps of genome wide protein binding. eLife 4, e09225 (2015). - PMC - PubMed

Publication types