. 2020 Sep 10;11(1):4524.
doi: 10.1038/s41467-020-18113-4.

Meningeal lymphatic dysfunction exacerbates traumatic brain injury pathogenesis

Affiliations

Meningeal lymphatic dysfunction exacerbates traumatic brain injury pathogenesis

Ashley C Bolte et al. Nat Commun. .

Abstract

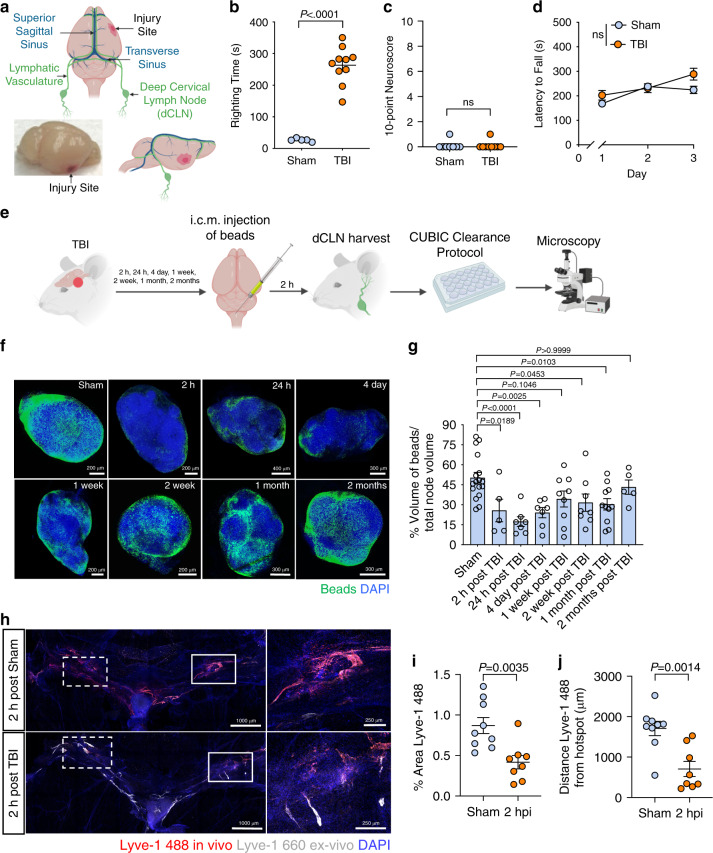
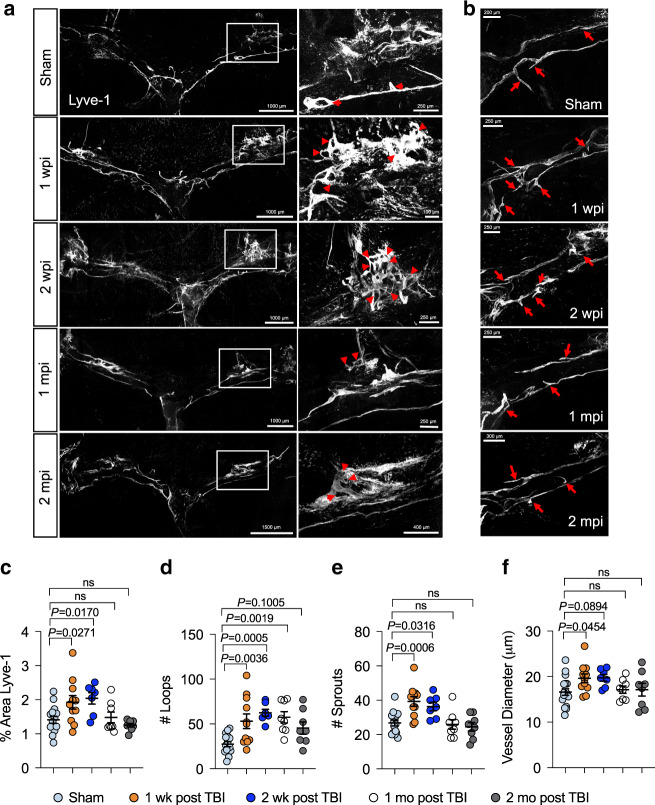
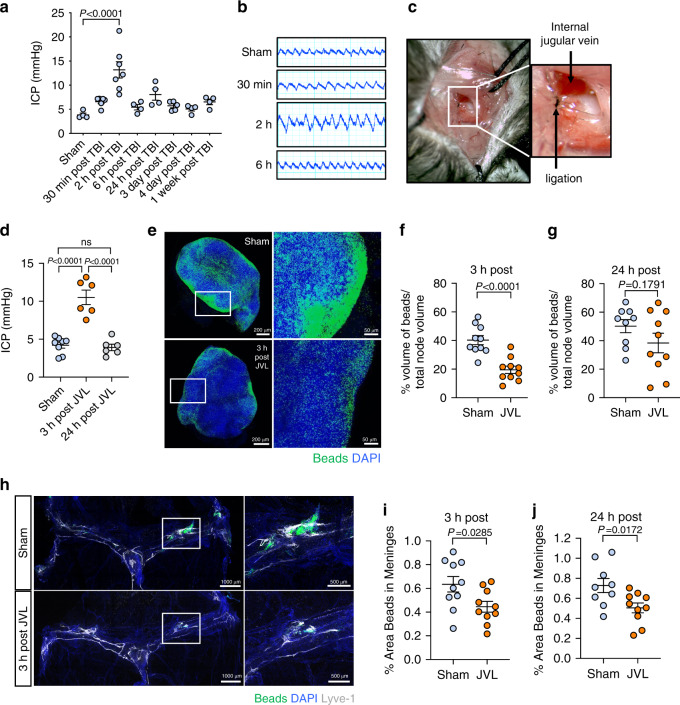
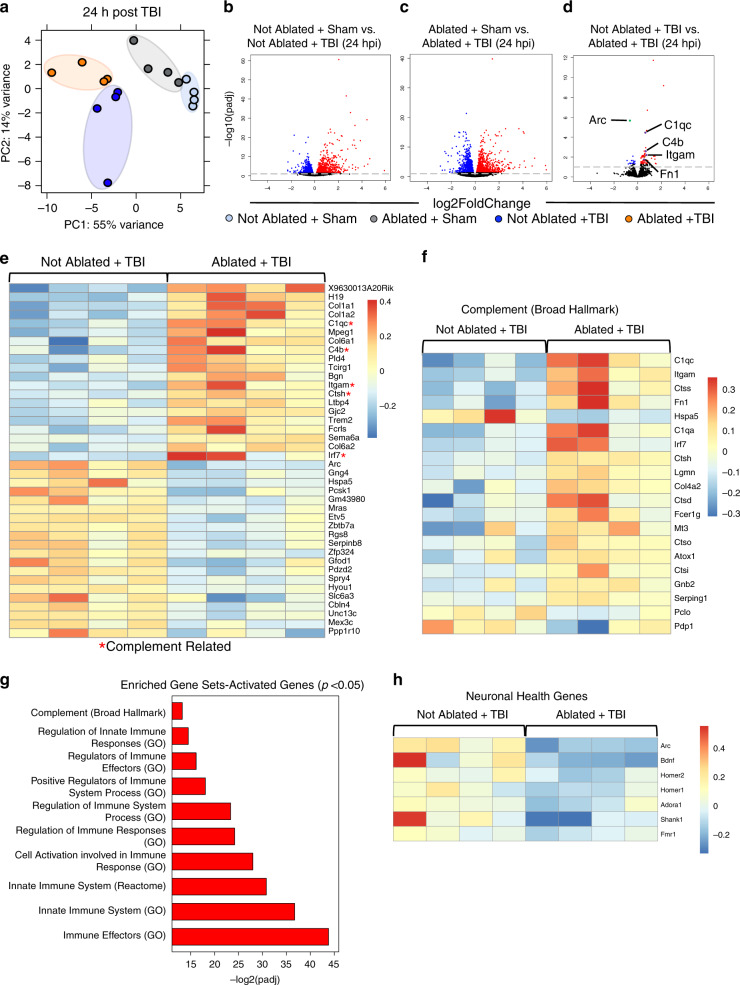
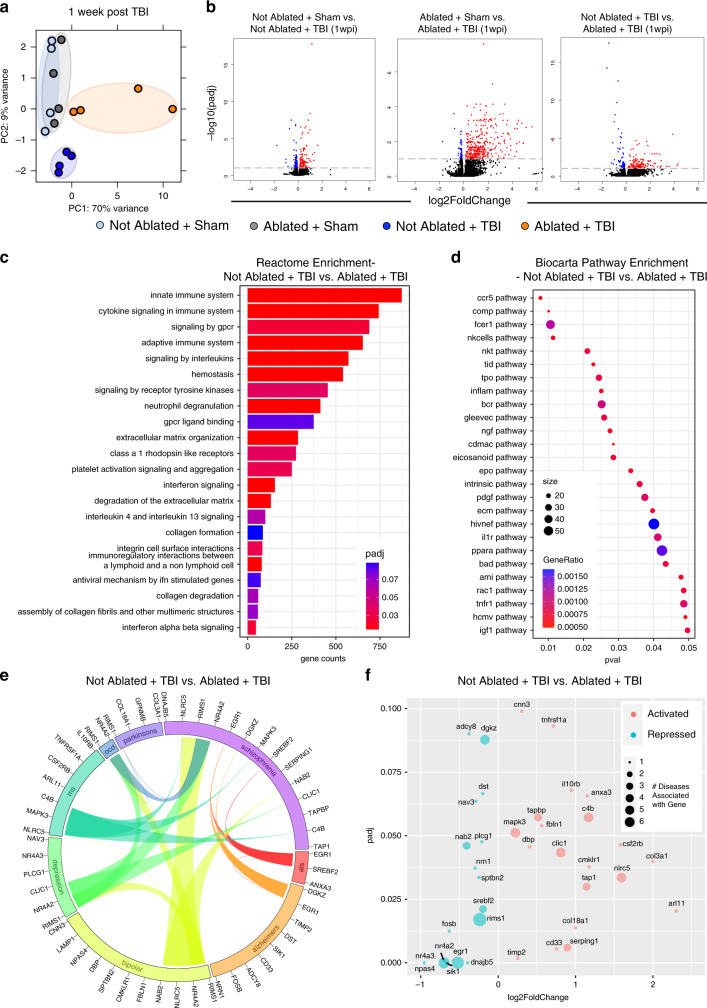
Traumatic brain injury (TBI) is a leading global cause of death and disability. Here we demonstrate in an experimental mouse model of TBI that mild forms of brain trauma cause severe deficits in meningeal lymphatic drainage that begin within hours and last out to at least one month post-injury. To investigate a mechanism underlying impaired lymphatic function in TBI, we examined how increased intracranial pressure (ICP) influences the meningeal lymphatics. We demonstrate that increased ICP can contribute to meningeal lymphatic dysfunction. Moreover, we show that pre-existing lymphatic dysfunction before TBI leads to increased neuroinflammation and negative cognitive outcomes. Finally, we report that rejuvenation of meningeal lymphatic drainage function in aged mice can ameliorate TBI-induced gliosis. These findings provide insights into both the causes and consequences of meningeal lymphatic dysfunction in TBI and suggest that therapeutics targeting the meningeal lymphatic system may offer strategies to treat TBI.


Conflict of interest statement

Competing interests: J.K. is an advisor to PureTech Health/Ariya. All other authors declare no competing interests.

Figures

Fig. 1
Fig. 1. TBI leads to impairments in meningeal lymphatic drainage.
a Location of injury site in relation to the CNS lymphatic vasculature. b Righting times of TBI and sham mice (Sham n = 5, TBI n = 10; representative data from 10 independent experiments). c The 10-point gross neuroscore test 1 h after TBI (Sham n = 8, TBI n = 9; representative data from two independent experiments). d The accelerating rotarod behavioral test was used to assess motor function the first 3 days after TBI (n = 10 mice per group; representative data from two independent experiments). e Schematic of the experimental layout where mice received TBI and then were injected intra-cisterna magna (i.c.m.) with 0.5 μm fluorescent beads. f Representative images and g quantification of bead accumulation in the cleared dCLN at 2 h, 24 h, 4 days, 1 week, 2 weeks, 1 month, and 2 months post TBI. Each data point represents an average of the 2 dCLNs from an individual mouse (Sham n = 17, 2 h n = 5, 24 h n = 7, 4 day n = 7, 1 week n = 9, 2 weeks n = 8, 1 month n = 11, 2 months n = 5; pooled data from five independent experiments). h Representative images of meningeal whole mounts 2 h after TBI stained for Lyve-1 488 (in vivo, red), Lyve-1 660 (ex vivo, gray), and DAPI (blue). Solid boxes show zoomed insets of the hotspots along the transverse sinus on the right. Dashed boxes indicate the other hotspots not featured in the inset. i) Percent area of Lyve-1 488 (in vivo, red) coverage at 2 h post TBI or sham, and j distance traveled of Lyve-1 488 staining along the transverse sinus 15 min after injection (Sham n = 9, TBI n = 8; pooled data from two independent experiments). All n values refer to the number of mice used and the error bars depict mean ± s.e.m. P values were calculated by two-tailed unpaired Student’s  t-test (b, c, i, j), repeated-measures two-way ANOVA with Bonferroni’s post hoc test (d), and one-way ANOVA with Bonferroni’s multiple comparison test (g). hpi, hour(s) post injury; h, hour(s); mo, month(s); wk, week(s). Source data (bd, g, i–j) are provided as a Source data file.
Fig. 2
Fig. 2. TBI causes changes in meningeal lymphatic vasculature morphology.
Mice received TBI or sham treatment and then meningeal whole mounts were harvested 1 week, 2 weeks, 1 month, and 2 months later. a Representative images depicting transverse sinuses (left) and meningeal lymphatic vasculature loops near lymphatic hotspots (right) and (c) quantification of the percent area coverage of Lyve-1 antibody staining and (d) the number of loops in meningeal whole mounts. Solid boxes show zoomed insets of the hotspots along the transverse sinus on the right. Red arrow heads in the insets of (a) denote meningeal lymphatic vasculature loops. b Representative images depicting meningeal lymphatic vasculature sprouts along the transverse sinuses and (e) quantification of the number of sprouts found in meningeal whole mounts. Red arrows in (b) denote meningeal lymphatic vasculature sprouts. f Quantification of the diameters of the meningeal lymphatic vessels. Each data point represents an independent mouse and is an average of 70 measurements along the transverse and superior sagittal sinuses per mouse. Data in (cf): Sham n = 15, 1 week n = 11, 2 weeks n = 7, 1 month n = 8, 2 months n = 8; pooled data from four independent experiments. All n values refer to the number of mice used and the error bars depict mean ± s.e.m. P values were calculated by a one-way ANOVA with Dunnett’s multiple corrections test (cf). mo month(s), mpi month(s) post injury, wk week(s), wpi week(s) post injury. Source data (cf) are provided as a Source data file.
Fig. 3
Fig. 3. Increases in intracranial pressure disrupt CNS lymphatic drainage.
a Measurements of intracranial pressure (ICP) and b representative pressure readings were collected at various time points after TBI (Sham n = 4, 30 min n = 6, 2 h n = 7, 6 h n = 4, 24 h n = 4, 3 days n = 5, 4 days n = 4, 1 week n = 4; pooled data from three independent experiments). c Representative images of internal jugular vein ligation (JVL). d ICP readings from mice that underwent bilateral JVL or a sham procedure 3 or 24 h prior (Sham n = 8, 3 h n = 6, 24 h n = 6; pooled data from three independent experiments). ej The internal jugular vein was ligated bilaterally and then 0.5 μm fluorescent beads were injected i.c.m. 3 h later. dCLN and meninges were then harvested from mice 2 h after bead injection. e Representative images of dCLN and graph showing drainage of beads (f) 3 h and (g) 24 h after jugular venous ligation. Each data point represents an average of the 2 dCLNs from an individual mouse (3 h: Sham n = 10, JVL n = 10, 24 h: Sham n = 9, JVL n = 10; pooled data from two independent experiments). Solid boxes of the node images on the left show zoomed insets of the images on the right. h Representative images of meningeal whole-mounts with 0.5 μm beads (green) stained with DAPI (blue) and Lyve-1 660 (gray) and graph depicting percent area of bead coverage (i) 3 h and (j) 24 h post-JVL. Solid box shows a zoomed inset of the hotspot along the transverse sinus on the right (3 h: Sham n = 10, JVL n = 10, 24 h: Sham n = 9, JVL n = 10; pooled data from two independent experiments). All n values refer to the number of mice used and the error bars depict mean ± s.e.m. P values calculated by one-way ANOVA with Bonferroni’s multiple comparison test (a) and Tukey’s multiple comparison test (d) and two-tailed unpaired Student’s t-test (f, g, i, j). ICP intracranial pressure, JVL jugular venous ligation, h hour(s), min minute(s). Source data (a, d, fg, ij) are provided as a Source data file.
Fig. 4
Fig. 4. Pre-existing meningeal lymphatic dysfunction alters gene expression 24 h after TBI.
Mice were subjected to an injection of Visudyne or vehicle i.c.m. and 15 min later a red laser was directed at 5 spots along the sinuses through the skull. After a week of rest, mice received TBI or a sham procedure. 24 h after injury, RNA was isolated from homogenized brains. Bulk RNA sequencing was performed on four experimental groups with four samples per group. a Principal component (PC) analysis showing clustering of samples. bd Volcano plots illustrate the number of significantly differentially expressed genes (FDR < 0.1). Blue data points represent significantly downregulated genes and red data points represent significantly upregulated genes. Individual genes are highlighted in (d), where select downregulated genes are marked green and select upregulated genes are marked purple. e Heatmap representation of the top 20 most significantly upregulated and downregulated (FDR < 0.1) genes in the Not Ablated + TBI vs. Ablated + TBI groups. The red star (*) indicates genes associated with the complement signaling cascade. f Heatmap representation of the 20 most significantly differentially expressed Broad Hallmark Complement-related genes in the Not Ablated + TBI vs. Ablated + TBI comparison. g Gene set enrichment analysis of upregulated genes in Ablated + TBI mice compared to Not Ablated + TBI mice (uncorrected p < 0.05). h Heatmap representation of genes associated with neuronal health in the Ablated + TBI group as compared to the Not Ablated + TBI group. FDR and P values were calculated with DEseq2 using the Wald test for significance following fitting to a negative binomial linear model and the Benjamini–Hochberg procedure to control for false discoveries. hpi hours post injury, padj adjusted p-value.
Fig. 5
Fig. 5. TBI leads to elevated expression of disease-associated genes when the brain possesses pre-existing lymphatic deficits.
Mice were subjected to an injection of Visudyne or vehicle i.c.m. and 15 min later a red laser was directed at 5 spots along the sinuses through the skull. After a week of rest, mice received TBI or a sham procedure. One week after injury, RNA was isolated from homogenized brains. Bulk RNA sequencing was performed on these four experimental groups with four individual mice per group. a Principal component (PC) analysis showing clustering of samples. b Volcano plots illustrate the number of significantly differentially expressed genes (FDR < 0.1). Blue data points represent significantly downregulated genes and red data points represent significantly upregulated genes. c, d Gene set enrichment analysis using the (c) Reactome database and (d) Biocarta pathway database shows enrichment of immune-related pathways with differentially expressed genes between TBI mice with pre-existing lymphatic dysfunction compared to mice with TBI alone. e Circos plot depicting differentially expressed genes in TBI mice with pre-existing lymphatic dysfunction compared to mice with TBI alone (FDR < 0.1) associated with neurodegenerative or psychiatric diseases. The proportion of the circle’s circumference allocated to each disease represents the number of genes associated with that disease that are also differentially expressed in the Not Ablated + TBI vs. Ablated + TBI comparison. The lines connecting genes within the circle indicate which genes were shared amongst disease signatures. f Scatterplot showing the adjusted P value and the expression changes of genes shown in (e). padj, adjusted p-value; pval, p-value. wpi week(s) post injury. FDR and P values were calculated with DEseq2 using the Wald test for significance following fitting to a negative binomial linear model and the Benjamini–Hochberg procedure to control for false discoveries.
Fig. 6
Fig. 6. Prior lymphatic defects lead to exacerbated TBI-induced inflammation and cognitive decline.
Mice were subjected to meningeal lymphatic photoablation or a control procedure and then to TBI or a sham procedure 1 week later. af Brains were harvested 2 weeks after TBI. a Representative images of the brain hemisphere ipsilateral to the injury and quantification of the percent area of (b) GFAP (red) and (c) Iba1 (gray) immunoreactivity (Sham groups n = 5, TBI groups n = 8). Dashed boxes denote the injury site. d Representative reconstructions of morphology of Iba1+ cells and (e) Sholl analysis. Each data point represents the number of Iba1 + branches intersecting with a radius of 0–50 μm from the soma, calculated by the average of 20 microglia per group (4 Iba1 +  cells per section, 5 mice per group). Number sign (#) indicates that all control groups were significantly different from the Ablated + TBI group from 18–32 μm; ****P < 0.0001, ***P = 0.0003, **P = 0.0034 (calculated at 23 μm). f Quantification of the average number of Iba1+ cells per field of view (Sham groups n = 5, TBI groups n = 8). g The percent performance increase on the accelerating rotarod from day 1 to day 3 post TBI or sham procedure (Not Ablated + Sham n = 20, Not Ablated + TBI n = 32, Ablated + Sham n = 19, Ablated + TBI n = 30; pooled data from four independent experiments). h NLRT experimental schematic and i percent time the mouse spent investigating each object over the total time investigating both objects (Not Ablated + Sham n = 14, Not Ablated + TBI n = 15, Ablated + Sham n = 14, Ablated + TBI n = 16; pooled data from two independent experiments). Each point represents the percent time one mouse spent with either the novel location object (orange) or the familiar location object (blue). All other n values refer to the number of mice used and the error bars depict mean ± s.e.m. P values calculated by two-way ANOVA with Tukey’s multiple comparison correction (b, c, e, f, g) and mixed two-tailed unpaired Student’s t-test with Holm-Sidak multiple comparison correction (i). Source data (bc, eg, i) are provided as a Source data file.
Fig. 7
Fig. 7. VEGF-C treatment of aged mice results in decreased neuroinflammation after TBI.
Aged mice (18–20 months old) received 2 μl of artificial CSF containing 1013 genome copies per ml of either AAV1-CMV-mVEGF-C or control AAV1-CMV-eGFP by i.c.m. injection to rejuvenate meningeal lymphatic drainage function. Young mice (8–10 weeks of age) received 2 μl of artificial CSF containing 1013 genome copies per ml of control AAV1-CMV-eGFP by i.c.m. injection. Mice were rested for two weeks and then were subjected to either TBI or sham procedures. Two weeks after injury, brains were harvested, sectioned and stained for markers of gliosis. a) Representative image of a meningeal whole mount 1 month after viral vector administration showing Lyve-1 (gray), DAPI (blue), and AAV1-CMV-eGFP (green). b Righting times (Young-GFP + TBI n = 10, Aged-GFP + TBI n = 14, Aged-VEGFC + TBI n = 16; pooled data from two independent experiments) and c 10-point gross neuroscore of mice at 1 h after TBI (Young-GFP + TBI n = 9, Aged-GFP + TBI n = 14, Aged-VEGFC + TBI n = 16; pooled data from two independent experiments). d Representative images of hemisphere ipsilateral to the site of injury stained with Iba1 (gray), GFAP (red), and DAPI (blue). Dashed boxes in merge column indicate lesion site. e–h Quantification of the percent area of (ef) Iba1 and (gh) GFAP immunoreactivity in the hemispheres contralateral and ipsilateral to the site of injury. (Young-GFP + TBI n = 10, Aged-GFP + TBI n = 13, Aged-VEGFC + TBI n = 16; pooled data from two independent experiments). All n values refer to the number of mice used and the error bars depict mean ± s.e.m. P values calculated by one-way ANOVA with Tukey’s multiple comparison correction (b, c, e, f, g, h). SSS superior sagittal sinus, TS transverse sinus. Source data (bc, eh) are provided as a Source data file.

Comment in

References

    1. The changing landscape of traumatic brain injury research. Lancet Neurol. 11, 651, 10.1016/S1474-4422(12)70166-7 (2012). - PubMed
    1. Mortimer JA, et al. Head trauma as a risk factor for Alzheimer’s disease: a collaborative re-analysis of case-control studies. EURODEM Risk Factors Research Group. Int J. Epidemiol. 1991;20(Suppl 2):S28–S35. - PubMed
    1. Chen H, Richard M, Sandler DP, Umbach DM, Kamel F. Head injury and amyotrophic lateral sclerosis. Am. J. Epidemiol. 2007;166:810–816. - PMC - PubMed
    1. Holsinger T, et al. Head injury in early adulthood and the lifetime risk of depression. Arch. Gen. Psychiatry. 2002;59:17–22. - PubMed
    1. Gardner RC, et al. Traumatic brain injury in later life increases risk for Parkinson disease. Ann. Neurol. 2015;77:987–995. - PMC - PubMed

Publication types

MeSH terms

Substances