. 2020 Sep 10;3(1):500.
doi: 10.1038/s42003-020-01235-2.

Floral transcriptomes reveal gene networks in pineapple floral growth and fruit development

Affiliations

Floral transcriptomes reveal gene networks in pineapple floral growth and fruit development

Lulu Wang et al. Commun Biol. .

Abstract

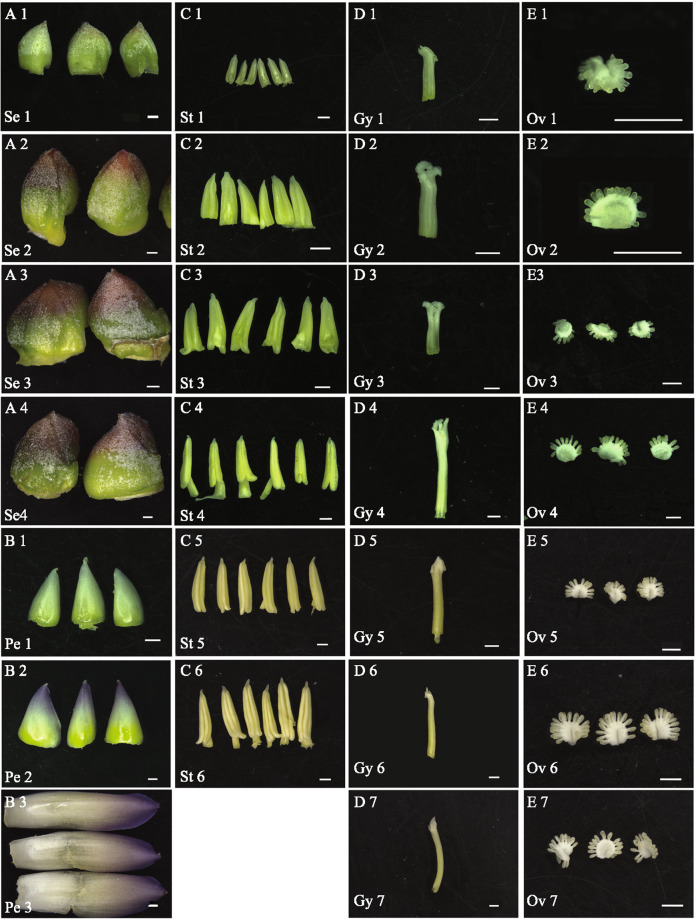
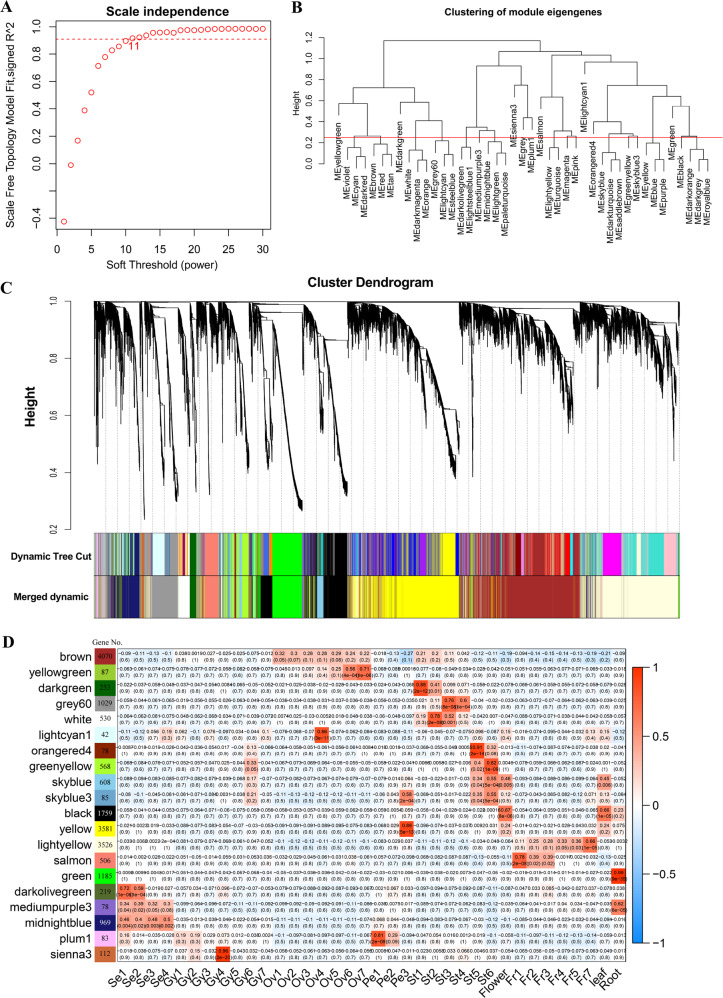
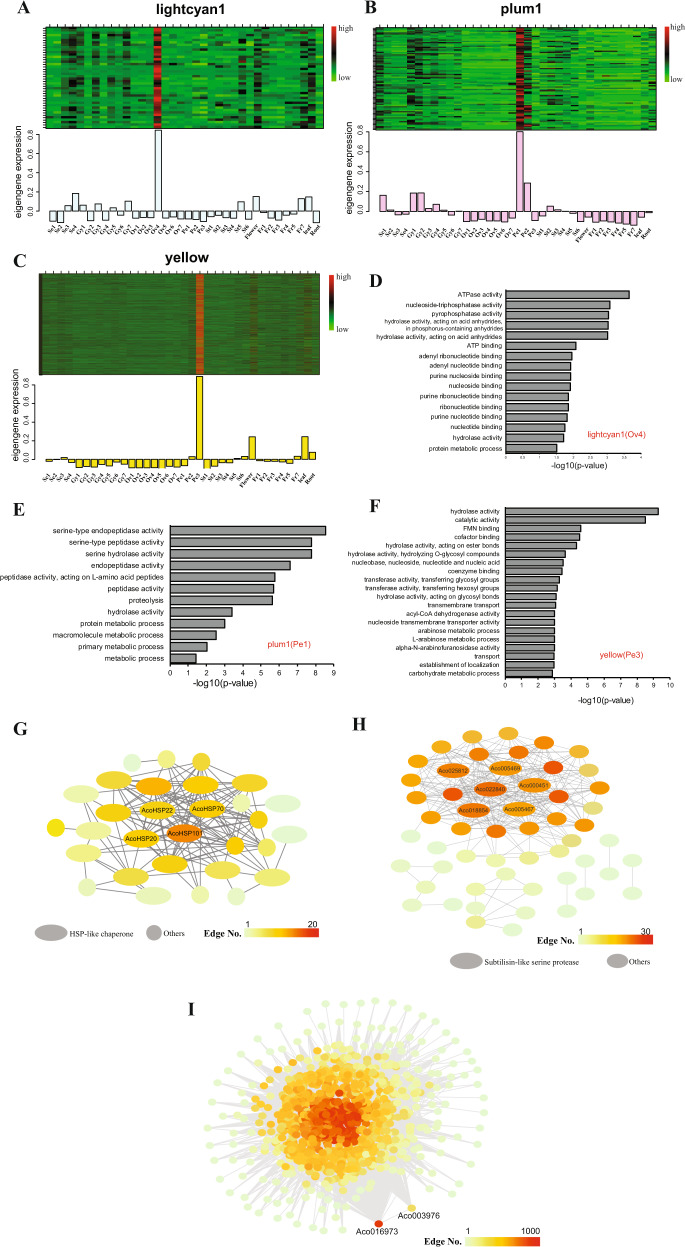
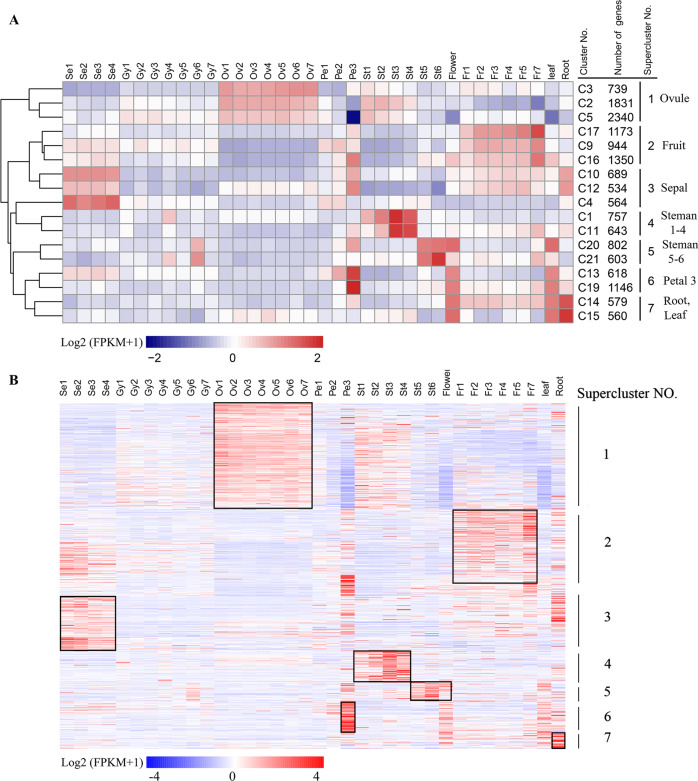
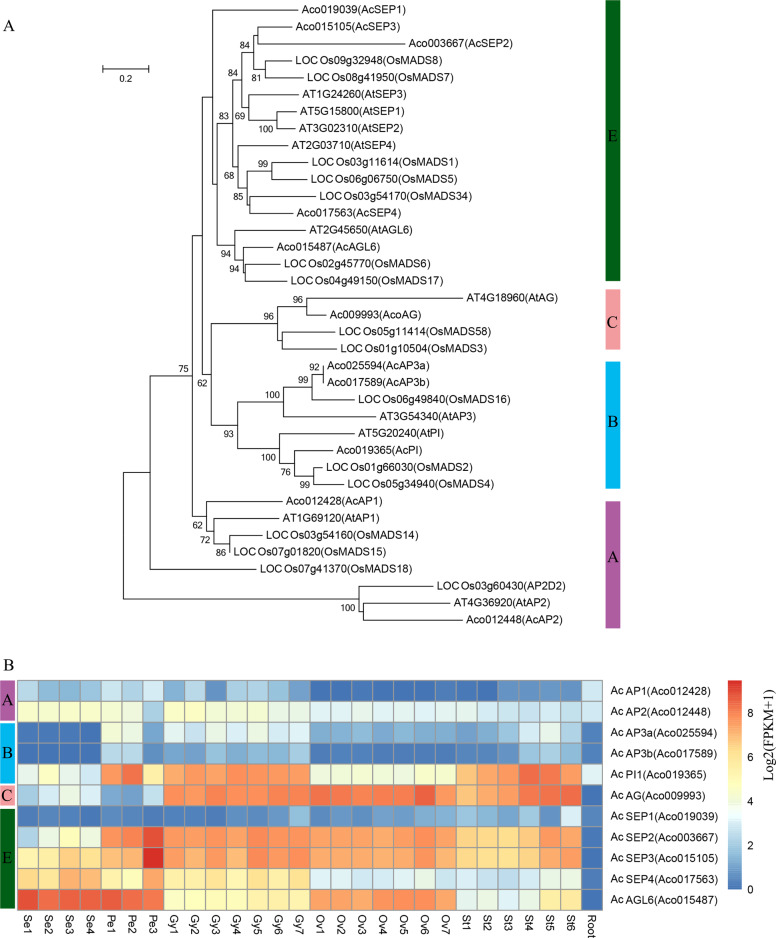
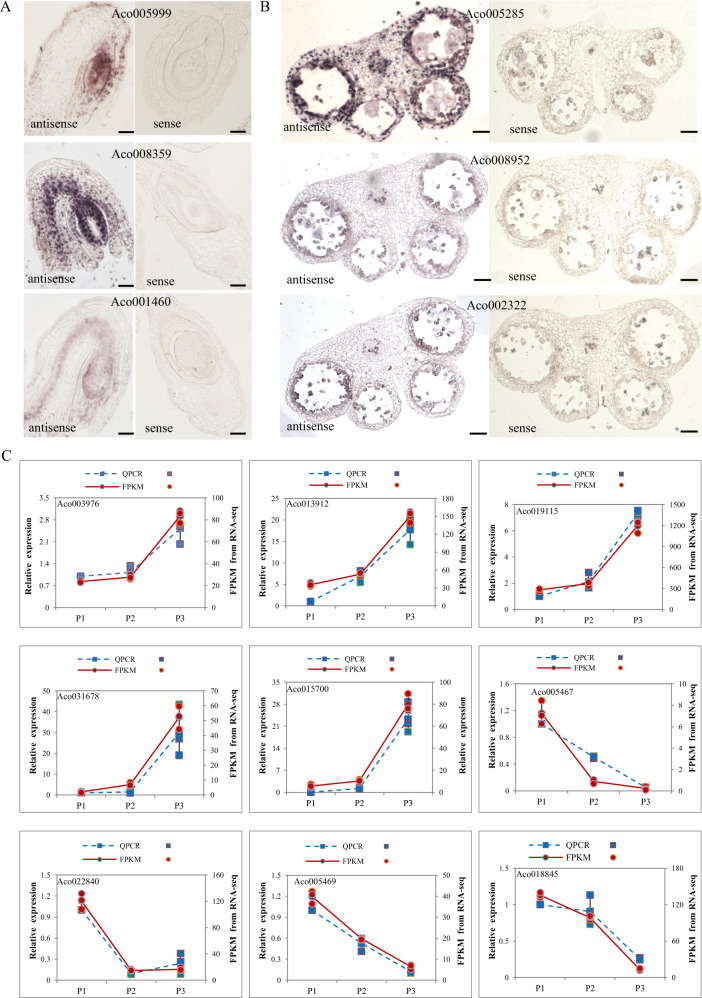
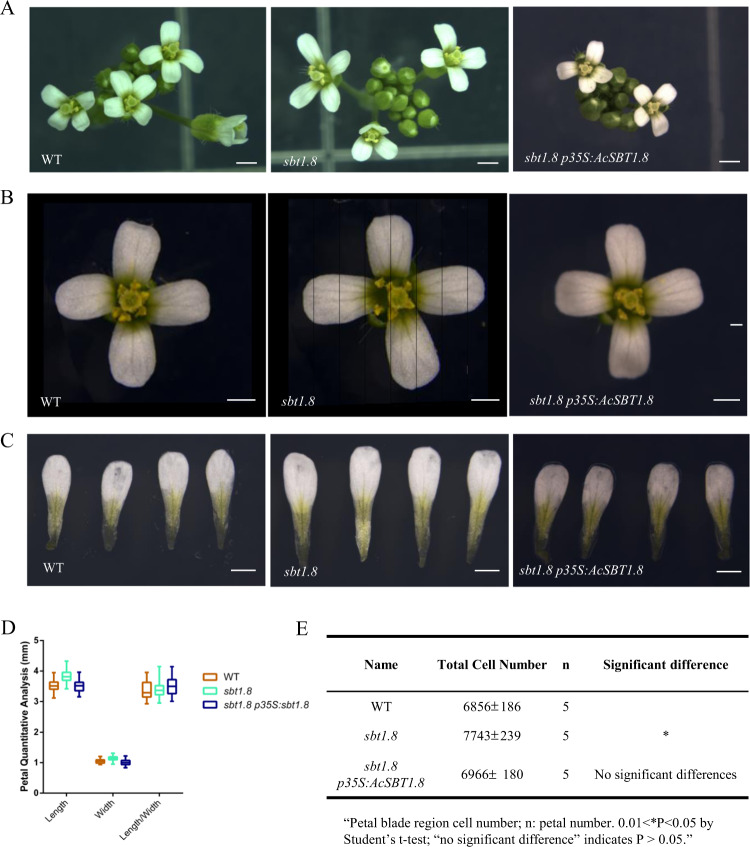
Proper flower development is essential for sexual reproductive success and the setting of fruits and seeds. The availability of a high quality genome sequence for pineapple makes it an excellent model for studying fruit and floral organ development. In this study, we sequenced 27 different pineapple floral samples and integrated nine published RNA-seq datasets to generate tissue- and stage-specific transcriptomic profiles. Pairwise comparisons and weighted gene co-expression network analysis successfully identified ovule-, stamen-, petal- and fruit-specific modules as well as hub genes involved in ovule, fruit and petal development. In situ hybridization confirmed the enriched expression of six genes in developing ovules and stamens. Mutant characterization and complementation analysis revealed the important role of the subtilase gene AcSBT1.8 in petal development. This work provides an important genomic resource for functional analysis of pineapple floral organ growth and fruit development and sheds light on molecular networks underlying pineapple reproductive organ growth.


Conflict of interest statement

Yuan Qin is an Editorial Board Member for Communications Biology, but was not involved in the editorial review of, nor the decision to publish this article. The remaining authors declare no competing interests.

Figures

Fig. 1
Fig. 1. Morphological characteristics of the pineapple floral tissues used for RNA-seq analysis.
a Sepal samples at 4 different stages. b Petal samples at three different stages. c Stamen samples at six different stages. d Gynoecium samples without ovules at seven different stages. e Ovule samples at seven different stages. Bar = 1 mm.
Fig. 2
Fig. 2. Weighted gene co-expression network analysis for pineapple RNA-seq data.
a Analysis of network topology for different soft‐thresholding powers. The graph displays the influence of soft‐thresholding power (x‐axis) on the scale‐free fit index (y‐axis). b Cluster dendrogram of module eigengenes. Branches of the dendrogram group together eigengenes that are positively correlated. The red line is the merging threshold, and groups of eigengenes below the threshold represent modules whose expression profiles should be merged due to their similarity. c Hierarchical cluster dendrogram showing co-expressed modules identified by weighted gene co-expression network analysis for the pineapple RNA-seq data. Each leaf on the tree represents one gene. The major tree branches constitute 20 merged modules (based on a threshold of 0.25), labeled with different colors. d Module-tissue association analysis. Each row corresponds to a module, with the number of genes in the module indicated on the left. Each column corresponds to a specific tissue. The correlation coefficient between a given module and tissue type is indicated by the color of the cell at the row-column intersection. Red and blue indicate positive and negative correlation, respectively.
Fig. 3
Fig. 3. Genes, enriched GO terms and networks of the Ovule 4-, Petal 1-, and Petal 3-specific modules.
a Eigengene expression profile for the Ovule 4 (lightcyan1) module in different samples. Top panel: expression heatmap showing the relative FPKM of all genes from the Ovule 4 (lightcyan1) module. Bottom panel: the x-axis indicates the samples, and the y-axis indicates the log2 “relative FPKM values” of the module eigengene. b Eigengene expression profile for the Petal 1 (plum1) module in different samples. c Eigengene expression profile for the Petal 3 (yellow) module in different samples. d Enriched GO terms for the Ovule 4 (lightcyan1) module. e Enriched GO terms for the Petal 1 (plum1) module. f Enriched GO terms for the Petal 3 (yellow) module. g The correlation network of the Ovule 4 (lightcyan1) module. Thirty genes with edge weights greater than 0.3 were included in the Cytoscape-generated diagram; oval shapes were used to indicate the 19 heat shock protein genes. h The correlation network of the Petal 1 (plum1) module. Fifty-four genes with edge weights greater than 0.3 were included in the Cytoscape-generated diagram; the ovals indicate the six subtilisin-like serine protease family genes. i The correlation network of the Petal 3 (yellow) module. The Cytoscape-generated diagram includes 1031 genes with edge weights greater than 0.4.
Fig. 4
Fig. 4. Seven superclusters of genes with unique tissue- or stage-specific expression profiles.
a Seventeen of the 21 K-means clusters included 15,872 genes with distinct stage- or tissue-specific expression patterns. The scale represents the Log2(FPKM + 1) values of all genes in a given cluster. Clusters with similar expression trends were combined to form seven superclusters. b Heatmap of the Log2(FPKM + 1) values of 918 individual transcription factor (TF) genes. The black boxes show the high expression TFs in each Supercluster.
Fig. 5
Fig. 5. Identification of pineapple floral homeotic genes and expression profiles.
a Phylogenetic tree of floral homeotic genes in Arabidopsis, rice and pineapple. The full length protein sequences were aligned by Clustal Omega and used for constructing the phylogenetic tree by neighbor-joining in MEGA5. Values above branches were bootstrap percentages (1000 replicates). b Expression pattern of A, B, C, and E class genes in pineapple flower and vegetative tissues. Log2(FPKM + 1) values were used for the heatmap.
Fig. 6
Fig. 6. In situ hybridization and RT-qPCR of Ovule 4-, Stamen 5-, and Petal-enriched genes.
a Longitudinal sections of pineapple stage 4 ovules with antisense and sense probes to detect Aco005999 (encoding chaperone protein ClpB), Aco008359 (encoding a MADS-box transcription factor), and Aco001460 (encoding a 70 kDa heat shock protein). Bars = 20 μm. b Cross-sections of pineapple stage 5 stamens with antisense and sense probes to detect Aco005285 (encoding a class I glutamine amidotransferase-like superfamily protein), Aco008952 (encoding an aquaporin-like superfamily protein), and Aco002322 (encoding a sequence-specific DNA binding transcription factor). Bars = 100 μm. c Validation of nine random selected petal specific subtilase genes by RT-qPCR. The left y-axis represents for the relative expression of RT-qPCR result and right y axis stands for the FPKM value from RNA-seq result. Blue dash line represents for RT-qPCR and red solid line represents for RNA-seq result. The letter P1–P3 means petal tissues at different stages.
Fig. 7
Fig. 7. Petal phenotype analysis of the sbt1.8 mutant and the complementation lines.
ac Inflorescence, flower and petal phenotypes of wild type (WT), sbt1.8 and the sbt1.8 p35S:AcSBT1.8 complementation lines at floral development stage 14. Bar = 1 mm. d Quantitative analysis of petal size in WT, sbt1.8 and the complementation line. Values are given as the mean ± SD of 34 petals (n = 34) from independent plants (**P < 0.05 by Student’s t test). e Cell number in the petal blade region. Values are given as the mean ± SD of 5 (n = 5) petals from independent plants (0.01 < *P < 0.05 by Student’s t test; “no significant difference” indicates P > 0.05).

References

    1. Sharma AK, Ghosh I. Cytotaxonomy of the family Bromeliaceae. Cytologia. 1971;36:237–247.
    1. Fang J, Miao C, Chen R, Ming R. Genome-wide comparative analysis of microsatellites in pineapple. Trop. Plant Biol. 2016;9:117–135.
    1. Paull RE, et al. Carbon flux and carbohydrate gene families in pineapple. Trop. Plant Biol. 2016;9:200–213.
    1. Wai CM, Powell B, Ming R, Min XJ. Analysis of alternative splicing landscape in pineapple (Ananas comosus) Trop. Plant Biol. 2016;9:150–160.
    1. Cheng, Y., Bartholomew, D. & Qin, Y. in Genetics and Genomics of Pineapple (ed Ray Ming) 27–40 (Springer International Publishing, 2018).

Publication types