. 2021 Apr;31(4):415-432.
doi: 10.1038/s41422-020-00412-6. Epub 2020 Sep 10.

Single-cell transcriptomic atlas of primate cardiopulmonary aging

Affiliations

Single-cell transcriptomic atlas of primate cardiopulmonary aging

Shuai Ma et al. Cell Res. 2021 Apr.

Abstract

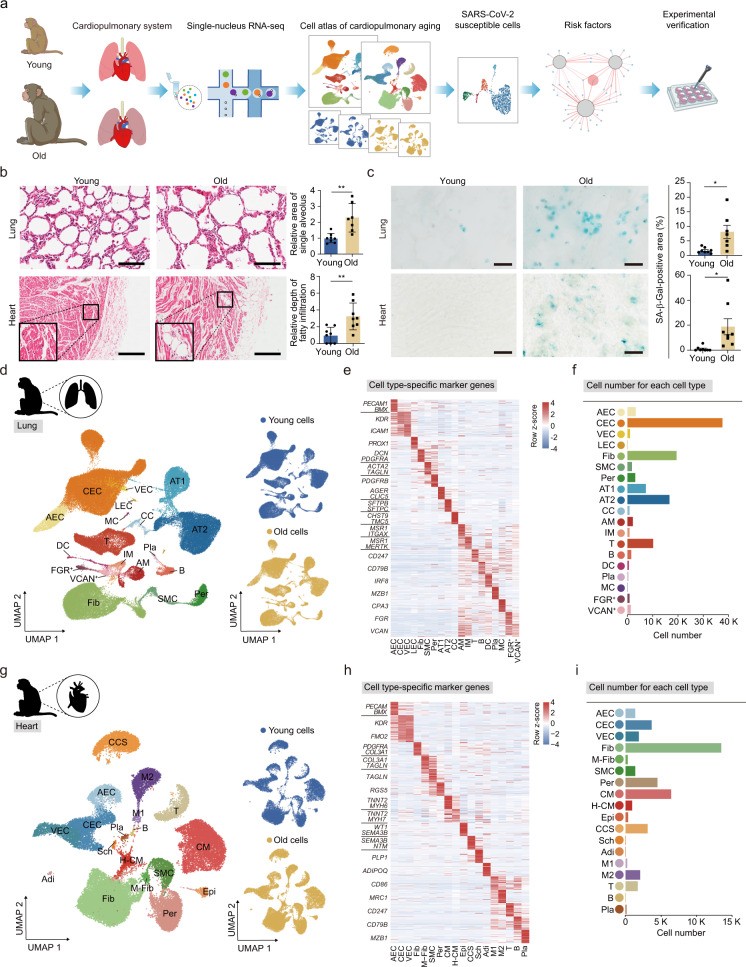
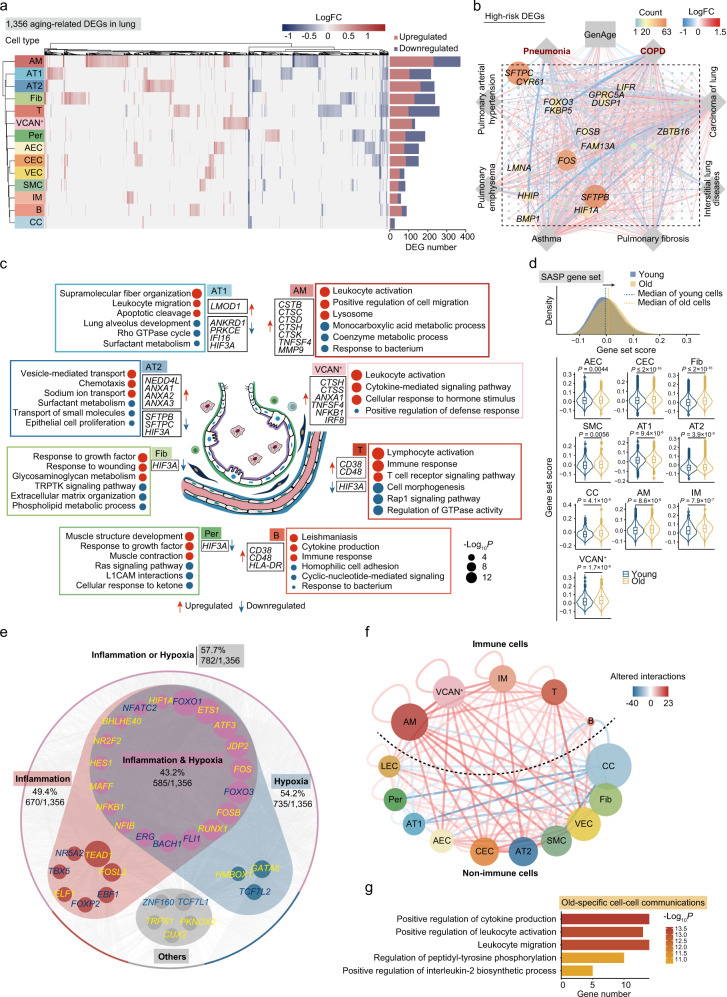
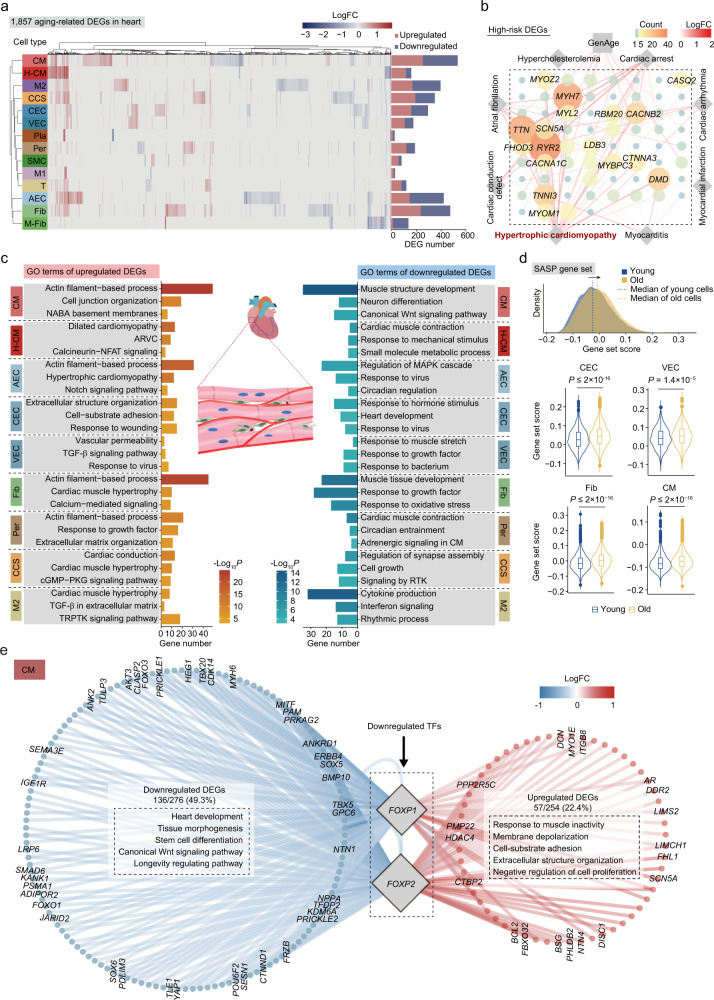
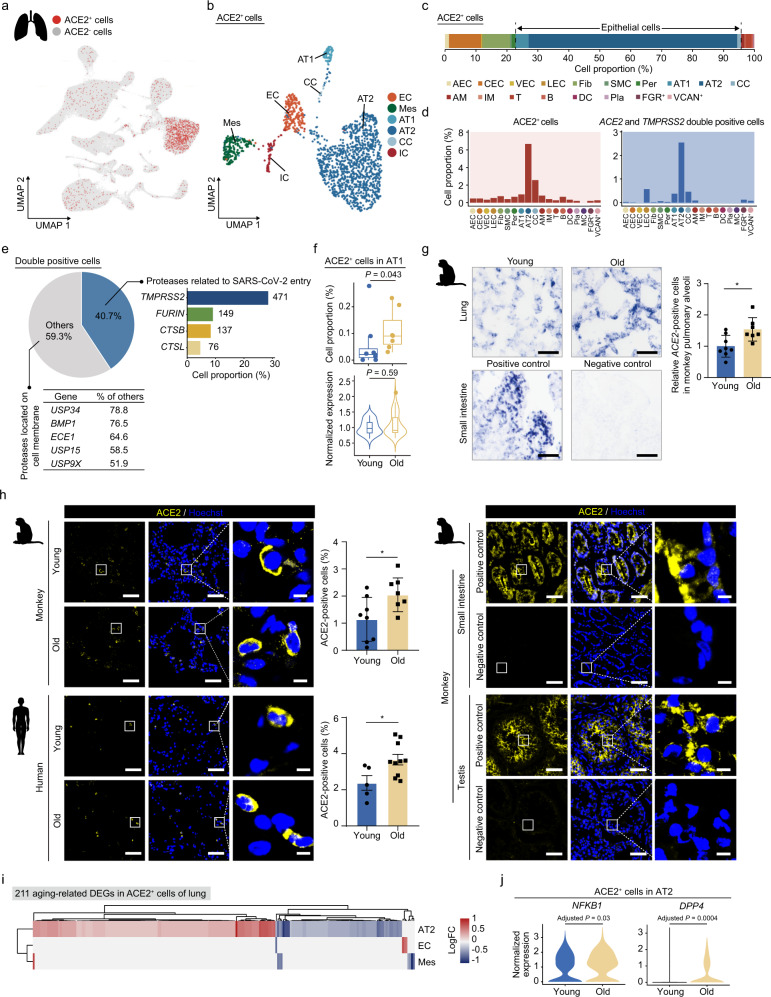
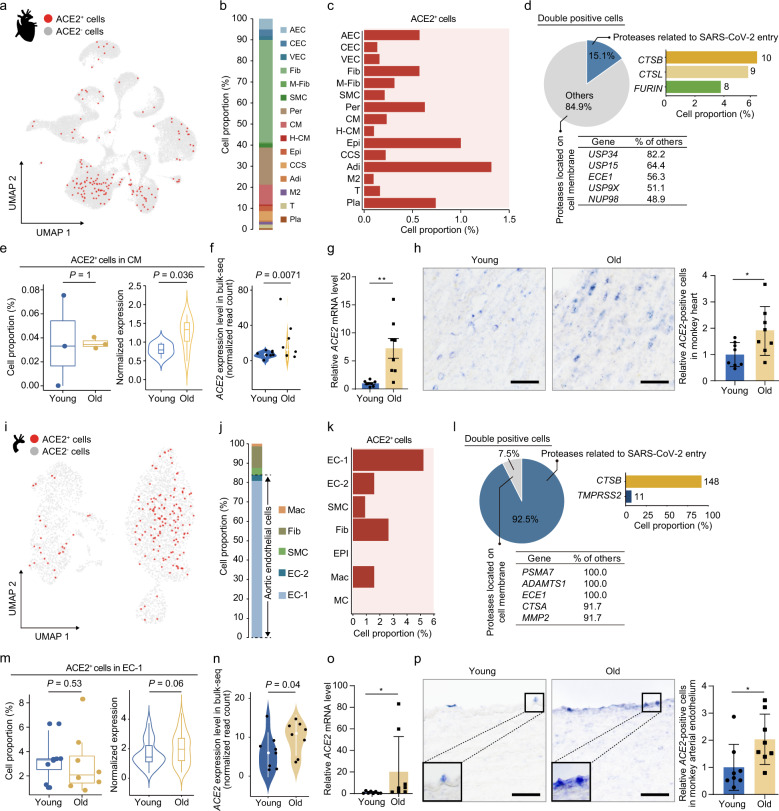
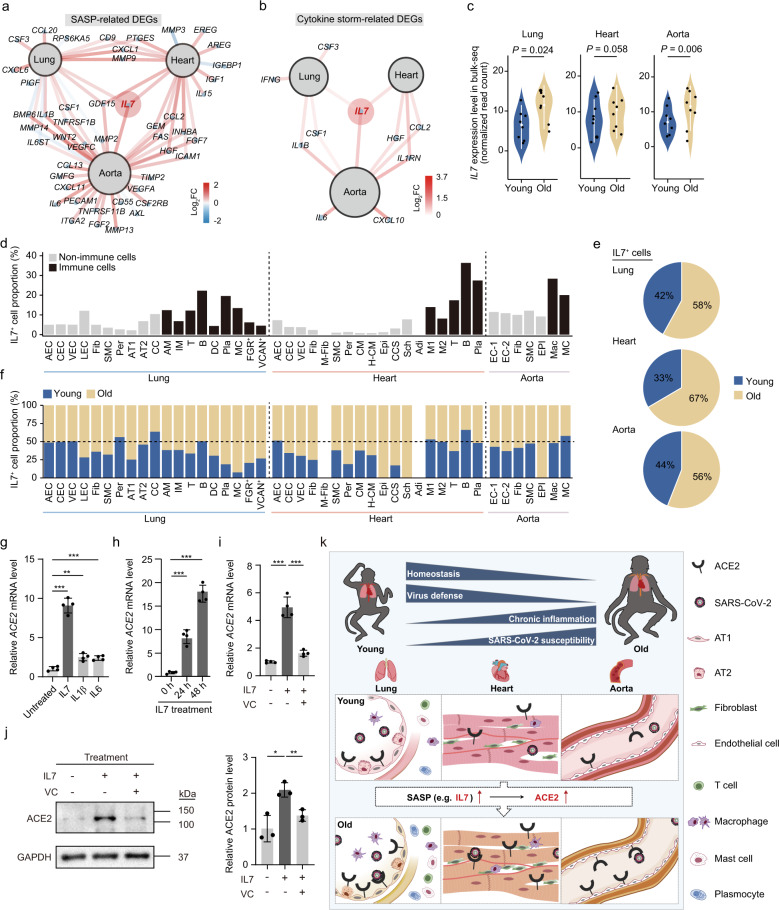
Aging is a major risk factor for many diseases, especially in highly prevalent cardiopulmonary comorbidities and infectious diseases including Coronavirus Disease 2019 (COVID-19). Resolving cellular and molecular mechanisms associated with aging in higher mammals is therefore urgently needed. Here, we created young and old non-human primate single-nucleus/cell transcriptomic atlases of lung, heart and artery, the top tissues targeted by SARS-CoV-2. Analysis of cell type-specific aging-associated transcriptional changes revealed increased systemic inflammation and compromised virus defense as a hallmark of cardiopulmonary aging. With age, expression of the SARS-CoV-2 receptor angiotensin-converting enzyme 2 (ACE2) was increased in the pulmonary alveolar epithelial barrier, cardiomyocytes, and vascular endothelial cells. We found that interleukin 7 (IL7) accumulated in aged cardiopulmonary tissues and induced ACE2 expression in human vascular endothelial cells in an NF-κB-dependent manner. Furthermore, treatment with vitamin C blocked IL7-induced ACE2 expression. Altogether, our findings depict the first transcriptomic atlas of the aged primate cardiopulmonary system and provide vital insights into age-linked susceptibility to SARS-CoV-2, suggesting that geroprotective strategies may reduce COVID-19 severity in the elderly.


Conflict of interest statement

The authors declare no competing interests.

Figures

Fig. 1
Fig. 1. Generation of cynomolgus monkey single-nucleus RNA-seq lung and heart cell atlases.
a Study flowchart. b Hematoxylin and eosin (H&E)-stained sections of lung and heart tissues from young and old monkeys. Representative images are shown on the left; quantitative data for the relative area of the single alveolus (lung) and relative depth of fatty infiltration (heart) are shown as means ± SEM on the right. Scale bar, 100 μm (lung) and 200 μm (heart). Young, n = 8; old, n = 7 monkeys (lung). Young, n = 8; old, n = 8 monkeys (heart). **P < 0.01. c SA-β-Gal staining of lung and heart tissues. Representative images are shown on the left; quantitative data for each tissue are shown as means ± SEM on the right. Young, n = 8; old, n = 7 monkeys (lung). Young, n = 8; old, n = 8 monkeys (heart). Scale bar, 50 μm. *P < 0.05. d UMAP plots showing different cell types (left) and young and old cell distribution (right) in monkey lung. AEC, arterial endothelial cell; CEC, capillary endothelial cell; VEC, venous endothelial cell; LEC, lymphatic endothelial cell; Fib, fibroblast; SMC, smooth muscle cell; Per, pericyte; AT1, alveolar type I cell; AT2, alveolar type II cell; CC, ciliated cell; AM, alveolar macrophage; IM, interstitial macrophage; T, T cell; B, B cell; DC, dendritic cell; Pla, plasmocyte; MC, mast cell; FGR+FGR-positive cell; VCAN+VCAN-positive cell. e Heatmap showing the gene expression signatures of the top 30 marker genes corresponding to each cell type in monkey lung. Each column represents one cell type, and each row indicates the expression of one gene. Marker genes for each cell type are shown on the left of the heatmap. f Bar plot showing the cell numbers of different cell types in monkey lung. g UMAP plots showing different cell types (left) and young and old cell distribution (right) in monkey heart. M-Fib, myofibroblast; CM, cardiomyocyte; H-CM, hypertrophic cardiomyocyte; Epi, epicardial cell; CCS, cardiac conduction system cell; Sch, Schwann cell; Adi, adipose cell; M1, pro-inflammatory macrophage; M2, anti-inflammatory macrophage. h Heatmap showing the gene expression signatures of each cell type in monkey heart. Each column represents one cell type, and each row indicates the expression of one gene. Marker genes for each cell type are shown on the left of the heatmap. i Bar plot showing the cell numbers of different cell types in monkey heart.
Fig. 2
Fig. 2. Age-related transcriptional alterations in various cell types of monkey lung.
a Left, heatmap showing the DEGs (|logFC| > 0.25, adjusted P value < 0.05) during aging across different cell types in monkey lung. Right, bar plot showing the numbers of DEGs across different cell types in monkey lung. b Network plot showing the DEGs overlapped with GenAge database (https://genomics.senescence.info/genes/) and lung disease database (https://www.malacards.org/, https://www.disgenet.org/home/). The node size (count) indicates the number of cell types across databases in which the genes were differentially expressed with age. The color of connecting lines corresponds to the logFC. Genes with count > 20 are shown. c Diagram showing the enrichment of GO terms (Biological Process) or pathways in four parenchymal cell types (AT1, AT2, Fib, Per) and four immune cell types (AM, VCAN+, T, B) with the highest numbers of DEGs (|logFC| > 0.25, adjusted P value < 0.05). The dot size is positively correlated with the –log10 P-value. Representative DEGs are also shown beside the terms. Red, upregulation; Blue, downregulation. d Top, ridge plot showing the shift of SASP gene set score with age in all cells from monkey lung. Bottom, violin plots showing the cell types in which the SASP gene set score is significantly increased with age in monkey lung. e Network plot showing the upregulated and downregulated TFs during aging (|logFC| > 0.25, adjusted P value < 0.05) associated with inflammation, hypoxia, or other biological processes. Upregulated TFs are highlighted in yellow, and downregulated TFs are highlighted in blue. The TFs are separated into 4 groups: “inflammation” (circled by red background), “hypoxia” (circled by blue background), “inflammation & hypoxia” (circled by both red and blue background) and “others” (circled by gray background). The outer nodes represent the target genes of TFs from the group of “inflammation” (red and purple), “hypoxia” (blue and purple), “inflammation & hypoxia” (purple) or “others” (gray). The percentages represent the ratios of target DEGs to total DEGs. f Network plot showing the cell–cell communications between immune cells and non-immune cells in monkey lung. The color of connecting lines indicates the number of altered interaction pairs. Red, increased interactions; blue, decreased interactions. g Bar plot showing the enrichment of GO terms or pathways of old-specific cell–cell communications.
Fig. 3
Fig. 3. Age-related transcriptional alterations in various cell types of monkey heart.
a Left, heatmap showing the DEGs during aging across different cell types in monkey heart. Right, bar plot showing the numbers of DEGs across different cell types in monkey heart (|logFC| > 0.25, adjusted P value < 0.05). b Network plot showing the upregulated DEGs associated with GenAge database (https://genomics.senescence.info/genes/) and heart diseases database (https://www.malacards.org/, https://www.disgenet.org/home/). The node size (count) of genes indicates the number of cell types across databases in which this gene was differentially expressed with age. The color of connecting lines indicates the logFC. Genes with count > 5 are shown. c Diagram showing the enrichment of GO terms (Biological Process) or pathways of nine cell types with the highest numbers of DEGs (|logFC| > 0.25, adjusted P value  < 0.05) in monkey heart. ARVC, arrhythmogenic right ventricular cardiomyopathy; TRPTK, transmembrane receptor protein tyrosine kinase; CM, cardiomyocyte; RTK, receptor tyrosine kinase. d Top, ridge plot showing the shift of SASP gene set score with age in all cells from monkey heart. Bottom, violin plots showing the cell types in which the SASP gene set score is significantly increased with age in monkey heart. e Network plot showing the differentially expressed FOXP1 and FOXP2 target genes (|logFC| > 0.25, adjusted P value < 0.05) in CMs. The enriched GO terms (Biological Process) for upregulated or downregulated target genes are shown in the rectangular boxes with dash lines.
Fig. 4
Fig. 4. Changes in putative SARS-CoV-2 target cell types during monkey lung aging.
a UMAP plot showing the ACE2+ cells in monkey lung. b UMAP plot showing the different ACE2+ cell types in monkey lung. EC, endothelial cell; Mes, mesenchymal cells (ciliated cells, fibroblasts, pericytes); CC, ciliated cell; IC, immune cell. c Bar plot showing the proportions of different ACE2+ cell types in monkey lung. The epithelial cells (AT1, AT2 and CC) are highlighted by dash lines. d Bar plots showing the proportions of ACE2+ cells (left) and ACE2 and TMPRSS2 double-positive cells (right) across different cell types in monkey lung. The asterisk denotes the cell type with the highest percentage of ACE2+ and ACE2 and TMPRSS2 double-positive cells, respectively. e Top left, pie plot showing the percentages of cells expressing genes associated with SARS-CoV-2 entry in ACE2+ cells of monkey lung. Top right, bar plot showing the percentages and numbers of cells expressing the indicated genes related to SARS-CoV-2 entry. Bottom, a table showing the percentages and numbers of cells expressing other membrane-bound proteases in ACE2+ cells. Only the five genes with the highest relative expression proportion are shown. f Box plots showing the proportion of ACE2+ cells and violin plot showing ACE2 expression level in young and old AT1 cells. g Top, transverse sections of lung tissues from young and old monkeys were subjected to ISH with ACE2 riboprobes. Representative ISH images are shown on the left; quantitative data are shown as means ± SEM on the right. Young, n = 8; old, n = 7 monkeys. *P < 0.05. Scale bar, 25 μm. Monkey small intestine section with ACE2 riboprobes was used as positive control, and small intestine sections with ACE2 reverse complementary riboprobes were used as negative control. The blue-purple signals were considered as ACE2-positive cells. h Immunofluorescence staining of ACE2 in young and old lung tissues from monkeys and humans, respectively. Quantitative data are shown as means ± SEM. Immunofluorescence staining of IgG and ACE2 in monkey small intestine and testis sections were used as negative and positive controls, respectively. Monkey, young, n = 8; old, n = 7 individuals. Human, young, n = 5; old, n = 10 individuals. Scale bars, 50 μm and 5 μm (zoomed-in image). *P < 0.05. i Heatmap showing DEGs across different cell types in ACE2+ cells of monkey lung. j Violin plots showing the expression levels of NFKB1 and DPP4 in ACE2+ AT2 across young and old groups.
Fig. 5
Fig. 5. Age-related transcriptional alterations in SARS-CoV-2 target cell types in the cardiovascular system.
a UMAP plot showing the ACE2+ cells in monkey heart. b Bar plot showing the proportions of ACE2+ cell types in monkey heart. c Bar plot showing percentages of ACE2+ cells across different cell types in the monkey heart. d Top left, pie plot showing the percentages of cells expressing genes associated with SARS-CoV-2 entry in ACE2+ cells of monkey heart. Top right, bar plot showing percentages and numbers of cells expressing the indicated genes related to SARS-CoV-2 entry. Bottom, the table showing the percentages and numbers of cells expressing other membrane-bound proteases in ACE2+ cells. Only the five genes with the highest relative expression proportion are shown. e Box plot showing the proportion of ACE2+ cells and violin plot showing ACE2 expression level in young and old CMs. f Violin plot showing the ACE2 expression levels in bulk RNA-seq analysis of monkey heart. g Transcript levels of ACE2 in young and old monkey hearts quantified by RT-qPCR. Young, n = 8; old, n = 8 monkeys. The data are shown as means ± SEM. **P < 0.01. h Transverse sections of heart tissues from young and old monkeys were subjected to ISH with ACE2 riboprobes. Representative ISH images are shown on the left; quantitative data are shown as means ± SEM on the right. Young, n = 8; old, n = 8 monkeys. *P < 0.05. Scale bar, 25 μm. The blue-purple signals were considered as ACE2-positive cells. i UMAP plot showing the ACE2+ cells in monkey aorta. j Bar plot showing the proportions of ACE2+ cell types in monkey aorta. k Bar plot showing the percentages of ACE2+ cells across different cell types in monkey aorta. l Top left, pie plot showing the percentages of cells expressing genes associated with SARS-CoV-2 entry in ACE2+ cells of monkey aorta. Top right, bar plot showing the percentages and numbers of cells expressing the indicated genes related to SARS-CoV-2 entry. Bottom, a table showing the percentages and numbers of cells expressing other membrane-bound proteases in ACE2+ cells. Only the five genes with the highest relative expression proportion are shown. m Box plot showing the proportion of ACE2+ cells in EC-1 and violin plot showing the ACE2 expression levels in ACE2+ cells. n Violin plot showing the ACE2 expression levels in bulk RNA-seq analysis of monkey aorta between young and old groups. o Transcript levels of ACE2 in young and old monkey aorta quantified by RT-qPCR. Young, n = 8; old, n = 8 monkeys. The data are shown as means ± SEM. *P < 0.05. p Transverse sections of aorta tissues from young and old monkeys subjected to ISH with ACE2 riboprobes. Representative ISH images are shown on the left; quantitative data are shown as means ± SEM on the right. Young, n = 8; old, n = 8 monkeys. *P < 0.05. Scale bar, 25 μm. Zoom-in views of the region highlighted by dashed lines are shown in the left corner. The blue-purple signals were considered as ACE2-positive cells.
Fig. 6
Fig. 6. IL7 treatment stimulates ACE2 expression in human endothelial cells.
a Network plot showing the DEGs related to SASP based on the bulk RNA-seq analysis of monkey lung, heart, and aorta. The color of connecting lines indicates the log2FC. Genes with P < 0.06 are shown. b Network plot showing the DEGs related to cytokine storm based on the bulk RNA-seq analysis of monkey lung, heart, and aorta. The color of connecting lines indicates the log2FC. Genes with P < 0.06 are shown. c Violin plots showing the transcript levels of IL7 in monkey lung, heart, and aorta from bulk RNA-seq analysis. d Bar plots showing the proportions of IL7+ cells across different cell types in monkey lung, heart, and aorta. e Pie plots showing the total IL7+ cell proportions between young and old groups in monkey lung, heart, and aorta. f Bar plots showing the IL7+ cell proportions between young and old groups across different cell types in monkey lung, heart, and aorta. g RT-qPCR showing the upregulation of ACE2 expression after a 6-h treatment with IL7 (10 ng/mL), IL1β (10 ng/mL) and IL6 (25 ng/mL) in HAECs (passage 1). The data are shown as means ± SEM, n = 4 experimental repeats, and the experiment was independently repeated three times with similar results. **P < 0.01, ***P < 0.001. h RT-qPCR showing the upregulation of ACE2 expression after treatment with IL7 (10 ng/mL) at different time points in HAECs (passage 2). The data are shown as means ± SEM, n = 4 experimental repeats, and the experiment was independently repeated three times with similar results. ***P < 0.001. i RT-qPCR detection of ACE2 expression in HAECs (passage 4) after treatment with IL7 in the presence or absence of vitamin C. Quantitative data are shown as means ± SEM. n = 4. ***P < 0.001. j Western blot analysis of ACE2 expression in HAECs after treatment with IL7 (10 ng/mL) and vitamin C (280 μM). GAPDH was used as a loading control. Quantitative data are shown as means ± SEM. n = 3 experimental repeats. *P < 0.05; **P < 0.01. k Schematic illustration of the functional decay and increased susceptibility to SARS-CoV-2 with age revealed by a transcriptomic atlas of aged primate cardiopulmonary system. SASP secretion increases (such as IL7) with age, thus promoting an inflammatory environment and inducing ACE2 expression, which may result in increased susceptibility to SARS-CoV-2.

Comment in

  • SARS-CoV-2 leads to myocardial injury in rhesus macaque.
    Feng Y, Song X, Huang Y, Deng W, Li M, Guo X, Qin C, Tong WM, Liu J, Wang J. Feng Y, et al. Signal Transduct Target Ther. 2021 Sep 6;6(1):338. doi: 10.1038/s41392-021-00747-5. Signal Transduct Target Ther. 2021. PMID: 34489396 Free PMC article. No abstract available.

Similar articles

Cited by

References

    1. Kirkland JL. Translating the science of aging into therapeutic interventions. Cold Spring Harb. Perspect. Med. 2016;6:a025908. doi: 10.1101/cshperspect.a025908. - DOI - PMC - PubMed
    1. Zhang J, et al. Changes in contact patterns shape the dynamics of the COVID-19 outbreak in China. Science. 2020;368:1481–1486. doi: 10.1126/science.abb8001. - DOI - PMC - PubMed
    1. Cho SJ, Stout-Delgado HW. Aging and lung disease. Annu. Rev. Physiol. 2020;82:433–459. doi: 10.1146/annurev-physiol-021119-034610. - DOI - PMC - PubMed
    1. Gude NA, Broughton KM, Firouzi F, Sussman MA. Cardiac ageing: extrinsic and intrinsic factors in cellular renewal and senescence. Nat. Rev. Cardiol. 2018;15:523–542. doi: 10.1038/s41569-018-0061-5. - DOI - PubMed
    1. Bian, X.-W. & Team tC-P. Autopsy of COVID-19 victims in China. Natl. Sci. Rev. (2020). - PMC - PubMed

MeSH terms