

Quantification of uric acid in vasculature of patients with gout using dual-energy computed tomography
- PMID: 32913564
- PMCID: PMC7457162
- DOI: 10.4329/wjr.v12.i8.184
Quantification of uric acid in vasculature of patients with gout using dual-energy computed tomography
Abstract
Background: Gout, caused by hyperuricemia and subsequent deposition of aggregated monosodium urate crystals (MSU) in the joints or extra-articular regions, is the most common inflammatory arthritis. There is increasing evidence that gout is an independent risk factor for hypertension, cardiovascular disease progression and mortality.
Aim: To evaluate if dual energy computed tomography (DECT) could identify MSU within vessel walls of gout patients, and if MSU deposits within the vasculature differed between patients with gout and controls. This study may help elucidate why individuals with gout have increased risk for cardiovascular disease.
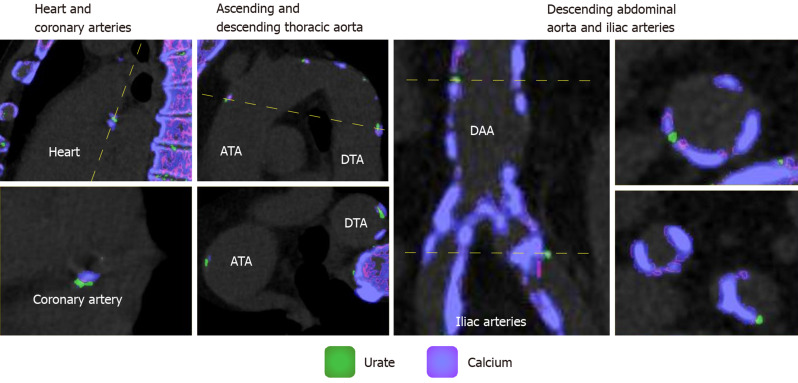
Methods: 31 gout patients and 18 controls underwent DECT scans of the chest and abdomen. A material decomposition algorithm was used to distinguish regions of MSU (coded green), and calcifications (coded purple) from soft tissue (uncoded). Volume of green regions was calculated using a semi-automated volume assessment program. Between-group differences were analyzed using Mann-Whitney U exact test and nonparametric rank regression.
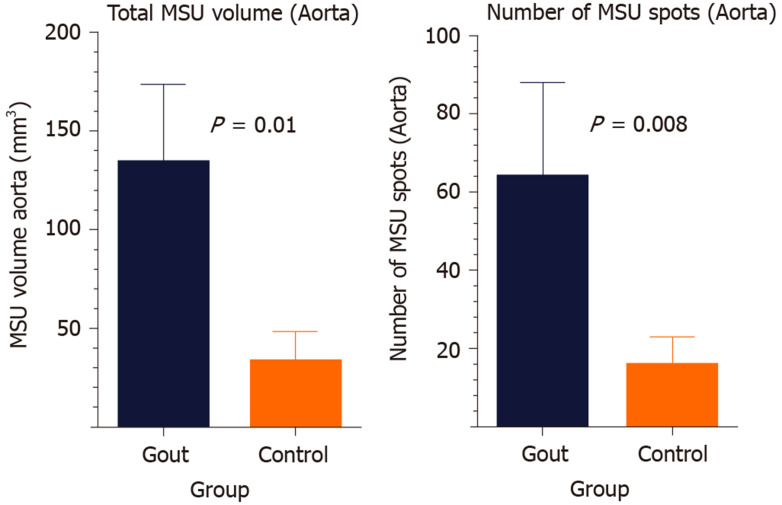
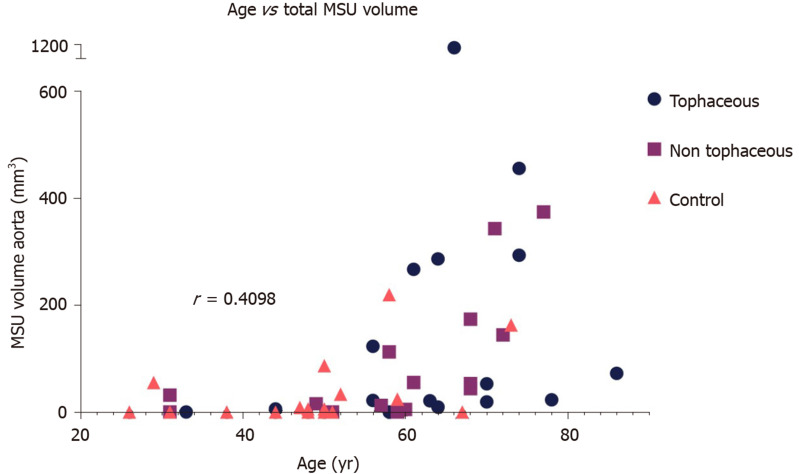
Results: Gout patients had significantly higher volume of MSU within the aorta compared to controls [Median (Min-Max) of 43.9 (0-1113.5) vs 2.9 (0-219.4), P = 0.01]. Number of deposits was higher in gout patients compared to controls [Median (Min-Max) of 20 (0-739) vs 1.5 (0-104), P = 0.008]. However, the difference was insignificant after adjustment for age, gender, history of cardiovascular disease and diabetes. Increased age was positively associated with total urate volume (r s = 0.64; 95% confidence interval: 0.43-0.78).
Conclusion: This pilot study showed that DECT can quantify vascular urate deposits with variation across groups, with gout patients possibly having higher deposition. This relationship disappeared when adjusted for age, and there was a positive relationship between age and MSU deposition. While this study does not prove that green coded regions are truly MSU deposition, it corroborates recent studies that show the presence of vascular deposition.
Keywords: Cardiovascular disease; Dual-energy computed tomography; Gout; Hyperuricemia; Monosodium urate; Tophaceous.
©The Author(s) 2020. Published by Baishideng Publishing Group Inc. All rights reserved.
Conflict of interest statement
Conflict-of-interest statement: None of the authors have any conflicts of interest with regards to the study.
Figures
References
-
- Ankli B. [Current epidemiology of gout] Ther Umsch. 2016;73:125–129. - PubMed
-
- Yu Z, Mao T, Xu Y, Li T, Wang Y, Gao F, Sun W. Diagnostic accuracy of dual-energy CT in gout: a systematic review and meta-analysis. Skeletal Radiol. 2018;47:1587–1593. - PubMed
-
- Abeles AM. Hyperuricemia, gout, and cardiovascular disease: an update. Curr Rheumatol Rep. 2015;17:13. - PubMed
-
- Zhu Y, Pandya BJ, Choi HK. Prevalence of gout and hyperuricemia in the US general population: the National Health and Nutrition Examination Survey 2007-2008. Arthritis Rheum. 2011;63:3136–3141. - PubMed
-
- Kuo CF, Grainge MJ, Zhang W, Doherty M. Global epidemiology of gout: prevalence, incidence and risk factors. Nat Rev Rheumatol. 2015;11:649–662. - PubMed
LinkOut - more resources
Full Text Sources
