. 2020 Aug 27:8:e9833.
doi: 10.7717/peerj.9833. eCollection 2020.

In situ SEM/EDS compositional characterization of osteocytes and blood vessels in fossil and extant turtles on untreated bone surfaces; different preservational pathways microns away

Affiliations

In situ SEM/EDS compositional characterization of osteocytes and blood vessels in fossil and extant turtles on untreated bone surfaces; different preservational pathways microns away

Edwin-Alberto Cadena. PeerJ. .

Abstract

Osteocytes and blood vessels are the main cellular and tissue components of the bone tissue of vertebrates. Evidence of these soft-tissue microstructures has been widely documented in the fossil record of Mesozoic and Cenozoic turtles. However, all these studies have characterized morphologically and elementally these microstructures via isolation from the fossilized bone matrix where they were preserved or in ground sections, which could raise skepticism about the results due to potential cross-contamination or reagents effects. Fossil turtle bones from three different localities with distinct preservation environments and geological settings, including Mongolemys elegans from the Late Cretaceous of Mongolia, Allaeochelys crassesculpta from the Eocene of Germany, and a podocnemidid indet. from the Miocene of Colombia are studied here. Bone from two extant turtle species, Lepidochelys olivacea, and Podocnemis lewyana, as well as a commercial chicken Gallus gallus were used for comparisons. Scanning Electron Microscopy-Energy Dispersive Spectroscopy analyses performed directly on untreated fresh surfaces show that osteocytes-like in the fossil turtle bone are mostly composed of iron and manganese. In contrast, the in situ blood vessels-like of the fossil turtles, as well as those from the extant taxa are rich in elements typically organic in origin (carbon and nitrogen), which are absent to minimally present in the surrounding bone or rock matrix; this suggests a possible endogenous composition for these fossil structures. Also, the results presented here show that although originally both (osteocytes and blood vessels) are organic soft components of bone as evidenced in the extant turtles and chicken, they can experience completely different preservational pathways only microns away from each other in the same fossil bone.

Keywords: Colombia; Deep time; Exceptional preservation; Germany; Osteoblasts; Fossil cells; Mongolia; Testudines.


Conflict of interest statement

The author declares that he has no competing interests.

Figures
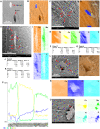
Figure 1
Figure 1. SEM/EDS analyses of Mongolemys elegans (IGM-90/42) bone.
(A) Micrograph of one of the osteocytes-like and an empty lacuna nearby. (B) EDS of the bone region shown in (A), in which orange indicates bone matrix (calcium), and blue-yellow denotes the osteocyte-like (oxygen and iron respectively). (C) Micrograph of one osteocyte-like, indicating the regions where EDS mapping and point analyses were performed. (D–E) Composite elemental map (D) and individual element maps (E) for the rectangle labeled as 1 in (C), in which osteocytes-like show high amount of iron and nitrogen. (F) Elemental point values of point 7 (bone matrix) shown in (C). (G) Elemental intensities for point 4 (osteocyte-like) shown in (C). (H) Micrograph of a broken osteocyte-like inside its lacuna. (I) Individual elements maps from rectangle 1 shown in (H), with the broken osteocyte-like showing a high content of manganese. (J) Elemental intensities for point 2 (bone matrix) shown in (H). (K) Elemental intensities for point 6 (osteocyte-like) shown in (H). (L) Micrograph of a empty lacuna. (M–N) Composite elemental map and individual elements maps for the rectangle labeled as 1 in (L), in which the wall surface of the lacuna exhibits the same composition as the bone matrix. (O) An isolated, broken, and folded osteocyte-like showing a high amount of iron at its external surface and manganese in its internal region, the red line denotes the cross-line described in (P). (P) Cross-line elemental profile across the broken and folded osteocyte-like shown in (O), revealing a switch between iron and manganese content between its external and internal surfaces. Full EDS results for the points shown in (C, H, and L) are presented in Fig. 2 and Data S2.
Figure 2
Figure 2. %Wt of elements for fossil and extant turtle bone.
(A) EDS point analyses of osteocytes, indicating high amounts of iron and manganese in the fossil cells (from Mongolemys elegans and the podocnemidid indet. specimens), whereas carbon and nitrogen dominate the cells from extant taxa (Podocnemis lewyana and Lepidochelys olivacea), including those from a chicken (Gallus gallus). (B) EDS point analyses of blood vessels, with fossil and extant showing a similar elemental composition rich in carbon and nitrogen. (C) EDS point analyses of the bone matrix surrounding osteocytes or blood vessels. Note how fossil and extant samples exhibit similar %Wt values for calcium, carbon, and phosphorus. Fossils show relative enrichment in iron and a lower amount of nitrogen in comparison to the extant bone matrix samples. (D) EDS point analyses of the surrounding rock matrix, which show an absence of carbon, calcium, and nitrogen, but abundant silicon and aluminum. Full data for these EDS point analyses are presented in Data S1, S2.
Figure 3
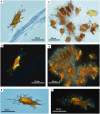
Figure 3. Fossil osteocytes-like from Mongolemys elegans (IGM-90/42).
(A–F) Isolated (post-demineralization) osteocytes-like viewed under transmitted light microscopy (A, C, E) and polarized light microscopy (B, D, F), showing low to moderate birefringence. All photographs taken with a 100X-oil immersion objective lens.
Figure 4
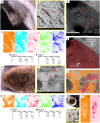
Figure 4. SEM/EDS analyses of Allaeochelys crassesculpta (SMF ME-2449) bone.
(A–D) Micrographs of two Haversian canals, in which (B, D) show the blood vessels-like outlined in red, and osteoblasts-like outlined in green in. Measurements of the width of a blood vessel-like width, wall thickness, and osteoblast-like diameters are shown in (D). (E–G) Micrograph (E) and EDS elemental maps (F–G) of one of the blood vessels-like. (H) Elemental intensities for point 3 (blood vessel-like) shown in (E), showing it to be rich in carbon and nitrogen. (I) Elemental intensities for point 5 (bone matrix) shown in (E), showing an abundance of calcium, phosphorus, and iron, and absence of carbon and nitrogen. (J) Bone fragment placed in the SEM holder. (K) Micrograph showing a blood vessel-like embedded in the bone matrix, from the yellow region indicated in (J). (L) Close-up micrograph of the blood vessel-like shown in the red rectangle in (K). (M) Elemental intensities for point 3 (blood vessel-like) shown in (L), showing a high amount of carbon. (N) Elemental maps of the blood vessel-like shown in (L), indicating a high amount of carbon and nitrogen, these elements are absent in the surrounding bone matrix, which is composed mainly of calcium and phosphorus. (O–Q) Micrograph and EDS elemental maps of a bone margin in contact with rock matrix, the latter of which exhibits relatively higher amount of aluminum and absence of calcium, phosphorus, and iron. Full data for these EDS point analyses are presented in Data S1, S2.
Figure 5
Figure 5. SEM/EDS analyses of podocnemidid indet. (UR-CP-0043) bone.
(A) Bone sample mounted in the SEM holder. (B–C) Micrograph and EDS element maps of one of the blood vessels-like embedded in the bone matrix, showing high amounts of carbon and nitrogen, a moderate amount of silicon; this differs from the bone matrix, which is dominated by calcium and phosphorus. (D) Elemental intensities for point 2 (blood vessel-like) shown in (B). (E) Elemental intensities for point 5 (bone matrix) shown in (B), showing a high amount of calcium and phosphorus. (F–G) Micrographs showing an osteocyte- and blood vessel-like 20 μm away from each other, both embedded in the bone matrix. (H) EDS element maps of the region shown in (F), the blood vessel-like exhibits high amounts of carbon and nitrogen, and the osteocyte-like is richer in iron but lacks significant carbon and nitrogen. (I) Elemental intensities for point 2 (blood vessel-like) shown in (F). (J) Elemental intensities for point 7 (osteocyte-like) shown in (F). (K) An isolated bone fragment after four days of demineralization, viewed under transmitted light microscopy (at 20×). (L) Close-up of the red rectangle region shown in (K), under polarized light microscopy (at 40×), showing darker osteocyte-like adjacent to where dendritic pyrolusite mats. (M) Close-up of the red rectangle region shown in (L) (at 100×), showing the dendritic pyrolusite and some of the osteocytes-like in detail. Full data for these EDS point analyses are presented in Data S1, S2.
Figure 6
Figure 6. SEM/EDS analyses of the extant turtle and chicken bones.
(A) Bone fragment of Podocnemis lewyana in the SEM holder. (B–C) Micrograph and EDS element maps of osteocytes embedded in the bone matrix, showing high amounts of carbon and nitrogen; this differ from the bone matrix, which is dominated by calcium and phosphorus. (D) Elemental intensities for point 3 (osteocyte) shown in (B). (E) Elemental intensities for point 4 (bone matrix) shown in (B). (F) Micrograph of one of the Volkmann canals and a blood vessel system in the sample of P. lewyana. (G) Close-up of the Volkmann canal wall and blood vessel system (outlined in red) P. lewyana. (H) Bone fragment of Lepidochelys olivacea in the SEM holder. (I) Micrograph of a region of the cancellous bone shown in the yellow rectangle in (H). (J–K) EDS composite (J) and individual elemental (K) analyses of the bone region shown in (I). (L) Elemental intensities for point 2 (blood vessel) shown in (I), showing high amount of carbon and nitrogen. (M) Elemental point values for point 5 (bone matrix) shown in (I), showing high amounts of calcium and carbon. (N) Bone fragment from a femur of Gallus gallus in the SEM holder. (O) Micrograph of the bone region shown in the yellow rectangle in (N), showing osteocytes embedded in the bone matrix. (P) EDS elemental maps of one of the osteocytes (in the red rectangle) shown in (O), showing a high amount of carbon within the cell. Full data for these point analyses are presented in Data S1, S2.

Similar articles

Cited by

References

    1. Alfonso-Rojas AF, Cadena EA. Exceptionally preserved ‘skin’ in an Early Cretaceous fish from Colombia. PeerJ. 2020;8:e9479. - PMC - PubMed
    1. Bailleul AM, O’Connor J, Schweitzer MH. Dinosaur paleohistology: review, trends and new avenues of investigation. PeerJ. 2019;7:e7764. - PMC - PubMed
    1. Bailleul AM, Zheng W, Horner JR, Hall BK, Holliday CM, Schweitzer MH. Evidence of proteins, chromosomes and chemical markers of DNA in exceptionally preserved dinosaur cartilage. National Science Review. 2020;7(4):815–822. doi: 10.1093/nsr/nwz206. - DOI - PMC - PubMed
    1. Bonewald LF. The amazing osteocyte. Journal of Bone Mineral Research. 2011;26:229–238. doi: 10.1002/jbmr.320. - DOI - PMC - PubMed
    1. Boskey AL, Gehron PR. The composition of bone. In: Rosen CJ, editor. Primer on the metabolic bone diseases and disorders of mineral metabolism. John Wiley & Sons Inc.; Washington, D.C.: 2013. pp. 49–58.

LinkOut - more resources