. 2020 Jul 31:18:443-456.
doi: 10.1016/j.omto.2020.07.008. eCollection 2020 Sep 25.

Molecular Rules Underpinning Enhanced Affinity Binding of Human T Cell Receptors Engineered for Immunotherapy

Affiliations

Molecular Rules Underpinning Enhanced Affinity Binding of Human T Cell Receptors Engineered for Immunotherapy

Rory M Crean et al. Mol Ther Oncolytics. .

Abstract

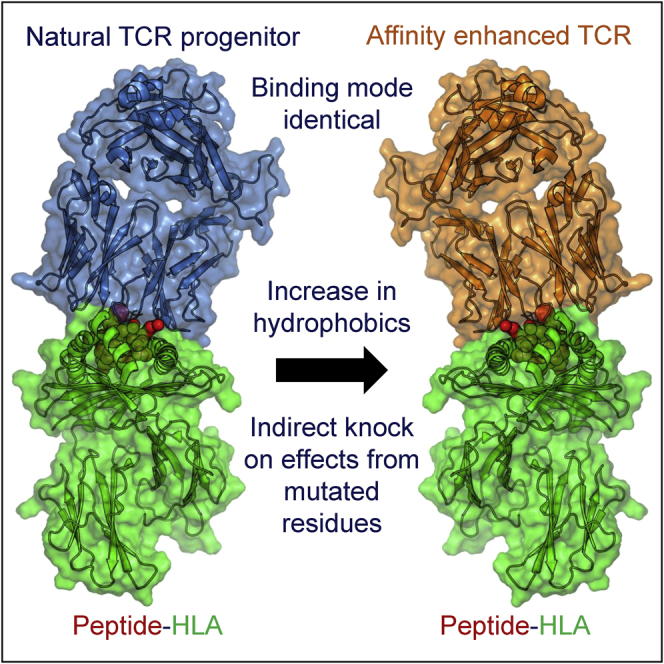
Immuno-oncology approaches that utilize T cell receptors (TCRs) are becoming highly attractive because of their potential to target virtually all cellular proteins, including cancer-specific epitopes, via the recognition of peptide-human leukocyte antigen (pHLA) complexes presented at the cell surface. However, because natural TCRs generally recognize cancer-derived pHLAs with very weak affinities, efforts have been made to enhance their binding strength, in some cases by several million-fold. In this study, we investigated the mechanisms underpinning human TCR affinity enhancement by comparing the crystal structures of engineered enhanced affinity TCRs with those of their wild-type progenitors. Additionally, we performed molecular dynamics simulations to better understand the energetic mechanisms driving the affinity enhancements. These data demonstrate that supra-physiological binding affinities can be achieved without altering native TCR-pHLA binding modes via relatively subtle modifications to the interface contacts, often driven through the addition of buried hydrophobic residues. Individual energetic components of the TCR-pHLA interaction governing affinity enhancements were distinct and highly variable for each TCR, often resulting from additive, or knock-on, effects beyond the mutated residues. This comprehensive analysis of affinity-enhanced TCRs has important implications for the future rational design of engineered TCRs as efficacious and safe drugs for cancer treatment.

Keywords: MD; T cell receptor; T cells; TCR; X-ray crystallography; cancer immunotherapy; molecular dynamics; pHLA; peptide-human leukocyte antigen; simulations.


Figures

None
Graphical abstract
Figure 1
Figure 1
Structural Comparison of Overall Binding Modes of Affinity Enhanced and Wild-Type TCR-pHLA Complexes Shows Virtually Identical Conformations (A–F) Left: structural overlay of wild-type (WT) TCR-pHLA complexes versus affinity-enhanced (ae)TCR-pHLA complexes. TCR and HLA are shown as cartoon and peptide is shown as stick representation. Right top: overlay of CDR loop positions of WT and aeTCRs. Backbone locations of each CDR loop shown as line representation. In each panel, the WT TCR complex structure is in grayscale and the aeTCR complex structure is colored by chain: TCRα, blue; TCRβ, green; HLA, dark gray; β2m, light gray. Right bottom: TCR crossing angle of WT TCR-pHLA complexes versus aeTCR-pHLA complexes. pHLA is shown as surface representation (gray). TCRα (blue) and TCRβ (green) centroid locations of aeTCR structure are shown as spheres. (A) 1G4 TCR and multiple aeTCR variants in complex with HLA-A∗0201-SLLMWITQC. (B) DMF5 TCR and aeTCR variant DMF5_YW in complex with HLA-A∗0201-ELAGIGILTV. (C) MEL5 TCR and aeTCR variant MEL5_α24β17 in complex with HLA-A∗0201-ELAGIGILTV. (D) MEL5 TCR and aeTCR variant MEL5_α24β17 in complex with HLA-A∗0201-EAAGIGILTV. (E) A6 TCR and aeTCR variant A6_c134 in complex with HLA-A∗0201-LLFGYPVYV. (F) ILA1 TCR and aeTCR variant ILA1_α1β1 in complex with HLA-A∗0201-ILAKFLHWL.
Figure 2
Figure 2
Differences in the Average Number of Contacts Formed during pHLA Engagement of WT TCRs versus aeTCRs (A) Difference (Δ) in the number of contacts between WT TCRs and aeTCRs segregated by contact type analyzed using crystal structures. Boxplots represent median (middle line), interquartile ranges Q1 (box lower) and Q3 (box upper), Q1-1.5∗IQR (lower whisker), and Q3+1.5∗IQR (upper whisker). Individual scatter points of each TCR are overlaid and colored by the TCR-pHLA system-indicated inset. vdW, van der Waals (≤4.0 Å); HBs, hydrogen bonds (≤3.4 Å); SBs, salt bridges (≤3.4 Å). (B) Difference in the number of contacts between WT and aeTCRs from crystal structures segregated by contacts to HLA or peptide atoms or both (total). (C) Surface plots of the pHLA (peptide atoms shown as spheres) with each structure color mapped according the average number of vdWs contacts formed between the given residue and the TCR during the course of MD simulations. Color mapping was performed from white (no contacts) through yellow and orange to red (highest number of contacts observed for each of the pairs of TCR-pHLAs studied). All pHLA structures are shown in the same orientation, such that the peptide N terminus is left, and the C terminus is right. TCR residues contributing substantially to new contacts are labeled in black and indicated with black lines. Corresponding peptide or HLA residues are labeled in light blue. For brevity, only one 1G4 aeTCR is shown; all others are shown in Figure S2. Note that (A) and (B) were generated from crystal structure analysis, while (C) was generated from MD simulation data.
Figure 3
Figure 3
Changes in the Energetic Footprint between WT TCRs and aeTCRs (A) Experimental versus computational ΔΔG values obtained from our MMGBSA calculations for all TCR-pHLA systems studied. Error bars plotted are the standard deviation obtained from the 25 replicas performed per complex. (B) For all TCR-pHLA complexes, the HLA (top) and TCR (bottom) structures are plotted as surfaces with the peptide shown in both structures as ball and stick representations. All plots are color mapped according to the MMGBSA per residue decomposition results, going from blue (favorable binding) to white (neutral) to red (unfavorable binding) with the WT TCR-pHLA complex on the left, and the Δ (ae-WT) on the right for each system. Separate scaling is used for each of the four sets of TCRs studied as indicated by the color bars below each group (kcal mol−1). All pHLA and TCR structures are shown in the same orientation, such that the peptide N terminus is left and the C terminus is right. Several mutations sites are indicated on the aeTCR variants (purple labels, CDRα mutations; green labels, CDRβ mutations). For brevity only one 1G4 aeTCR is shown. All others are shown in Figure S3.
Figure 4
Figure 4
The 1G4 aeTCRs Show Largely Additive Energetic Effects upon Affinity Enhancement (A) Per-residue ΔG differences as obtained from MMGBSA analysis between the aeTCR variants and 1G4 TCRs (i.e., ΔΔG), with positions mutated indicated throughout in red. ΔΔG differences between the 1G4 TCR and aeTCRs are colored blue when ≤0.5 kcal mol–1 (favorable for binding) and red when >0.5 kcal mol–1 (unfavorable for binding), with values in between colored green. (B–G) Color mapping of the above per residue ΔΔG values onto all carbon atoms of the aeTCRs (with the 1G4 TCR structure shown in green for reference). Color mapping is performed from blue to white to red, with blue indicating a favorable change and red indicating an unfavorable change for the aeTCRs. Figures are divided to focus on the different regions of the TCR subjected to affinity maturation (CDR2α, CDR3α, CDR2β, and CDR3β), and subdivided when mutations are not consistent between aeTCRs. (B) 1G4_c58c61/2, CDR2α; (C) 1G4_c49c50, CDR2α; (D) 1G4_c5c1 + 1G4_c58c61/2, CDR3α; (E) 1G4_c49c50 + 1G4_c58c62, CDR2β; (F) 1G4_c5c1 + 1G4_c58c61, CDR2β; and (G) 1G4_c5c1 + 1G4_c58c61/2, CDR3β. (1G4_c58c61/2 means that both 1G4_c58c61 and 1G4_c58c62 TCRs are shown).
Figure 5
Figure 5
Changes in Energetics at the TCR-pHLA Interface upon Affinity Enhancement of the A6, DMF5, and MEL5 TCRs (A) Per-residue ΔG differences as obtained from MMGBSA analysis between the A6, DMF5, and MEL5 derived aeTCR variants and their counterpart WT TCRs (i.e., ΔΔG), with positions mutated indicated throughout in red. ΔΔG differences between the WT TCR and aeTCR pair are colored blue when ≤0.5 kcal mol–1 (favorable for aeTCRs) and red when 0.5 kcal mol–1 (unfavorable for aeTCRs), with all values in-between colored green. (B–G) Color mapping of the above per residue ΔΔG values onto all carbon atoms of the aeTCRs (with the WT TCR structure shown in green for reference). Color mapping is performed from blue to white to red, with blue indicating a favorable change and red indicating an unfavorable change for the aeTCRs, respectively. Figures are divided up to show the regions which show the major changes upon affinity maturation. (B) A6_c134, CDR3β; (C) DMF5_YW, CDR1α; (D) DMF5_YW, CDR3β; (E) MEL5_α24β17, CDR2β; (F) MEL5_α24β17, CDR2β; and (G) MEL5_α24β17, CDR1α and CDR3α.
Figure 6
Figure 6
Differences in Flexibility between the aeTCRs Variable Regions and Their Counterpart WT TCRs (A) ΔRMSF values (aeTCR variant RMSF-WT 1G4 TCR RMSF) for the 1G4-derived aeTCRs, with the top panels corresponding to the CDRα and CDRβ of the apo TCRs, and bottom panels corresponding to CDRα and CDRβ of the TCRs in complex with pHLA. (B) ΔRMSF values (aeTCR variant RMSF-WT TCR RMSF) for the MEL5-, DMF5-, and A6-derived aeTCRs, with top panels corresponding to the CDRα and CDRβ of the apo TCRs, and bottom panels corresponding to CDRα and CDRβ of the TCRs in complex with pHLA. A more negative ΔRMSF value indicates increased rigidity for the aeTCR variant relative to the WT TCR. The points toward the bottom of each graph indicate residues with significantly different ΔRMSF values as determined by a two-sample t test (p < 0.05). The numbers boxed in red represent regions of each aeTCR that increase rigidity compared to the WT TCRs in the pHLA bound form. Complete RMSF plots for all TCRs simulated are provided in Figures S4–S7. (C) For each region of the aeTCRs where increased rigidity compared to the WT TCRs in pHLA bound form was observed (marked by numbers in red boxes), the corresponding CDR or HV4 loop of the TCR is shown (as cartoon colored in accordance with A and B) with mutations from WT TCR to aeTCR labeled (shown as red sticks). Black arrows show which regions of the TCR-pHLA complex are near each loop, to provide a potential mechanism for the increases in rigidity detected.

Similar articles

Cited by

References

    1. de Souza J.E.S., Galante P.A.F., de Almeida R.V.B., da Cunha J.P.C., Ohara D.T., Ohno-Machado L., Old L.J., de Souza S.J. SurfaceomeDB: a cancer-orientated database for genes encoding cell surface proteins. Cancer Immun. 2012;12:15. - PMC - PubMed
    1. Dunn S.M., Rizkallah P.J., Baston E., Mahon T., Cameron B., Moysey R., Gao F., Sami M., Boulter J., Li Y., Jakobsen B.K. Directed evolution of human T cell receptor CDR2 residues by phage display dramatically enhances affinity for cognate peptide-MHC without increasing apparent cross-reactivity. Protein Sci. 2006;15:710–721. - PMC - PubMed
    1. Li Y., Moysey R., Molloy P.E., Vuidepot A.-L., Mahon T., Baston E., Dunn S., Liddy N., Jacob J., Jakobsen B.K., Boulter J.M. Directed evolution of human T-cell receptors with picomolar affinities by phage display. Nat. Biotechnol. 2005;23:349–354. - PubMed
    1. Boulter J.M., Glick M., Todorov P.T., Baston E., Sami M., Rizkallah P., Jakobsen B.K. Stable, soluble T-cell receptor molecules for crystallization and therapeutics. Protein Eng. 2003;16:707–711. - PubMed
    1. Oates J., Jakobsen B.K. ImmTACs: novel bi-specific agents for targeted cancer therapy. OncoImmunology. 2013;2:e22891. - PMC - PubMed