

Risk prediction in cutaneous melanoma patients from their clinico-pathological features: superiority of clinical data over gene expression data
- PMID: 32913910
- PMCID: PMC7472860
- DOI: 10.1016/j.heliyon.2020.e04811
Risk prediction in cutaneous melanoma patients from their clinico-pathological features: superiority of clinical data over gene expression data
Abstract
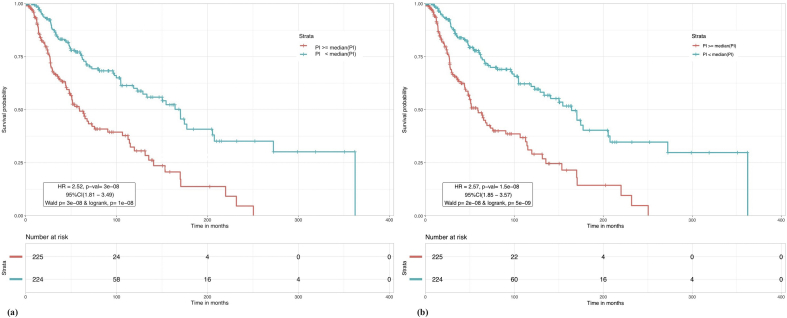
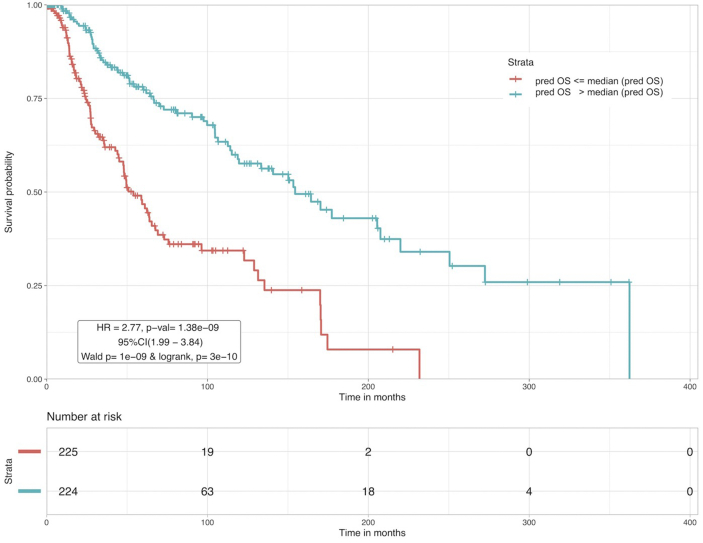
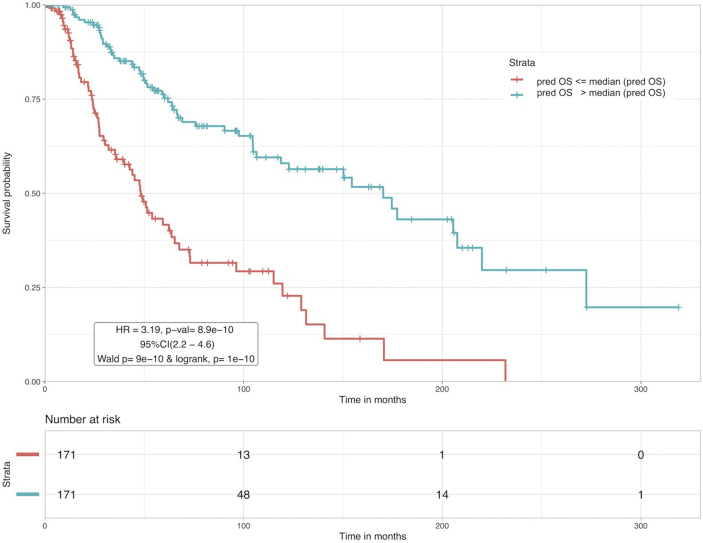
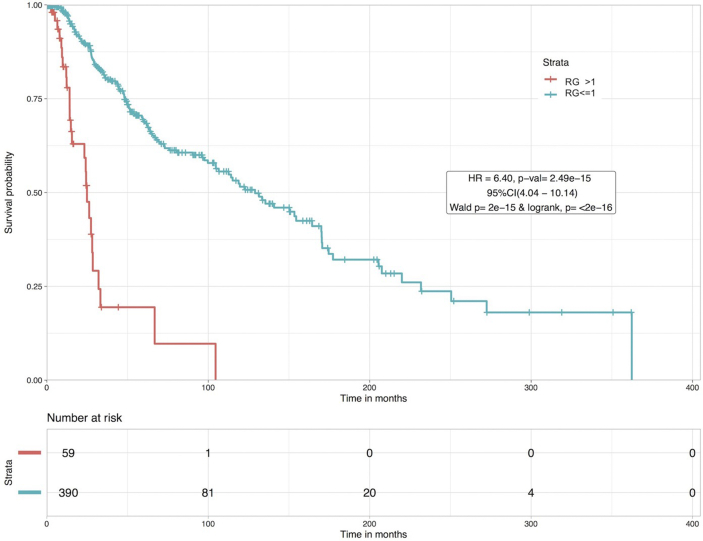
Risk assessment in cutaneous melanoma (CM) patients is one of the major challenges in the effective treatment of CM patients. Traditionally, clinico-pathological features such as Breslow thickness, American Joint Committee on Cancer (AJCC) tumor staging, etc. are utilized for this purpose. However, due to advancements in technology, most of the upcoming risk prediction methods are gene-expression profile (GEP) based. In this study, we have tried to develop new GEP and clinico-pathological features-based biomarkers and assessed their prognostic strength in contrast to existing prognostic methods. We developed risk prediction models using the expression of the genes associated with different cancer-related pathways and got a maximum hazard ratio (HR) of 2.52 with p-value ~10-8 for the apoptotic pathway. Another model, based on combination of apoptotic and notch pathway genes boosted the HR to 2.57. Next, we developed models based on individual clinical features and got a maximum HR of 2.45 with p-value ~10-6 for Breslow thickness. We also developed models using the best features of clinical as well as gene-expression data and obtained a maximum HR of 3.19 with p-value ~10-9. Finally, we developed a new ensemble method using clinical variables only and got a maximum HR of 6.40 with p-value ~10-15. Based on this method, a web-based service and an android application named 'CMcrpred' is available at (https://webs.iiitd.edu.in/raghava/cmcrpred/) and Google Play Store respectively to facilitate scientific community. This study reveals that our new ensemble method based on only clinico-pathological features overperforms methods based on GEP based profiles as well as currently used AJCC staging. It also highlights the need to explore the full potential of clinical variables for prognostication of cancer patients.
Keywords: Bioinformatics; Cancer; Cancer research; Genetics; Melanoma; Oncology; Prognosis; Risk prediction; Skin; Survival analysis.
© 2020 Published by Elsevier Ltd.
Figures
Similar articles
-
Identification of high-risk cutaneous melanoma tumors is improved when combining the online American Joint Committee on Cancer Individualized Melanoma Patient Outcome Prediction Tool with a 31-gene expression profile-based classification.J Am Acad Dermatol. 2017 May;76(5):818-825.e3. doi: 10.1016/j.jaad.2016.11.051. Epub 2017 Jan 19. J Am Acad Dermatol. 2017. PMID: 28110997
-
Prediction of risk scores for colorectal cancer patients from the concentration of proteins involved in mitochondrial apoptotic pathway.PLoS One. 2019 Sep 9;14(9):e0217527. doi: 10.1371/journal.pone.0217527. eCollection 2019. PLoS One. 2019. PMID: 31498794 Free PMC article.
-
Performance of a prognostic 31-gene expression profile in an independent cohort of 523 cutaneous melanoma patients.BMC Cancer. 2018 Feb 5;18(1):130. doi: 10.1186/s12885-018-4016-3. BMC Cancer. 2018. PMID: 29402264 Free PMC article.
-
Level of Evidence Review for a Gene Expression Profile Test for Cutaneous Melanoma.Am J Clin Dermatol. 2019 Dec;20(6):763-770. doi: 10.1007/s40257-019-00464-4. Am J Clin Dermatol. 2019. PMID: 31359351 Free PMC article. Review.
-
The Prognostic Value and Clinical Utility of the 40-Gene Expression Profile (40-GEP) Test in Cutaneous Squamous Cell Carcinoma: Systematic Review and Meta-Analysis.Cancers (Basel). 2023 Apr 25;15(9):2456. doi: 10.3390/cancers15092456. Cancers (Basel). 2023. PMID: 37173922 Free PMC article. Review.
Cited by
-
Machine learning to predict overall short-term mortality in cutaneous melanoma.Discov Oncol. 2023 Jan 31;14(1):13. doi: 10.1007/s12672-023-00622-5. Discov Oncol. 2023. PMID: 36719475 Free PMC article.
-
Prognostic biomarkers for predicting papillary thyroid carcinoma patients at high risk using nine genes of apoptotic pathway.PLoS One. 2021 Nov 12;16(11):e0259534. doi: 10.1371/journal.pone.0259534. eCollection 2021. PLoS One. 2021. PMID: 34767591 Free PMC article.
-
Bioinformatic and Machine Learning Applications in Melanoma Risk Assessment and Prognosis: A Literature Review.Genes (Basel). 2021 Oct 30;12(11):1751. doi: 10.3390/genes12111751. Genes (Basel). 2021. PMID: 34828357 Free PMC article. Review.
-
Systematic review of risk prediction tools for primary cutaneous melanoma outcomes and validation of sentinel lymph node positivity prediction in a UK tertiary cohort.BJC Rep. 2024 Nov 11;2(1):86. doi: 10.1038/s44276-024-00110-5. BJC Rep. 2024. PMID: 39528626 Free PMC article.
-
Sensitivity Analysis for Survival Prognostic Prediction with Gene Selection: A Copula Method for Dependent Censoring.Biomedicines. 2023 Mar 6;11(3):797. doi: 10.3390/biomedicines11030797. Biomedicines. 2023. PMID: 36979776 Free PMC article.
References
-
- Ossio R., Roldan-Marin R., Martinez-Said H., Adams D.J., Robles-Espinoza C.D. Melanoma: a global perspective. Nat. Rev. Canc. 2017;17:393–394. - PubMed
-
- Mintz B. Clonal basis of mammalian differentiation. Symp. Soc. Exp. Biol. 1971;25:345–370. https://www.ncbi.nlm.nih.gov/pubmed/4940552 Available at: - PubMed
-
- Markert C.L., Silvers W.K. The effects of genotype and cell environment on melanoblast differentiation in the house mouse. Genetics. 1956;41:429–450. https://www.ncbi.nlm.nih.gov/pubmed/17247639 Available at: - PMC - PubMed
-
- Theriault L.L., Hurley L.S. Ultrastructure of developing melanosomes in C57 black and pallid mice. Dev. Biol. 1970;23:261–275. - PubMed
-
- Barden H., Levine S. Histochemical observations on rodent brain melanin. Brain Res. Bull. 1983;10:847–851. - PubMed
LinkOut - more resources
Full Text Sources
