. 2019 Feb 15:3:PO.18.00229.
doi: 10.1200/PO.18.00229. eCollection 2020.

Application of Circulating Cell-Free Tumor DNA Profiles for Therapeutic Monitoring and Outcome Prediction in Genetically Heterogeneous Metastatic Melanoma

Affiliations

Application of Circulating Cell-Free Tumor DNA Profiles for Therapeutic Monitoring and Outcome Prediction in Genetically Heterogeneous Metastatic Melanoma

Renáta Váraljai et al. JCO Precis Oncol. .

Abstract

Purpose: Circulating cell-free tumor DNA (ctDNA) reflects the heterogeneous spectrum of tumor-specific mutations, especially in systemic disease. We validated plasma-based assays that allow the dynamic quantitative detection of ctDNA as a prognostic biomarker for tumor load and prediction of therapy response in melanoma.

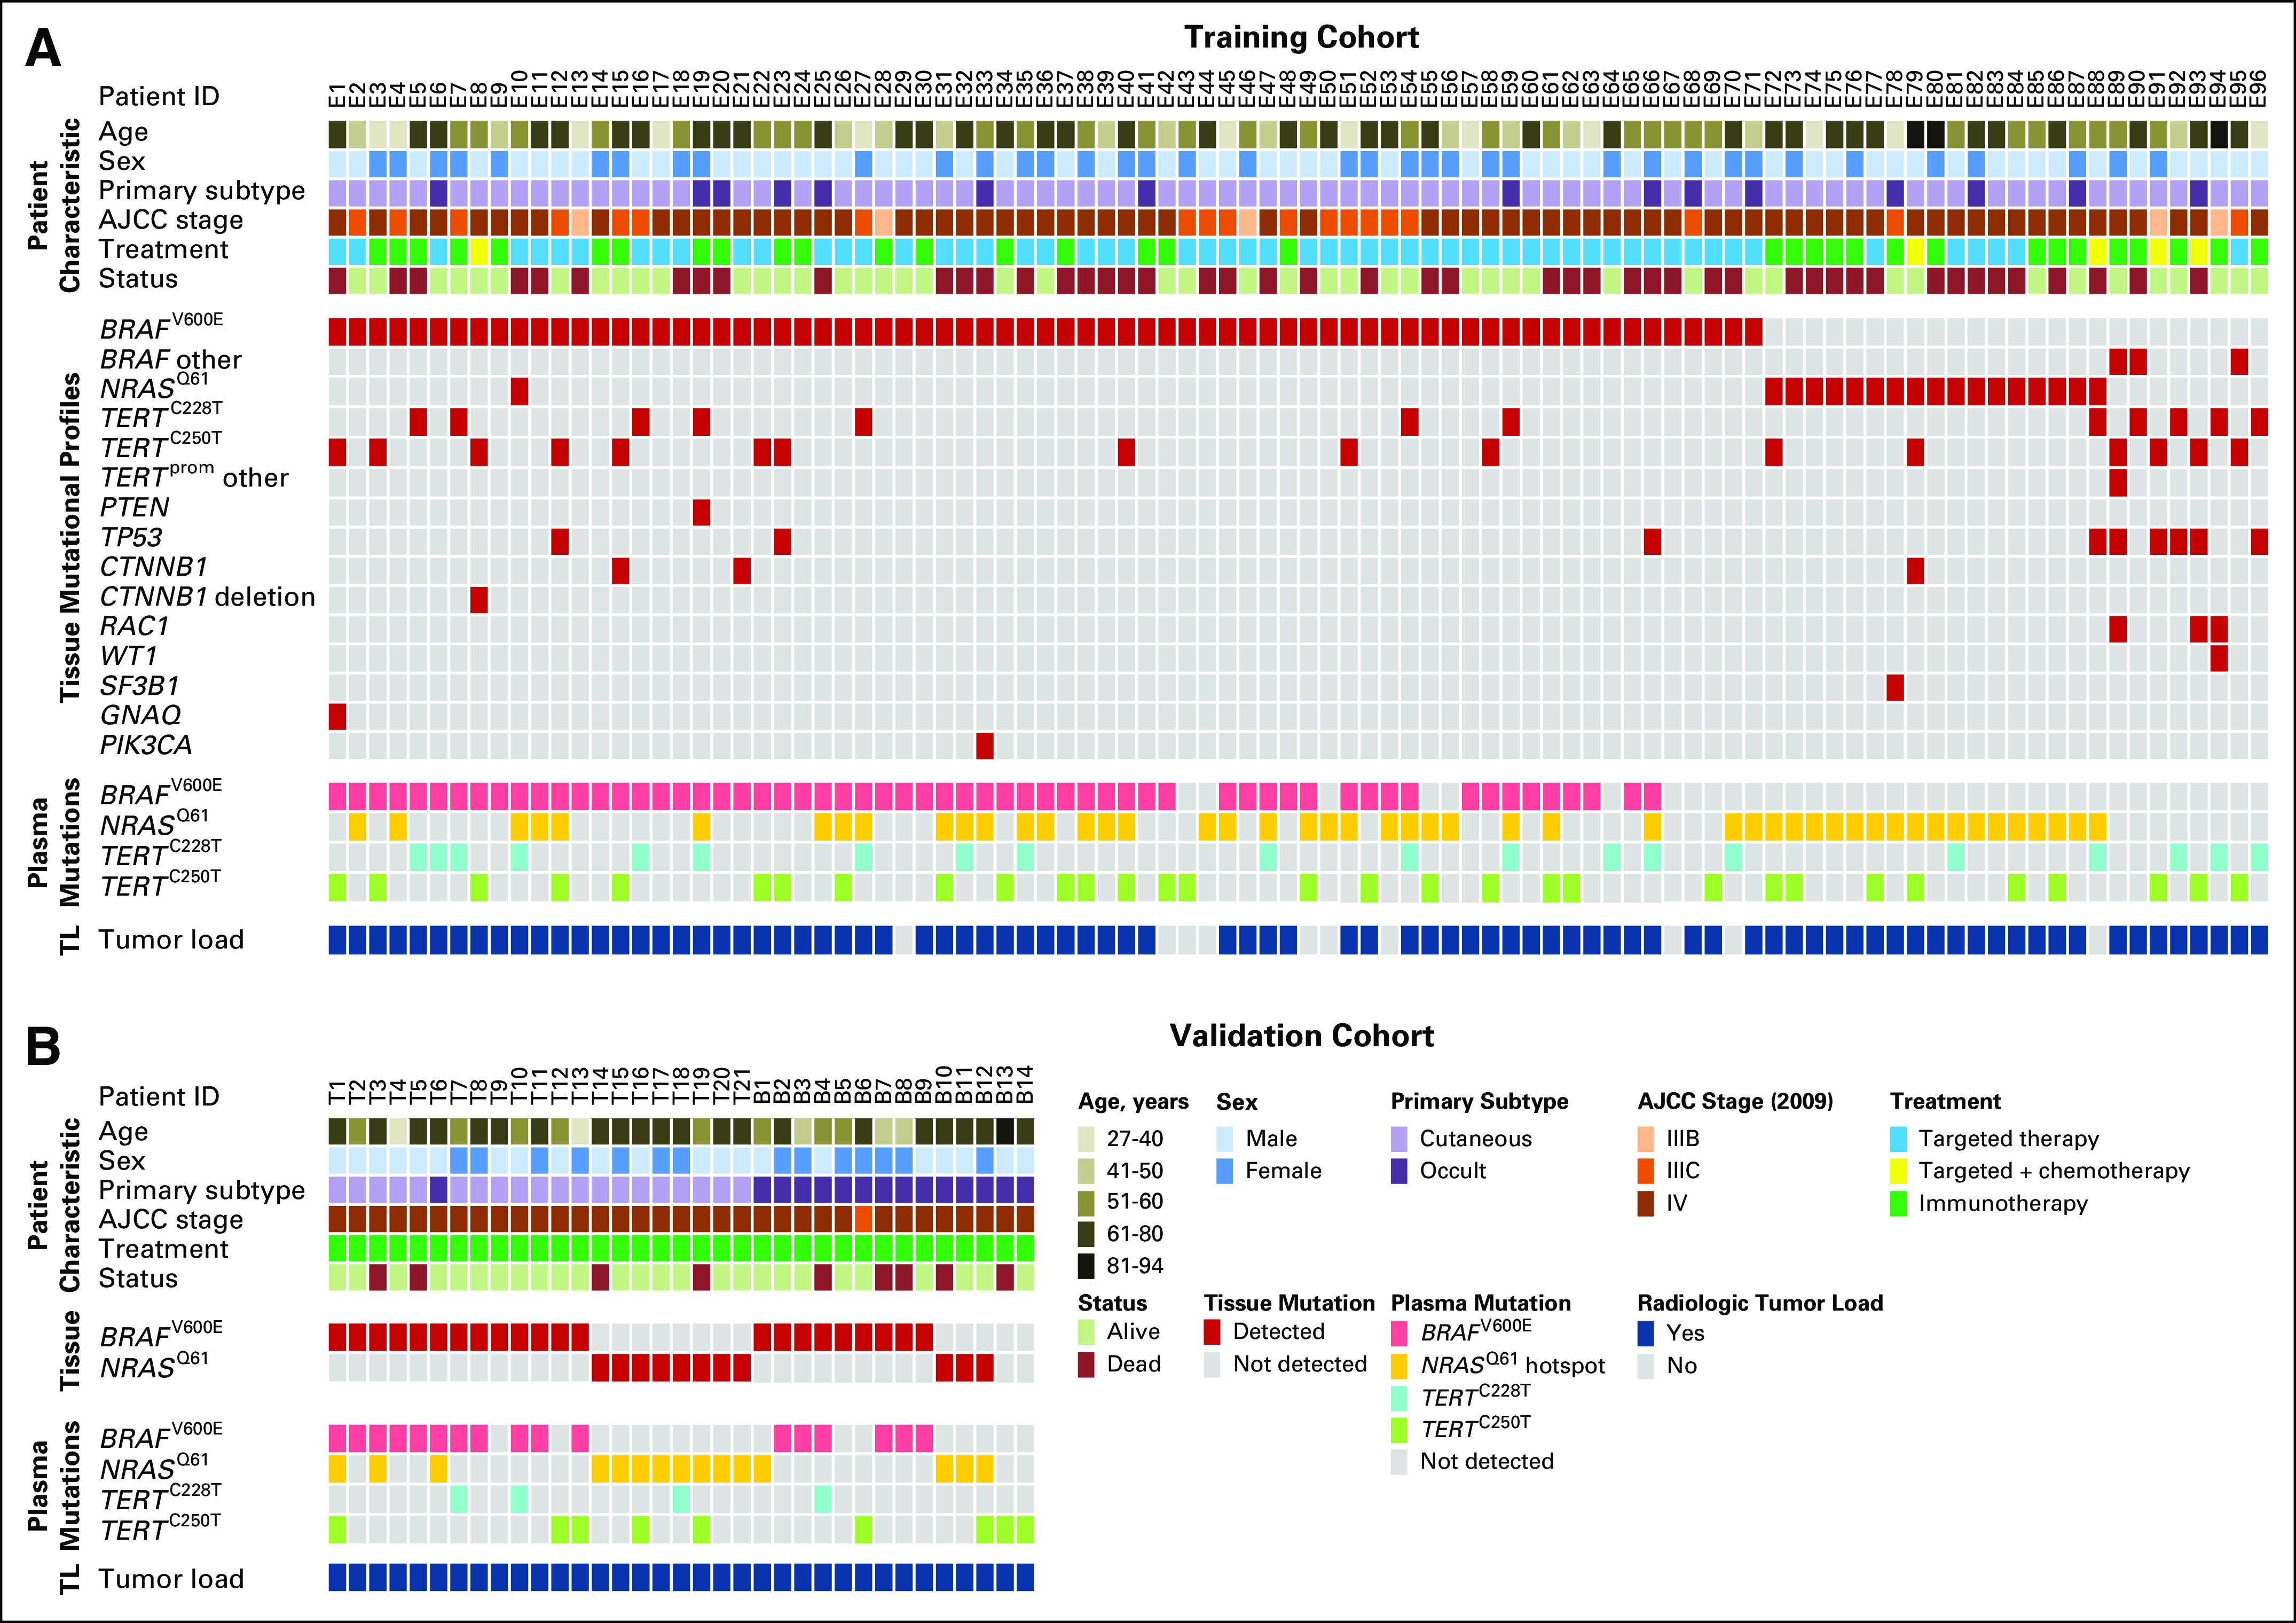
Materials and methods: We analyzed plasma-derived ctDNA from a large training cohort (n = 96) of patients with advanced-stage melanoma, with assays for the BRAF V600E and NRAS Q61 driver mutations as well as TERT C250T and TERT C228T promoter mutations. An independent patient cohort (n = 35) was used to validate the utility of ctDNA monitoring under mitogen-activated protein kinase-targeted or immune checkpoint therapies.

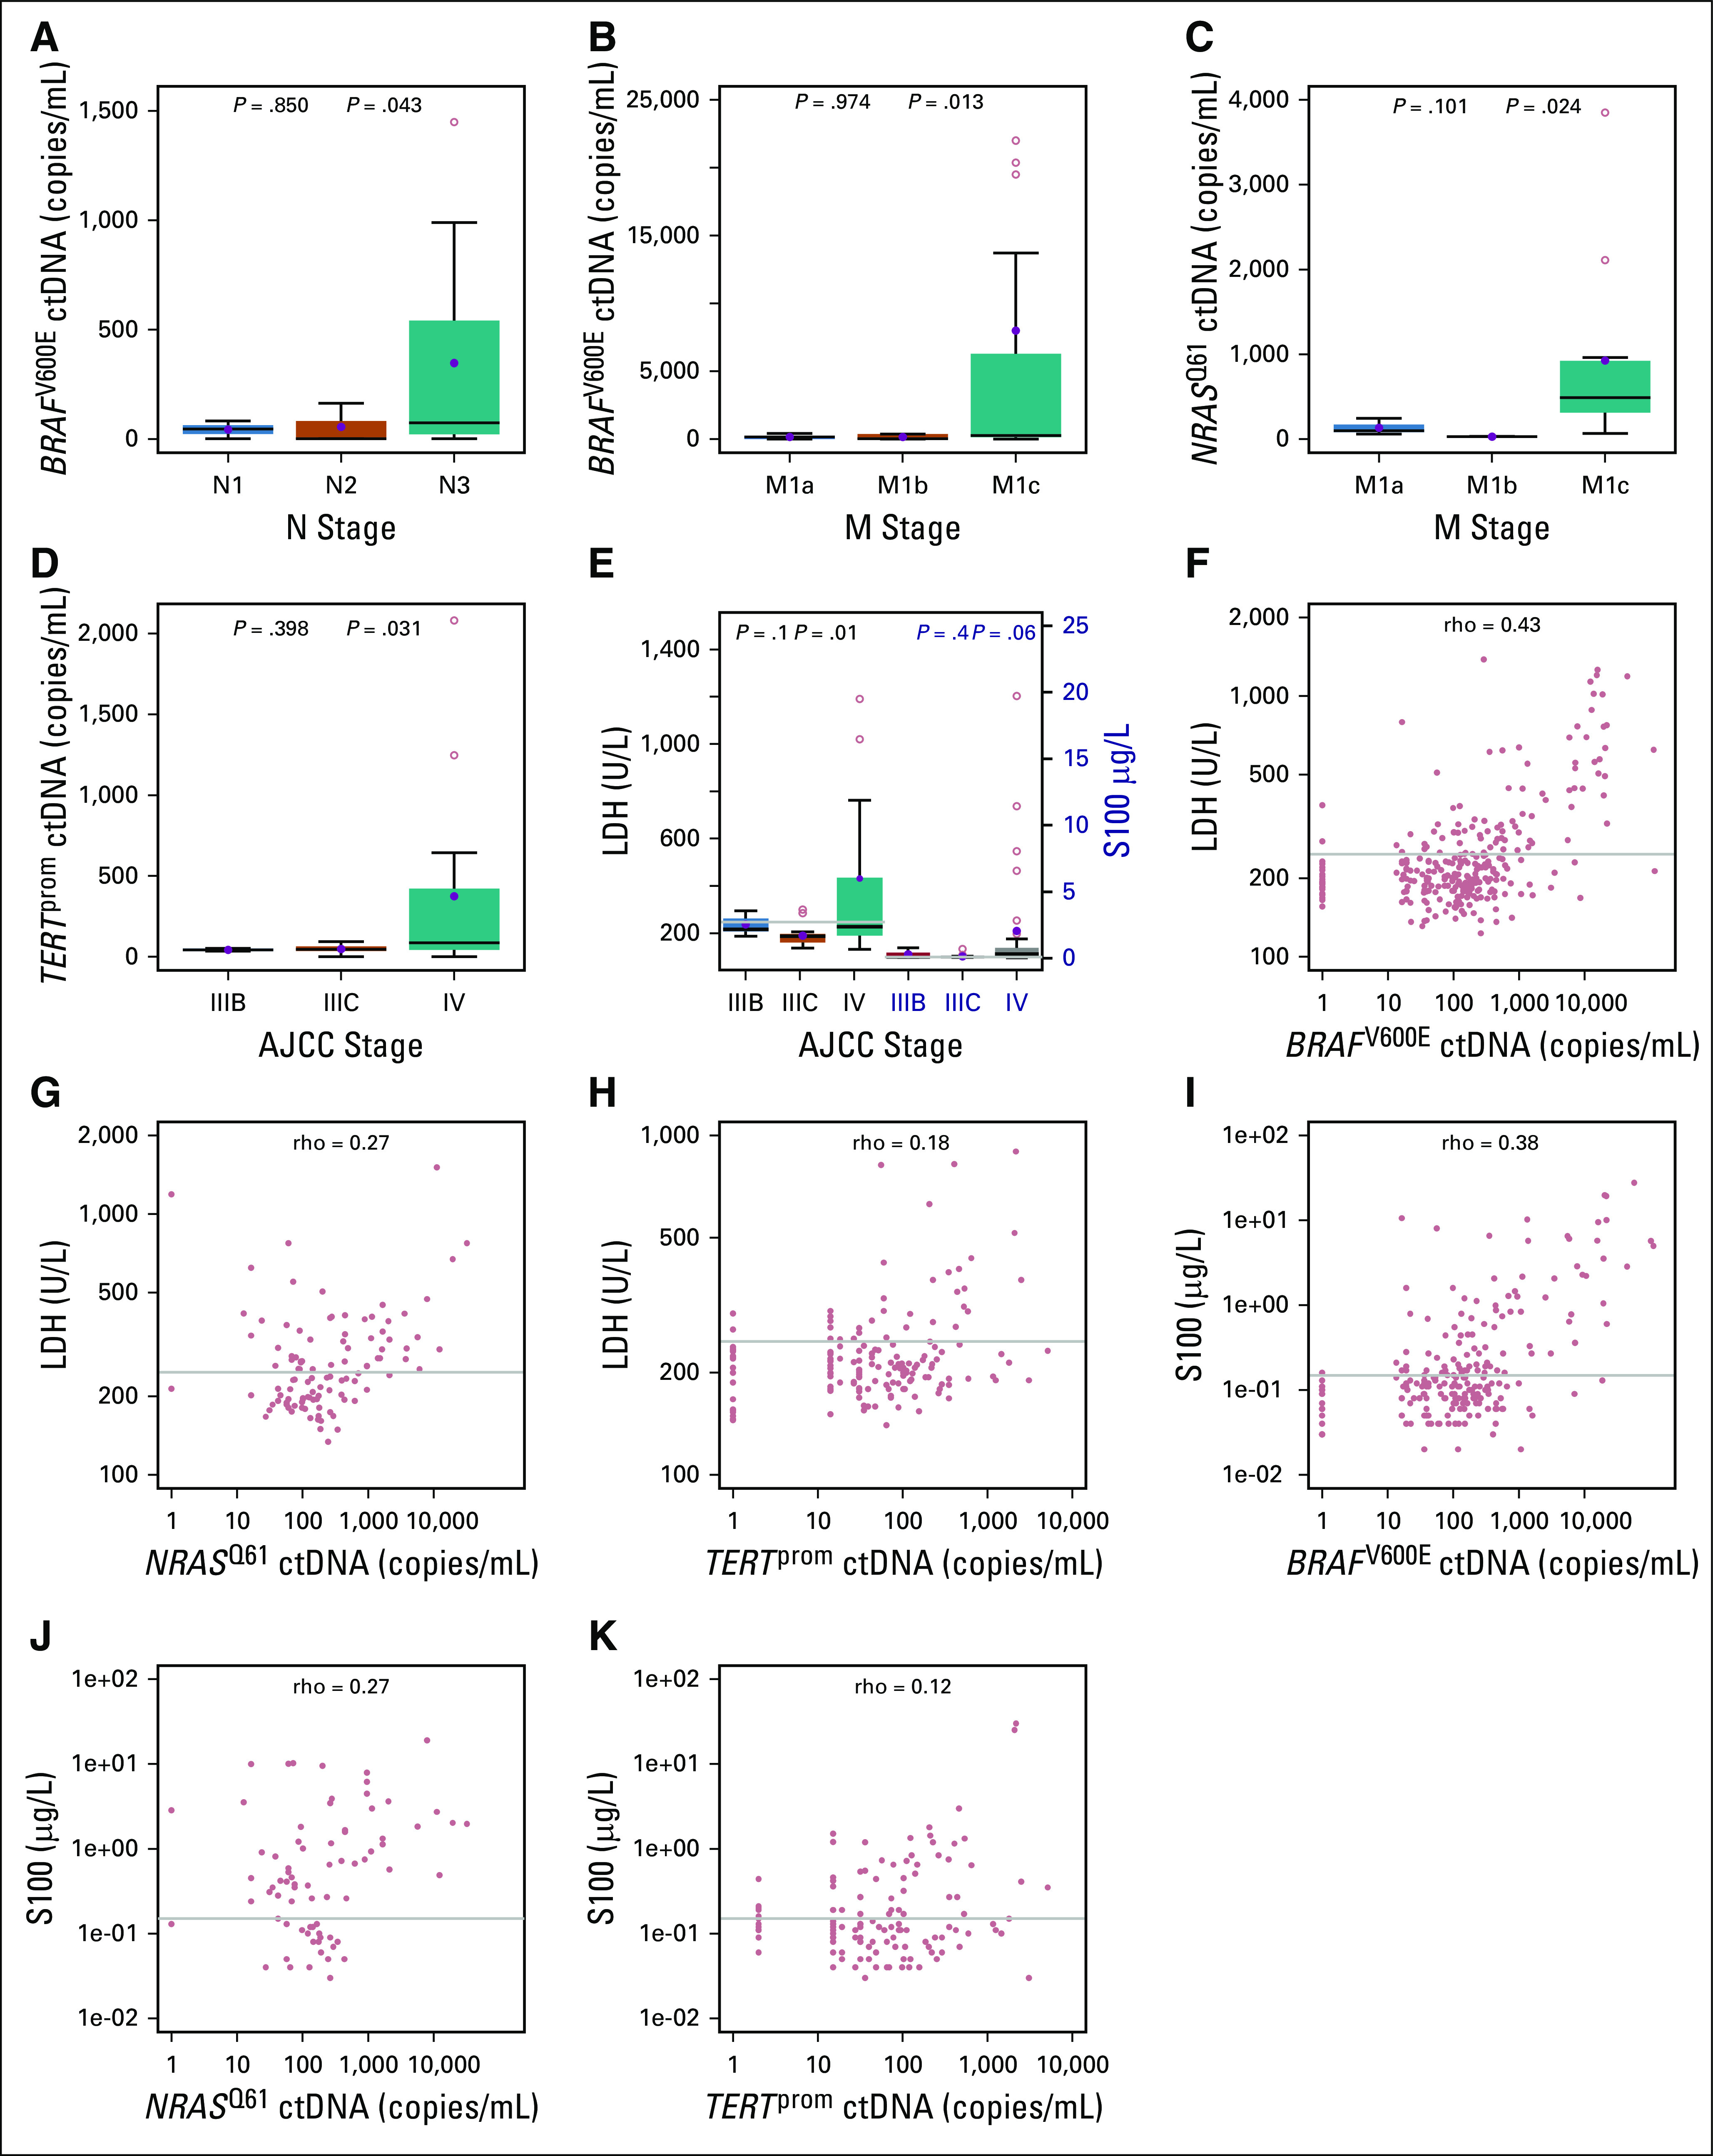
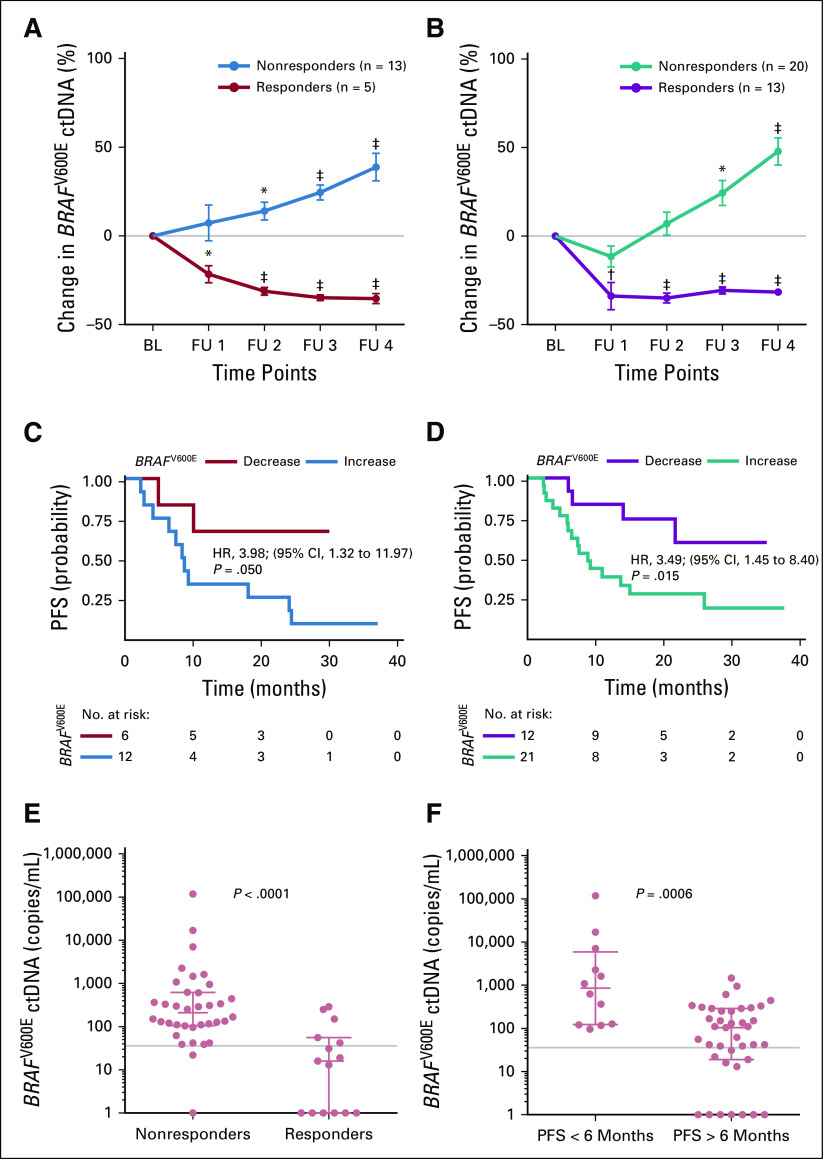
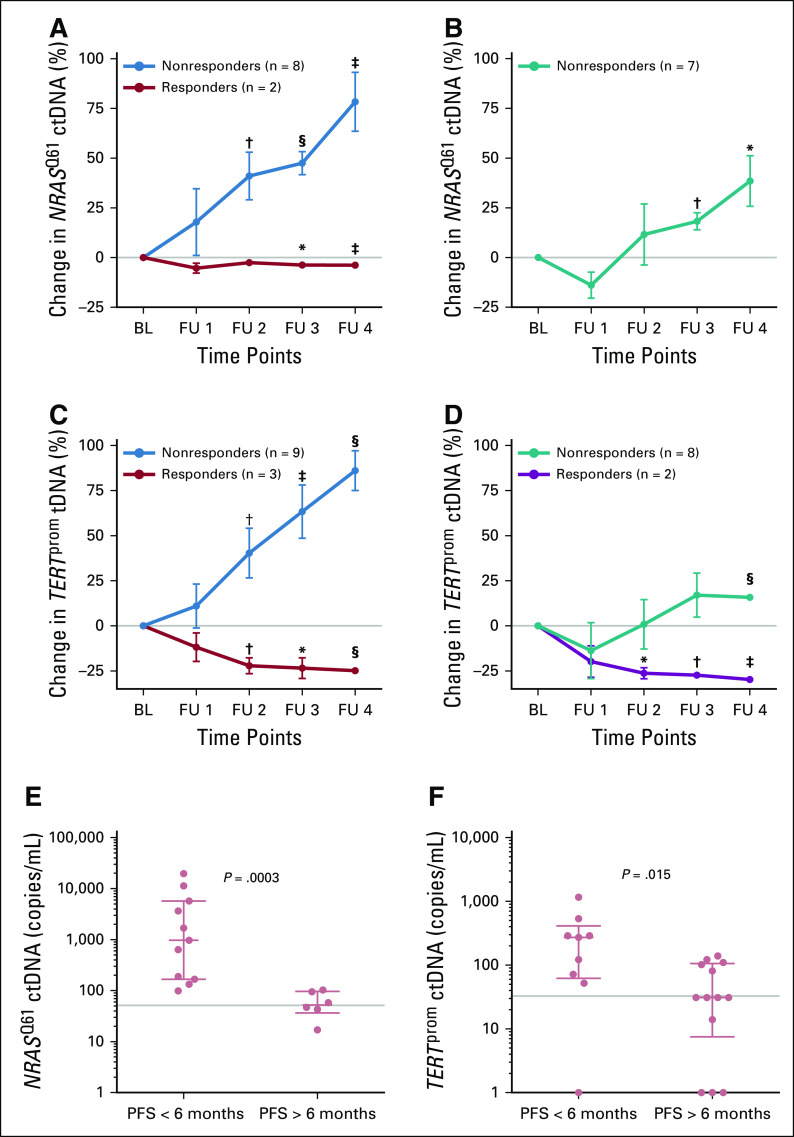
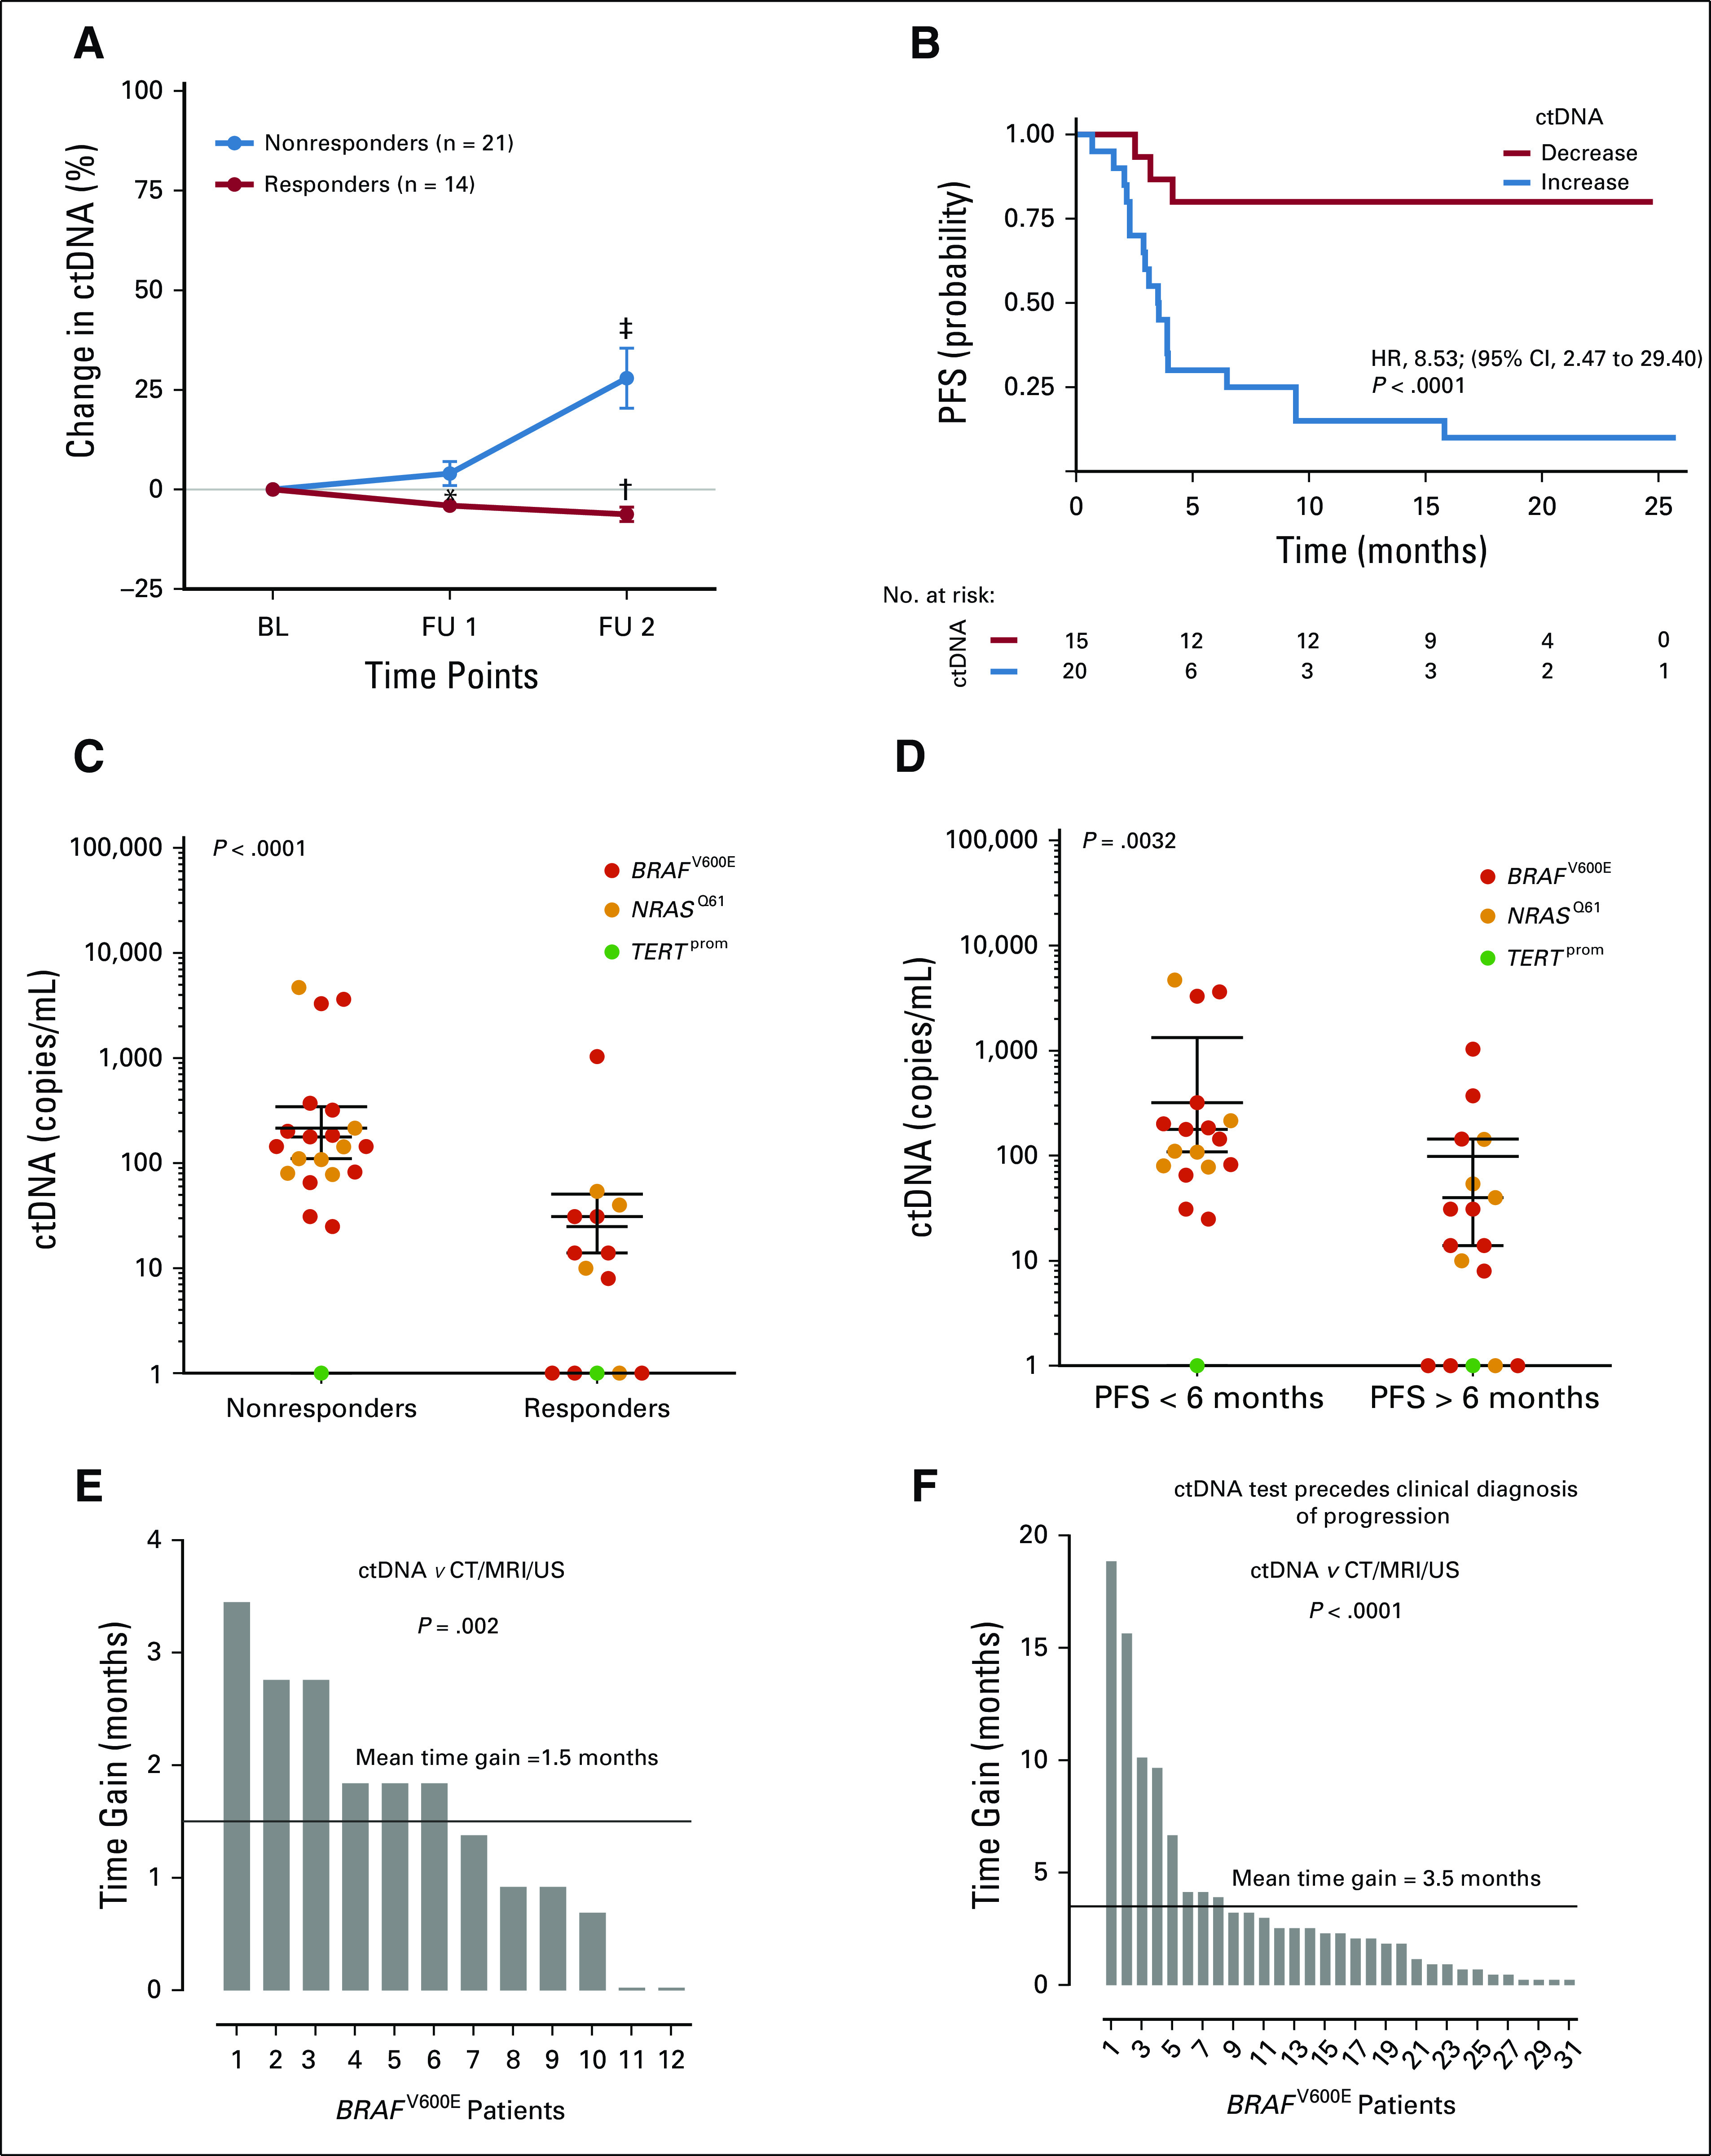
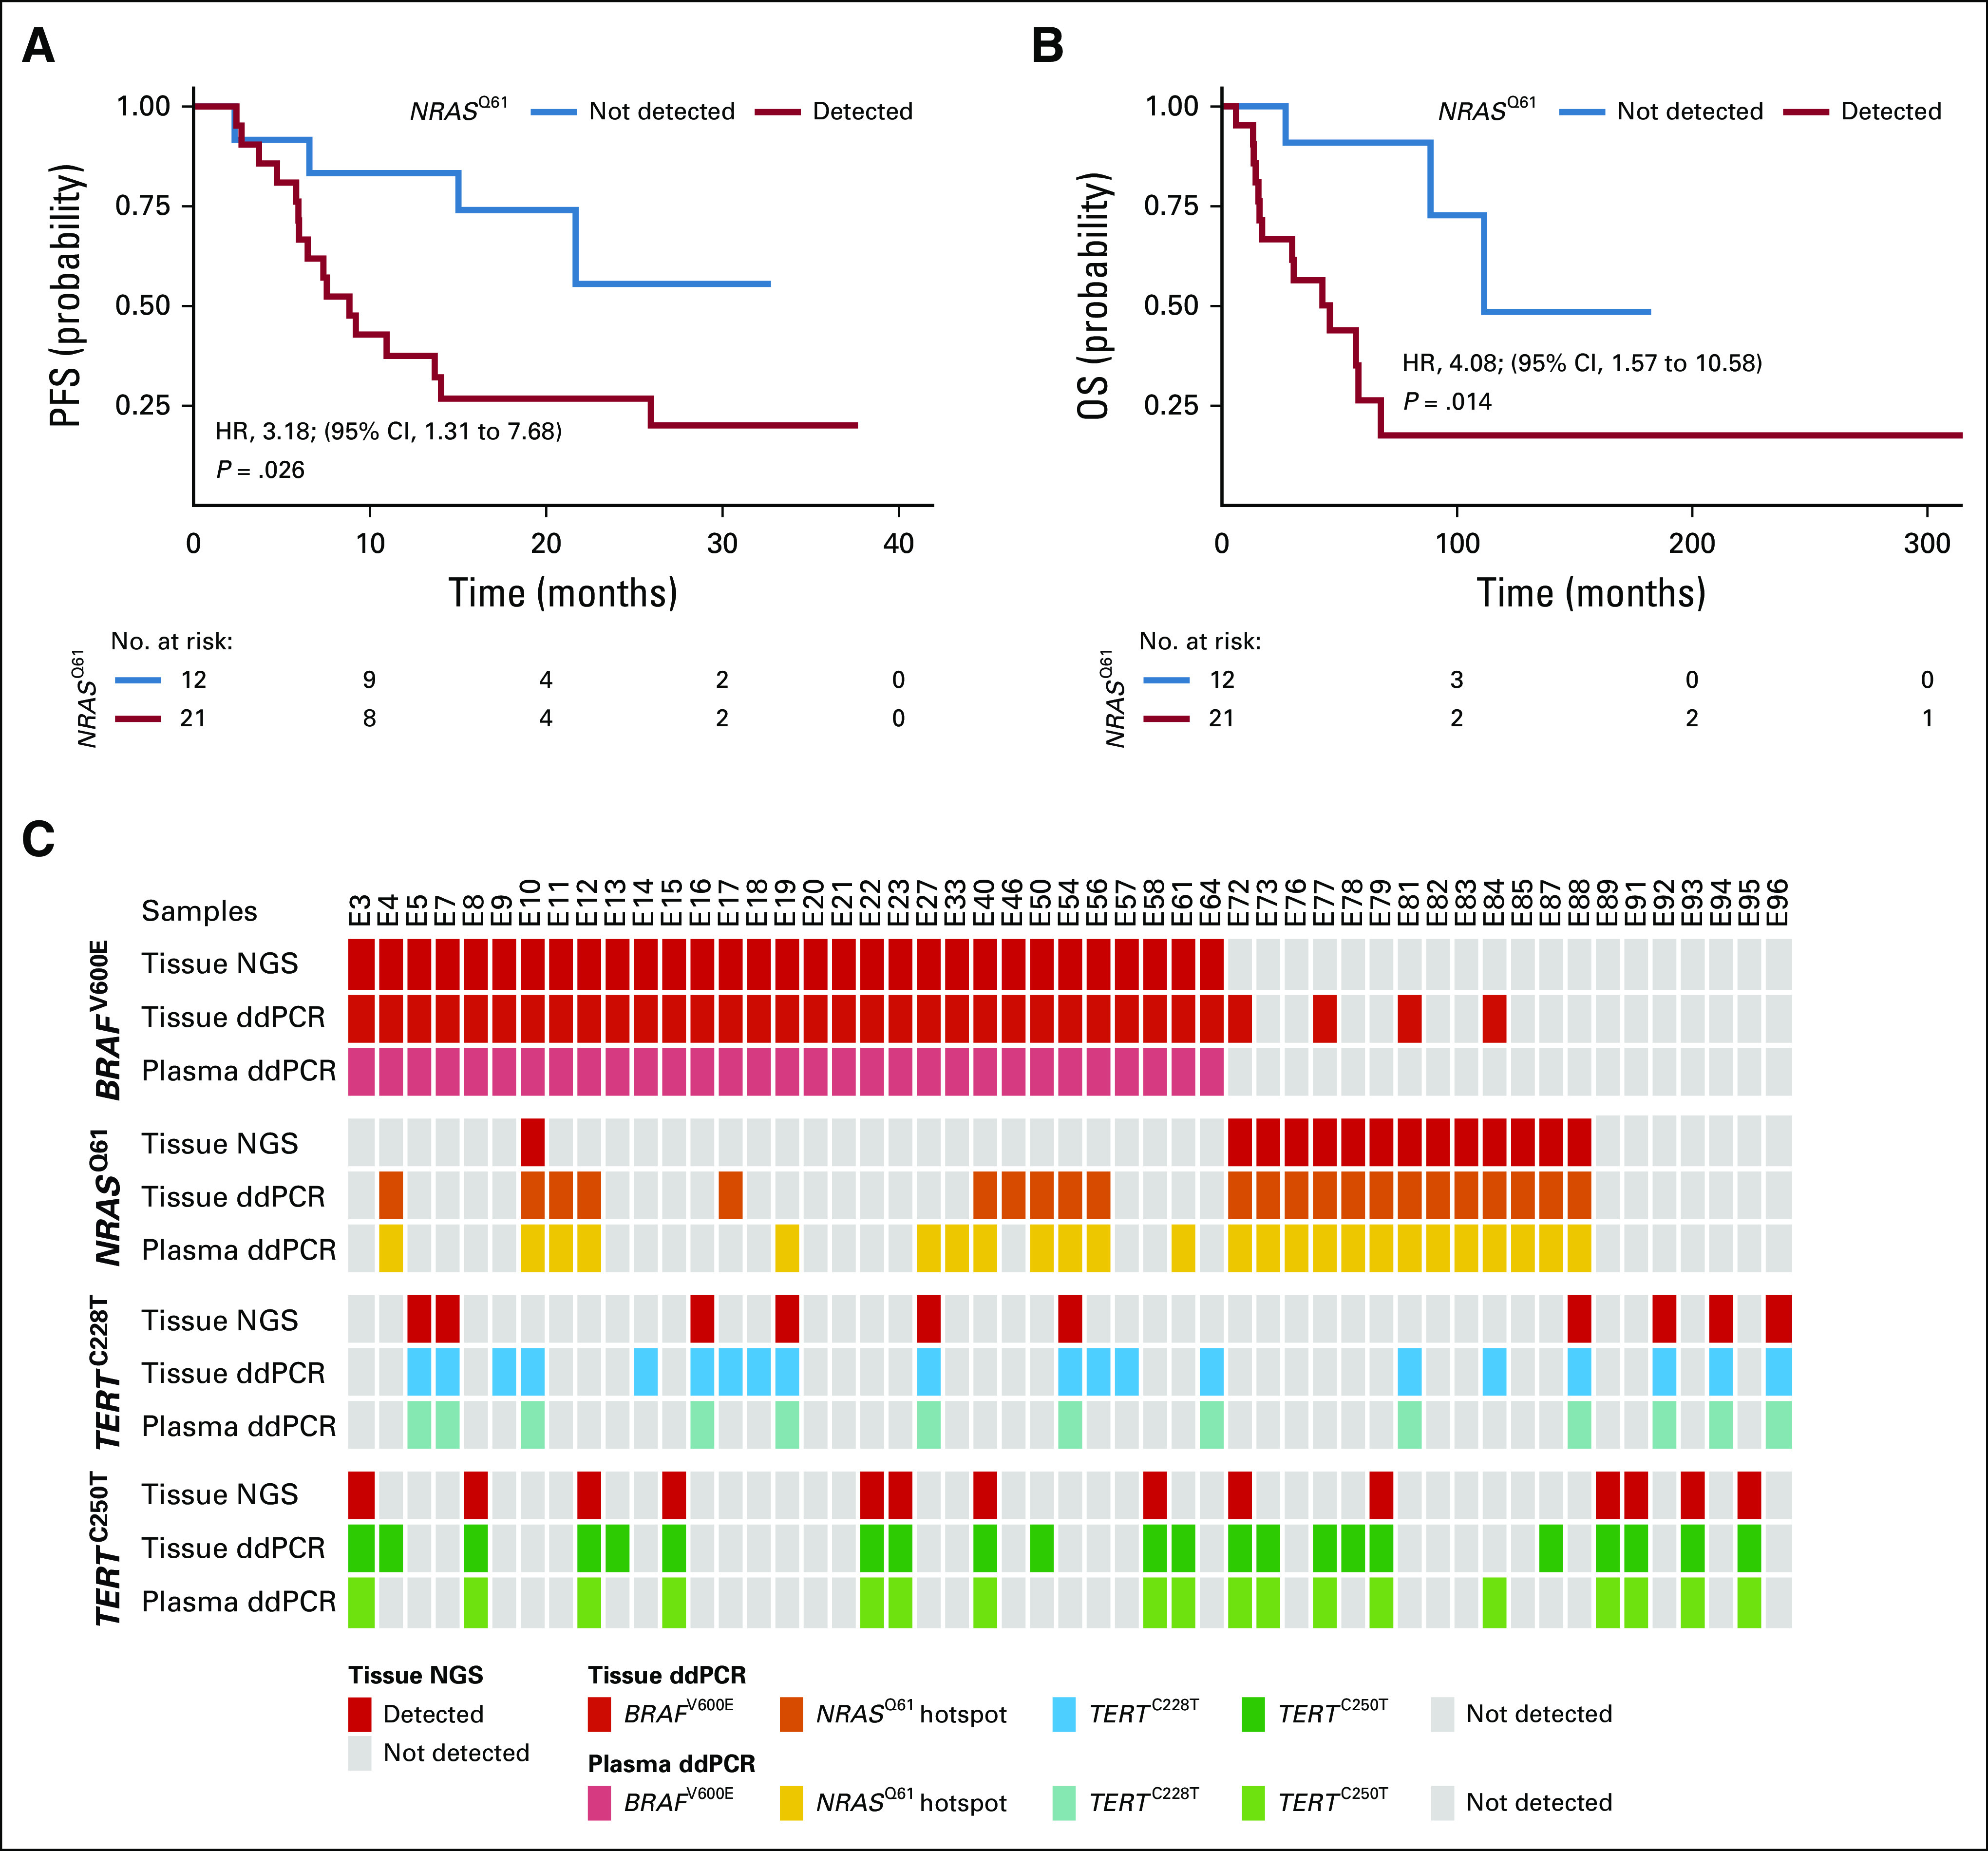
Results: Elevated plasma ctDNA level at baseline was an independent prognostic factor of disease progression when compared with serum S100 and lactate dehydrogenase levels in multivariable analyses (hazard ratio [HR], 7.43; 95% CI, 1.01 to 55.19; P = .05). The change in ctDNA levels during therapy correlated with treatment response, where increasing ctDNA was predictive for shorter progression-free survival (eg, for BRAF V600E ctDNA, HR, 3.70; 95% CI, 1.86 to 7.34; P < .001). Increasing ctDNA levels predicted disease progression significantly earlier than did routine radiologic scans (P < .05), with a mean lead time of 3.5 months. NRAS-mutant ctDNA was detected in a significant proportion of patients with BRAF-mutant tumors under therapy, but unexpectedly also at baseline. In vitro sensitivity studies suggested that this represents higher-than-expected intratumoral heterogeneity. The detection of NRAS Q61 ctDNA in baseline samples of patients with BRAF V600E mutation who were treated with mitogen-activated protein kinase inhibitors significantly correlated with shorter progression-free survival (HR, 3.18; 95% CI, 1.31 to 7.68; P = .03) and shorter overall survival (HR, 4.08; 95% CI, 1.57 to 10.58; P = .01).

Conclusion: Our results show the potential role of ctDNA measurement as a sensitive monitoring and prediction tool for the early assessment of disease progression and therapeutic response in patients with metastatic melanoma.


Conflict of interest statement

The following represents disclosure information provided by authors of this manuscript. All relationships are considered compensated. Relationships are self-held unless noted. I = Immediate Family Member, Inst = My Institution. Relationships may not relate to the subject matter of this manuscript. For more information about ASCO's conflict of interest policy, please refer to www.asco.org/rwc or ascopubs.org/po/author-center. Teofila SeremetEmployment: Janssen (I), GlaxoSmithKline (I) Honoraria: Novartis, Janssen Consulting or Advisory Role: Novartis Speakers' Bureau: Novartis Travel, Accommodations, Expenses: Novartis, MSD Oncology, Janssen, LEO PharmaKlaus GriewankPatents, Royalties, Other Intellectual Property: Exon 4 mutations in GNAQ and GNA11, a rare gene mutation in melanoma. I receive annual payments. Travel, Accommodations, Expenses: RocheJan-Malte PlackeTravel, Accommodations, Expenses: Bristol-Myers SquibbPeter A. HornStock and Other Ownership Interests: share certificates (Aktien) of different companies Patents, Royalties, Other Intellectual Property: Patent applicationsJürgen BeckerConsulting or Advisory Role: Merck Serono, Amgen, eTheRNA, Sanofi/Regeneron Speakers' Bureau: Amgen, Merck Serono, Novartis, Sanofi/Regeneron, Merck Serono (Inst), Alcedis (Inst), IQvia (Inst), Amgen (Inst), Bristol-Myers Squibb (Inst) Travel, Accommodations, Expenses: 4SC, Merck SeronoJulia Newton-BishopTravel, Accommodations, Expenses: Unknown mixedBart NeynsHonoraria: Bristol-Myers Squibb, Novartis, Roche, Merck Sharp & Dohme Consulting or Advisory Role: Bristol-Myers Squibb, Novartis, Roche, Merck Sharp & Dohme, Amgen Speakers' Bureau: Novartis Research Funding: Pfizer (Inst), Novartis (Inst), Merck KGaA (Inst) Travel, Accommodations, Expenses: Bristol-Myers Squibb, Novartis, Roche, Merck Sharp & Dohme, AmgenBenjamin WeideHonoraria: Roche, MSD, Bristol-Myers Squibb Consulting or Advisory Role: CureVac, Philogen Research Funding: Bristol-Myers Squibb (Inst), MSD (Inst), Philogen (Inst)Dirk SchadendorfHonoraria: Roche, Novartis, Amgen, Bristol-Myers Squibb, Merck Sharp & Dohme, Sysmex, Immunocore, Grünenthal Group, Merck Serono, Agenus, Array BioPharma, AstraZeneca, LEO Pharma, Incyte, Pfizer, Pierre Fabre, Philogen, Regeneron, 4SC, Mologen Consulting or Advisory Role: Roche, Novartis, Bristol-Myers Squibb, Merck Sharp & Dohme, Merck Serono, Amgen, Immunocore, Incyte, 4SC, Pierre Fabre, Mologen, Sanofi/Regeneron Speakers' Bureau: Roche, Bristol-Myers Squibb, Merck Sharp & Dohme, Novartis, Amgen, Incyte, Pierre Fabre Research Funding: Bristol-Myers Squibb (Inst), Novartis (Inst) Travel, Accommodations, Expenses: Roche, Bristol-Myers Squibb, Amgen, Merck, Merck Serono, NovartisAlexander RoeschHonoraria: Novartis Consulting or Advisory Role: Novartis Research Funding: Bristol-Myers Squibb, Novartis (Inst), Adtec (Inst) No other potential conflicts of interest were reported.

Figures

FIG 1.
FIG 1.
Basic characteristics of patients with melanoma who have BRAFV600E, NRASQ61, and TERTprom mutations. Overview of (A) the training cohort (n = 96 patients with stage III and IV disease) and (B) the validation cohort (n = 35 patients with stage III and IV disease). In the upper panels, the demographic and tumor characteristics are represented. The middle panels show mutations detected by DNA sequencing in respective tumor samples. The lower panels correspond to respective plasma samples analyzed with droplet digital polymerase chain reaction. Radiologic tumor-load information at baseline is represented at the bottom of the panels. See also the Data Supplement. AJCC, American Joint Committee on Cancer; ID, identification; TL, tumor load.
FIG 2.
FIG 2.
Correlation of baseline circulating cell-free tumor DNA (ctDNA) levels with metastatic stage and routine serum markers in the training cohort. Correlation of baseline BRAFV600E ctDNA levels with increasing metastatic tumor load in (A) lymph nodes (N1, n = 3; N2, n = 3; and N3, n = 14) and (B) organs (M1a, n = 5; M1b, n = 5; M1c, n = 41). (C) Correlation of NRASQ61 ctDNA levels with organ metastasis (M1a, n = 3; M1b, n = 2; M1c, n = 11). (D) Correlation of mutant TERTprom ctDNA levels with metastatic progression from locoregional (stage IIIB, n = 2; or IIIC, n = 6) to systemic disease (stage IV; n = 14) in patients with TERTprom-mutated melanomas. (E) Correlation of baseline serum lactate dehydrogenase (LDH) and S100 levels with metastatic progression in BRAFV600E-positive patients (gray line, upper limit of normal). Box-and-whisker plots represent median values and interquartile range. Blue dots represent mean values. Welch t test was used to calculate statistical significance. (F-K) Correlation of serum LDH and S100 levels with BRAFV600E (n = 274 and n = 216, respectively), NRASQ61 (n = 97 and n = 67, respectively), and mutant TERTprom (n = 152 and n = 124, respectively) ctDNA levels in the training cohort. Sample pairs were analyzed for the Spearman correlation coefficient (ρ). The upper limit of normal (gray line) for LDH is 247 IU/L and for S100 is 0.15 µg/L. AJCC, American Joint Committee on Cancer.
FIG 3.
FIG 3.
Changes in the BRAFV600E circulating cell-free tumor DNA (ctDNA) levels correlate with therapy response and progression-free survival (PFS). Changes in mean BRAFV600E ctDNA levels after therapy initiation relative to baseline (BL) in patients who received (A) immune checkpoint inhibition therapy (n = 18 patients) and (B) signaling targeted therapy (n = 33). Follow-up (FU) sampling was performed every 4 to 6 weeks. (*) P < .01, (†) P < .001, and (‡) P < .001 from unpaired t test. The data represent mean ± SEM. Kaplan-Meier plots are for PFS of the same patients with melanoma as assessed by routine radiologic scans. (C) Immune checkpoint inhibition (patients with ctDNA decrease [n = 6] v increase [n = 12]) and (D) signaling targeted therapy (patients with ctDNA decrease [n = 12] v increase [n = 21]). Categorization into decrease versus increase was based on the ctDNA change at the second sampling time point relative to BL. The hazard ration (HR) is indicated for ctDNA increase. The P value was determined by the log-rank test. (E, F) Scatter dot plots of BRAFV600E ctDNA levels of responders versus nonresponders grouped according to (E) radiologic response 10 weeks after receiving any therapy or (F) radiologic PFS at 6 months of therapy (Mann-Whitney U test). Points represent individual patients; median with interquartile range is indicated for each plot. Gray lines indicate ctDNA thresholds as determined by receiver operating characteristic analyses (Data Supplement).
FIG 4.
FIG 4.
Changes of NRASQ61 and TERTprom circulating cell-free tumor DNA (ctDNA) levels correlated with therapy response and progression-free survival (PFS). Changes in mean NRASQ61 and TERTprom ctDNA levels after therapy initiation relative to baseline (BL) in patients who received (A, C) immune checkpoint inhibition therapy, (n = 10 and n = 12, respectively) and (B, D) signaling targeted therapy, (n = 7 and n = 10, respectively). Follow-up (FU) sampling was performed every 4 to 6 weeks. (*) P < .05, (†) P < .01, (‡) P < .001, and (§) P < .001 from unpaired t test. The data are reported as mean ± SEM. Scatter dot plots of (E) NRASQ61 and (F) TERTprom ctDNA levels of patients assessed at week 10 after receiving any therapy, grouped according to radiologic PFS at 6 months (Mann-Whitney U test). Points represent individual patients; median with interquartile range is indicated for each plot. Gray lines indicate ctDNA thresholds as determined by receiver operating characteristic analyses (Data Supplement).
FIG 5.
FIG 5.
Validation cohort and time gain in assessment of disease progression. (A-D) circulating cell-free tumor DNA (ctDNA) dynamics correlated with clinical outcome in the validation cohort. (A) Changes in mean ctDNA levels after therapy initiation relative to baseline (BL) from patients who received immune checkpoint inhibition therapy (n = 35 patients). Follow-up (FU) sampling was performed every 6 weeks. (*) P < .05, (†) P < .01, and (‡) P < .001 from unpaired t test. The data are reported as mean ± SEM. (B) Kaplan-Meier plot for progression-free survival (PFS) of the same patients with melanoma who received immune checkpoint inhibition therapy who were assessed by routine radiologic scans (patients with ctDNA decrease [n = 15] v increase [n = 20]). Categorization into decrease versus increase was based on the ctDNA change at the second sampling time point relative to BL. Hazard ratio (HR) is indicated for ctDNA increase. The P value was determined by the log-rank test. (C-D) Scatter dot plots of BRAFV600E, NRASQ61, and TERTprom ctDNA levels of responders versus nonresponders, grouped according to (C) radiologic response 12 weeks after receiving any therapy or (D) radiologic PFS at 6 months of therapy (Mann-Whitney U test). Points represent individual patients; median with interquartile range is indicated for each data set. ctDNA as an early predictive parameter for therapy response and failure (data from training cohort). (E) Decreasing BRAFV600E ctDNA levels (as compared with the last sampling time point) preceded radiologic detection of response in 12 of 15 responders with an average lead-time window of 1.5 months (range, 0.023 to 3.45 months). Wilcoxon signed-rank test P values are reported. (F) Increasing BRAFV600E ctDNA levels preceded radiologic progression in 31 of 36 nonresponders, with an average lead-time window of 3.5 months (range, 0.23 to 18.86 months). CT, computed tomography; MRI, magnetic resonance imaging; US, ultrasound.
FIG 6.
FIG 6.
Detection of NRASQ61 at baseline (BL) is a predictor of worse clinical outcome in patients treated with mitogen-activated protein kinase (MAPK) inhibitors. Kaplan-Meier plots for (A) radiologic progression-free survival (PFS) and (B) overall survival (OS) of patients with BRAFV600E-positive tumors who received MAPK signaling targeted therapy (n = 21 with positive NRASQ61 detection in BL plasma v n = 12 without detection). Hazard ratio (HR) is reported for circulating cell-free tumor DNA (ctDNA) detected. P values were determined by the log-rank test. (C) Overview of 51 BRAFV600E-, NRASQ61-, and TERTprom-matched tumor tissue and plasma samples of patients who had available tumor biopsy specimen at therapy BL. Tumor samples were routinely analyzed for BRAFV600E, NRASQ61, and TERTprom mutations with amplicon-based next-generation sequencing (NGS; Fig. 1) and afterward reanalyzed by ddPCR. Plasma was sampled at BL (ie, before systemic therapy initiation) and analyzed for ctDNAs by droplet digital polymerase chain reaction (ddPCR).

References

    1. de Unamuno Bustos B, Murria Estal R, Pérez Simó G, et al. Towards personalized medicine in melanoma: Implementation of a clinical next-generation sequencing panel. Sci Rep. 2017;7:495. - PMC - PubMed
    1. Wong SQ, Raleigh JM, Callahan J, et al. Circulating tumor DNA analysis and functional imaging provide complementary approaches for comprehensive disease monitoring in metastatic melanoma. JCO Precis Oncol. 2017;1:1–14. - PubMed
    1. Gray ES, Rizos H, Reid AL, et al. Circulating tumor DNA to monitor treatment response and detect acquired resistance in patients with metastatic melanoma. Oncotarget. 2015;6:42008–42018. - PMC - PubMed
    1. Lipson EJ, Velculescu VE, Pritchard TS, et al. Circulating tumor DNA analysis as a real-time method for monitoring tumor burden in melanoma patients undergoing treatment with immune checkpoint blockade. J Immunother Cancer. 2014;2:42. http://www.ncbi.nlm.nih.gov/pubmed/25516806 - PMC - PubMed
    1. Sanmamed MF, Fernández-Landázuri S, Rodríguez C, et al. Quantitative cell-free circulating BRAFV600E mutation analysis by use of droplet digital PCR in the follow-up of patients with melanoma being treated with BRAF inhibitors. Clin Chem. 2015;61:297–304. http://www.ncbi.nlm.nih.gov/pubmed/25411185 - PubMed