. 2020 Sep 22;4(18):4312-4326.
doi: 10.1182/bloodadvances.2020001639.

Amino acid depletion triggered by ʟ-asparaginase sensitizes MM cells to carfilzomib by inducing mitochondria ROS-mediated cell death

Affiliations

Amino acid depletion triggered by ʟ-asparaginase sensitizes MM cells to carfilzomib by inducing mitochondria ROS-mediated cell death

Debora Soncini et al. Blood Adv. .

Abstract

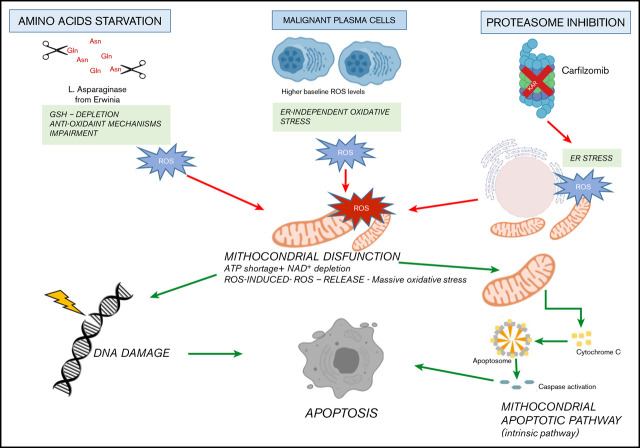
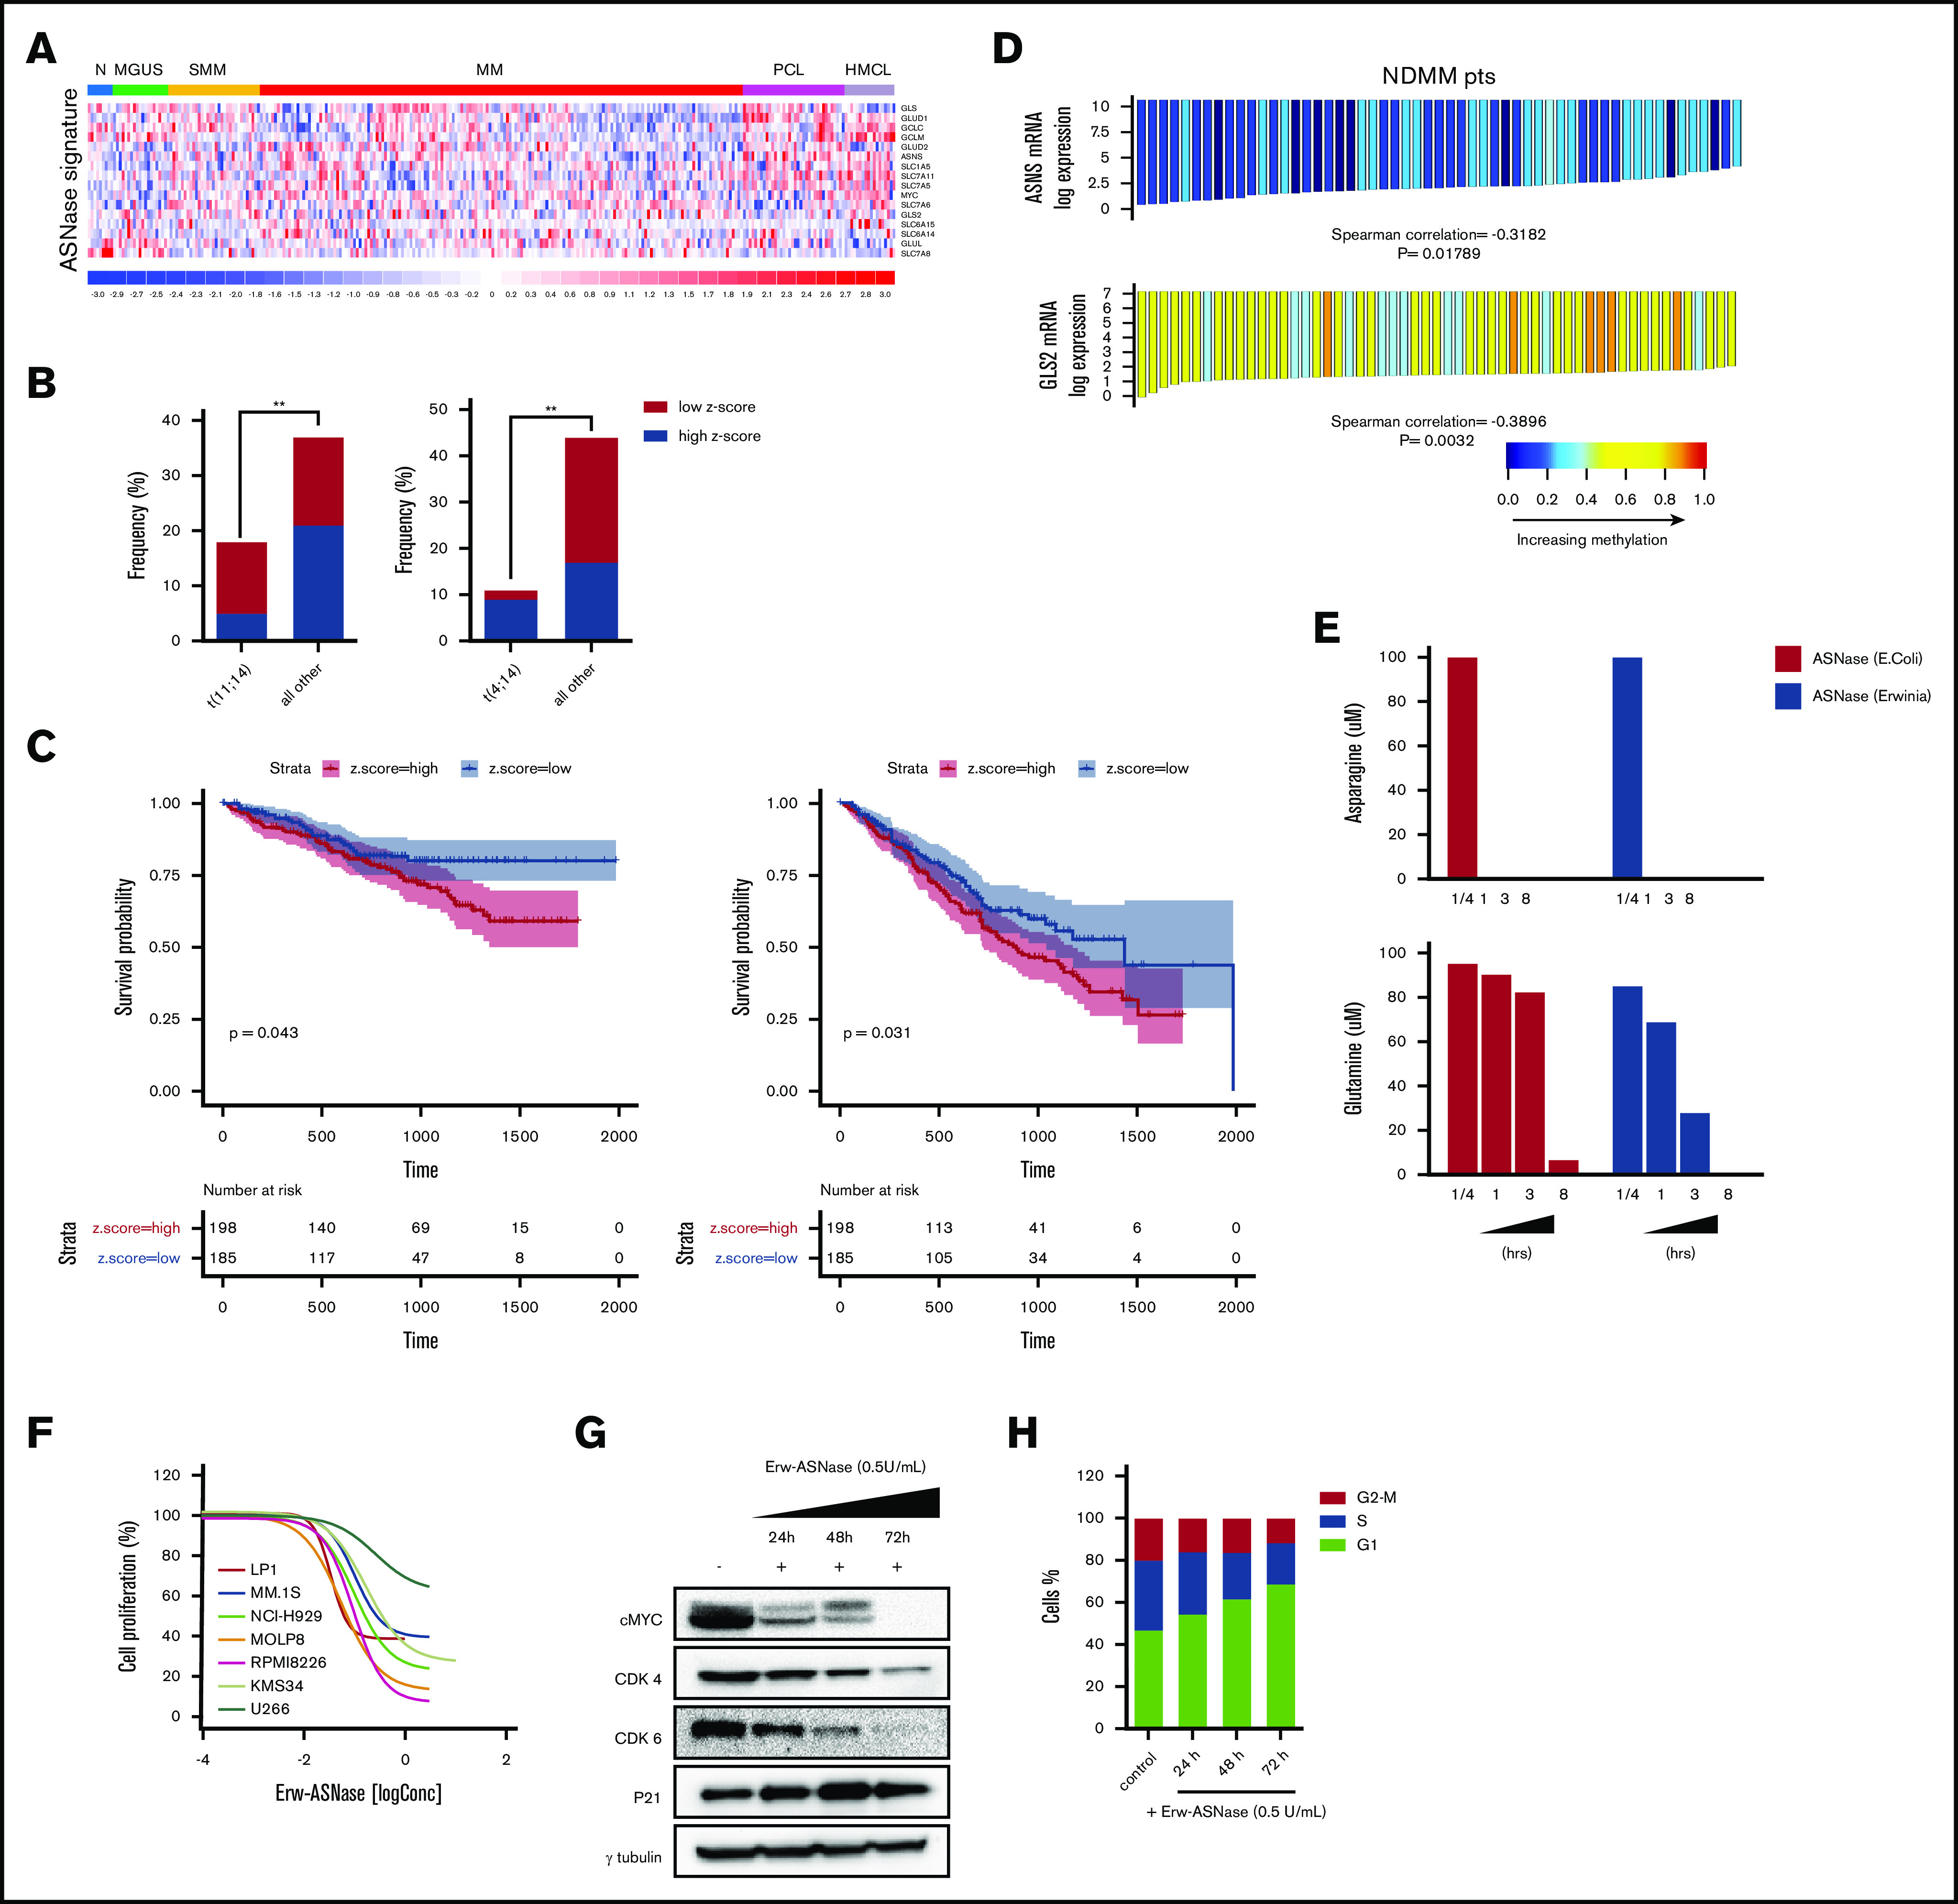
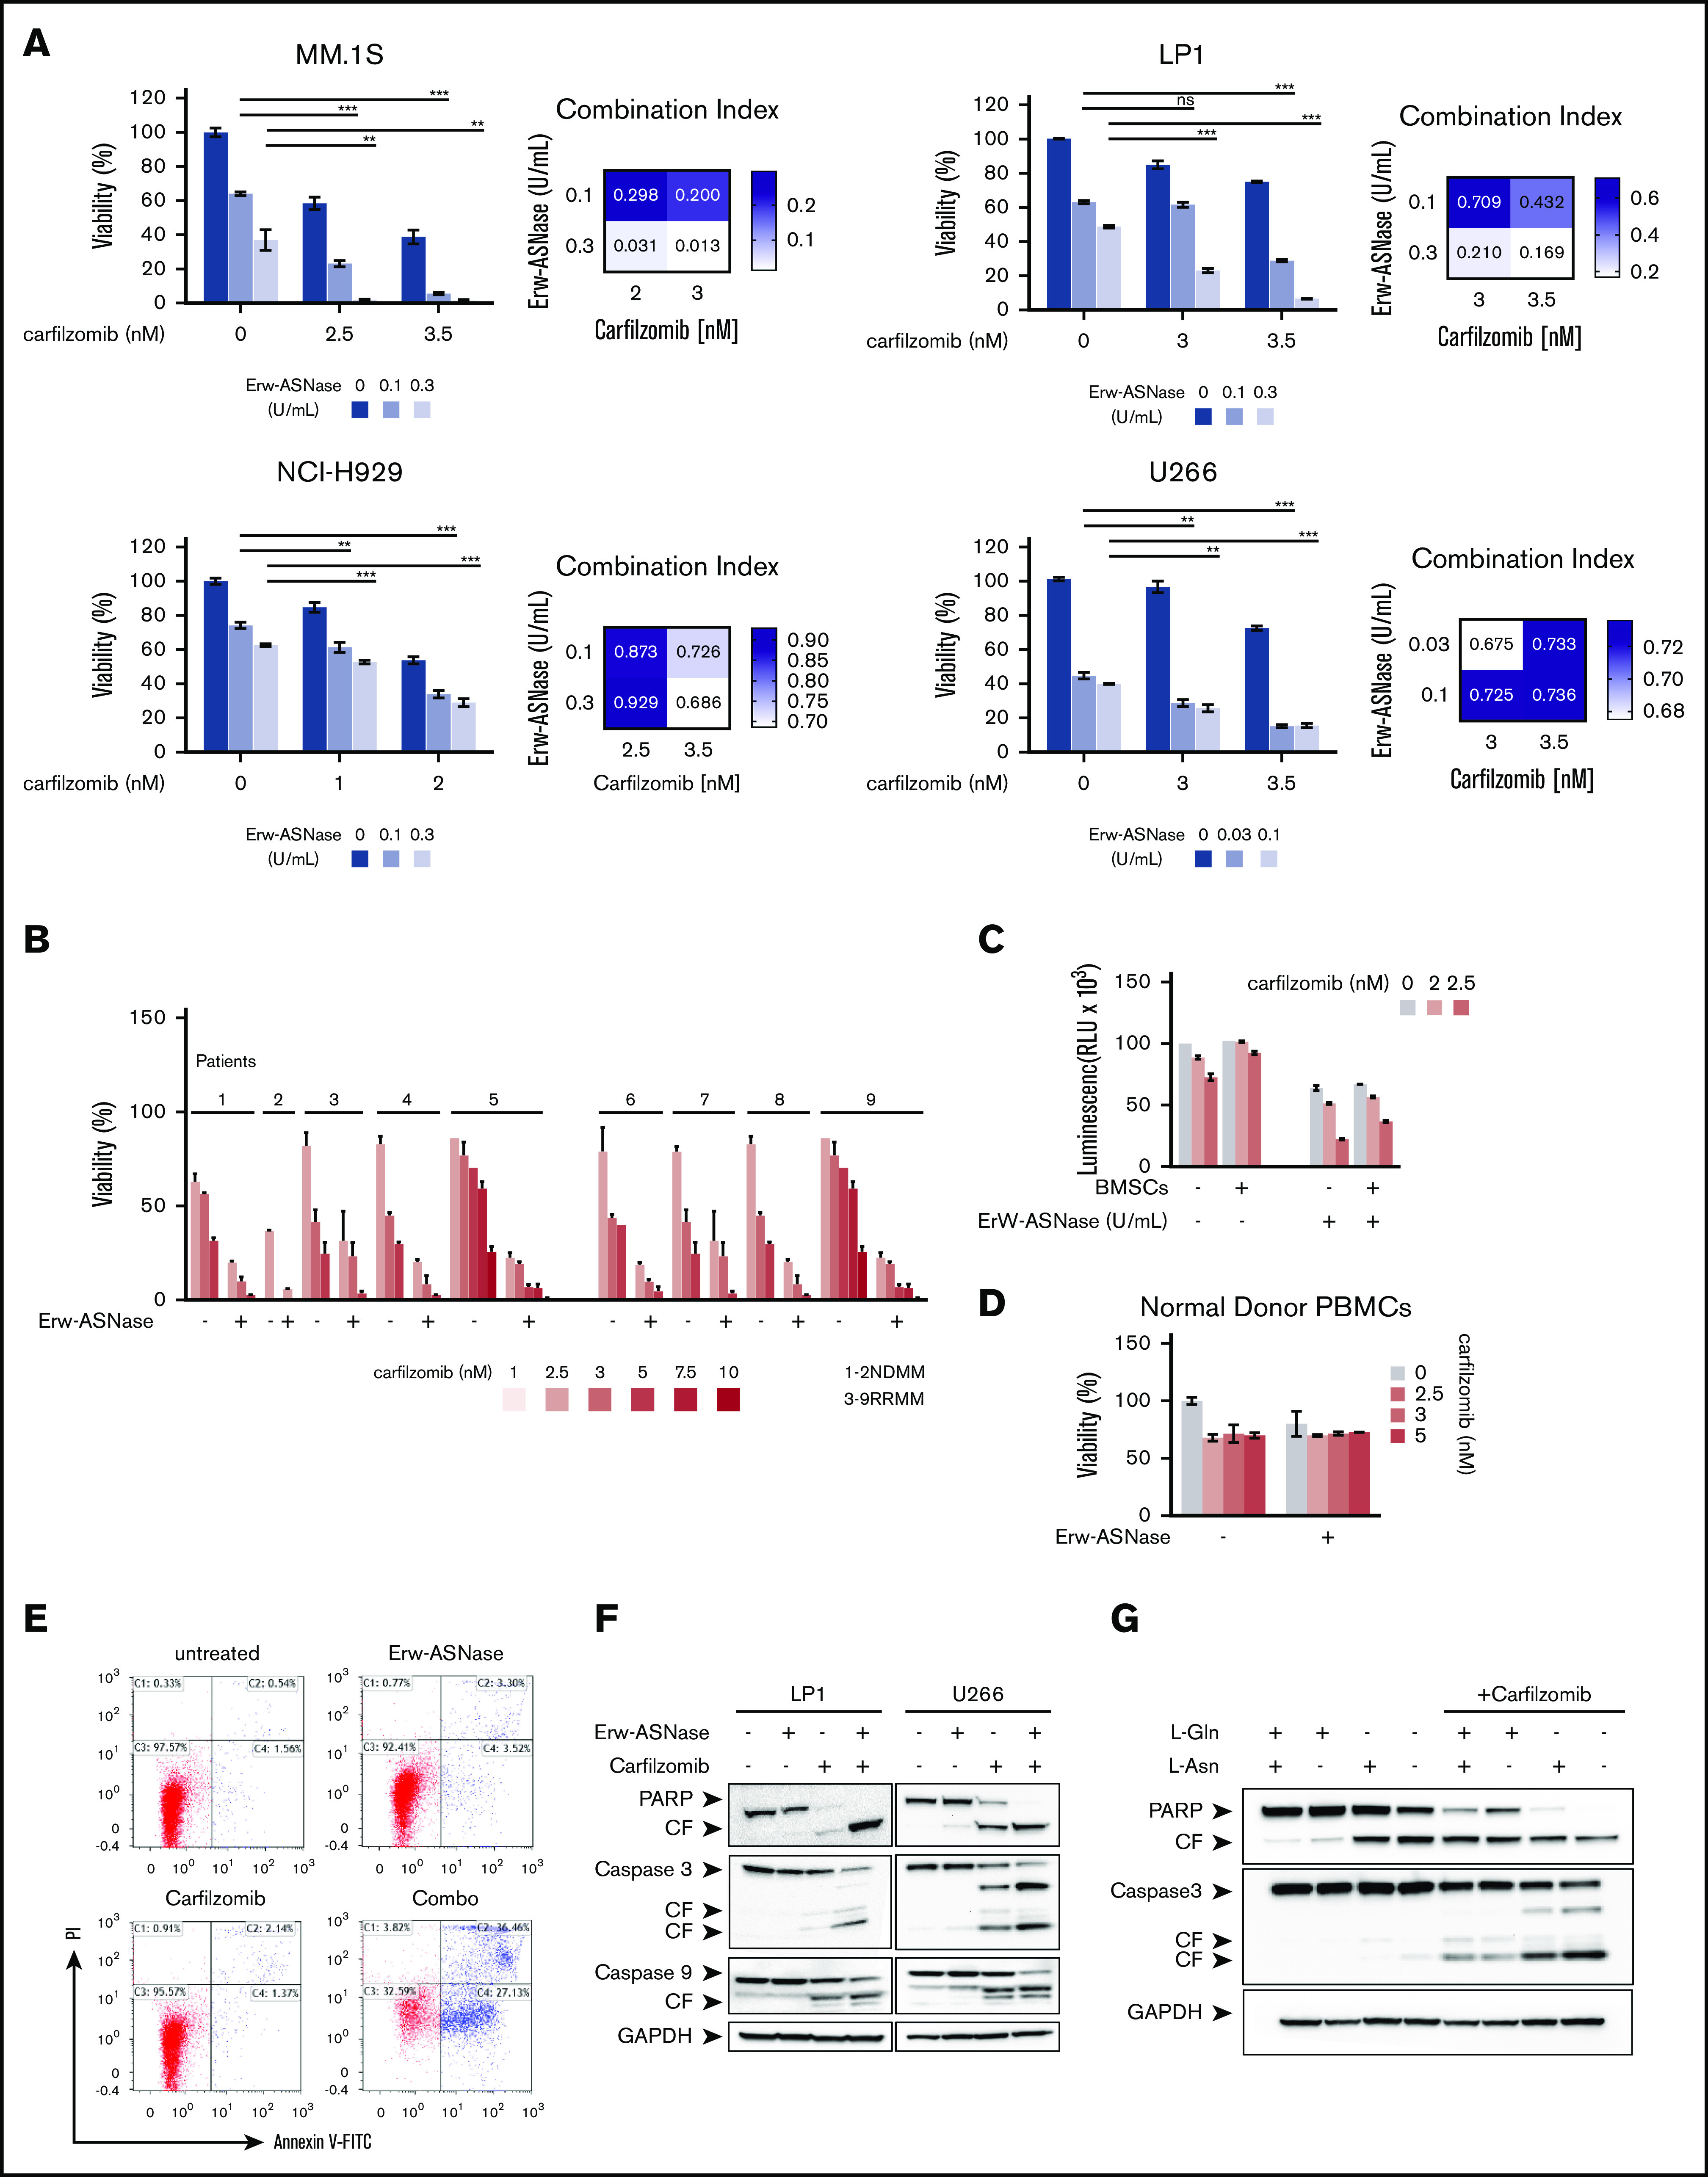
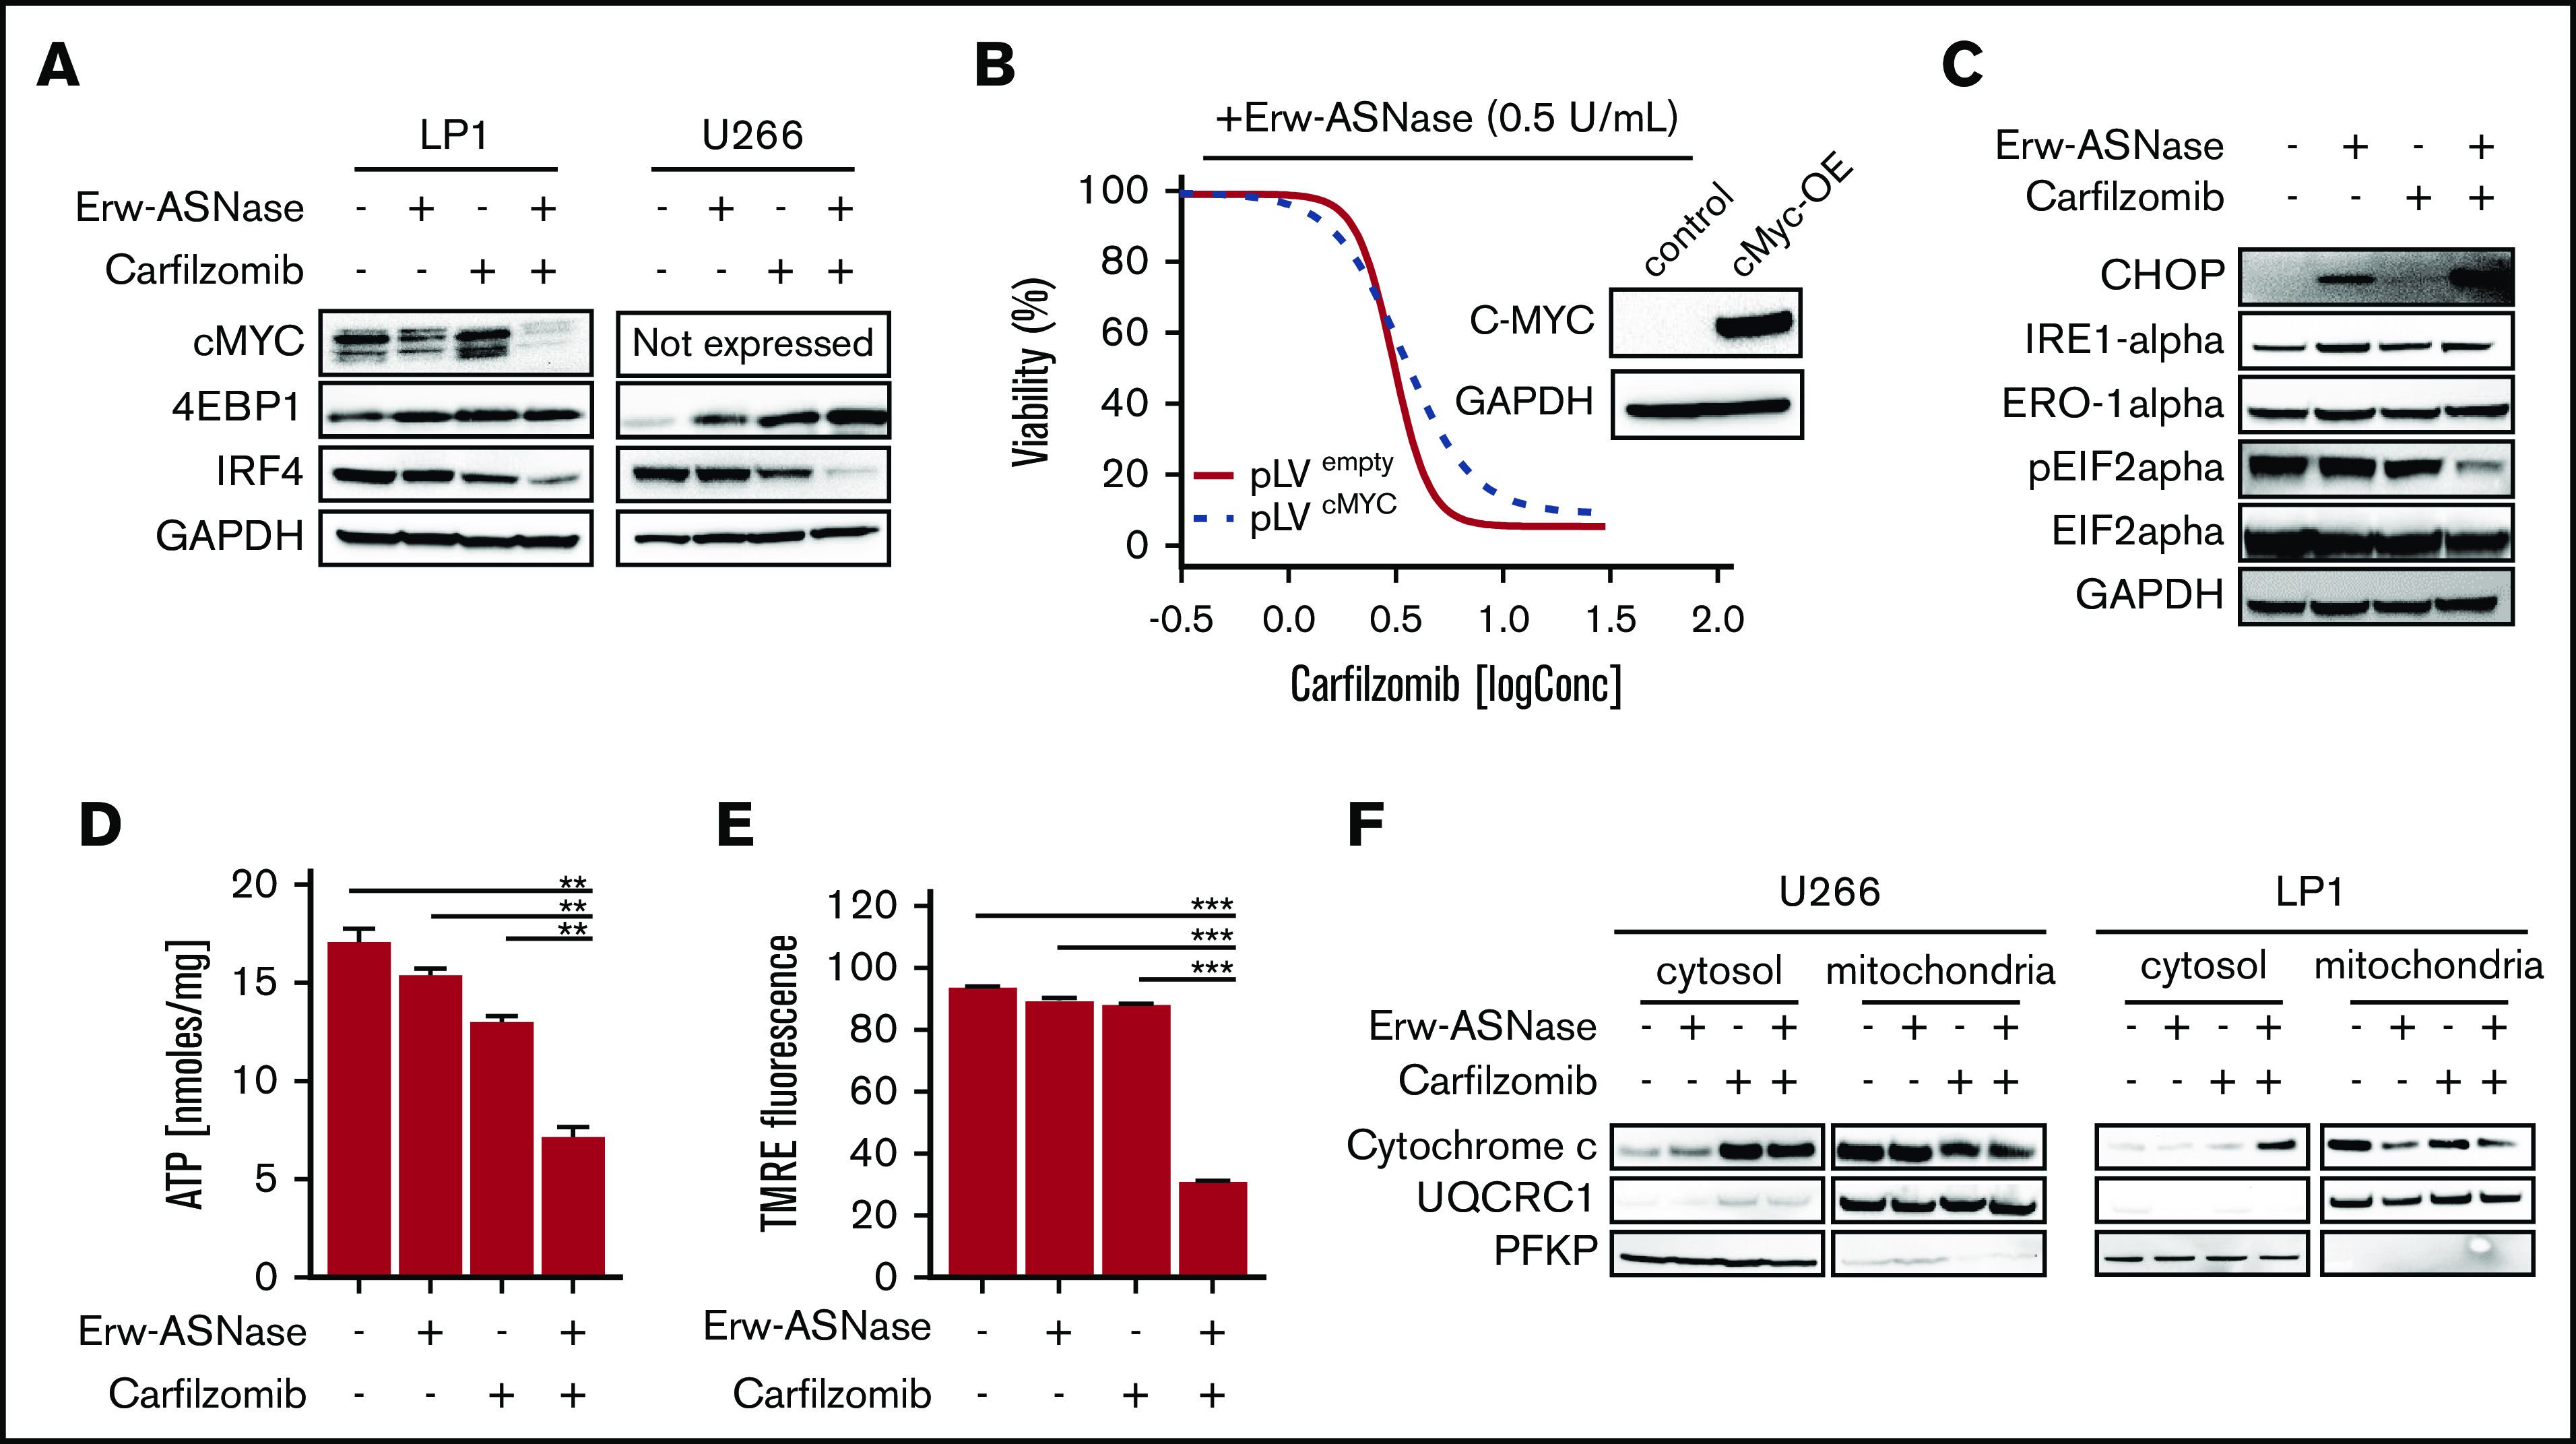
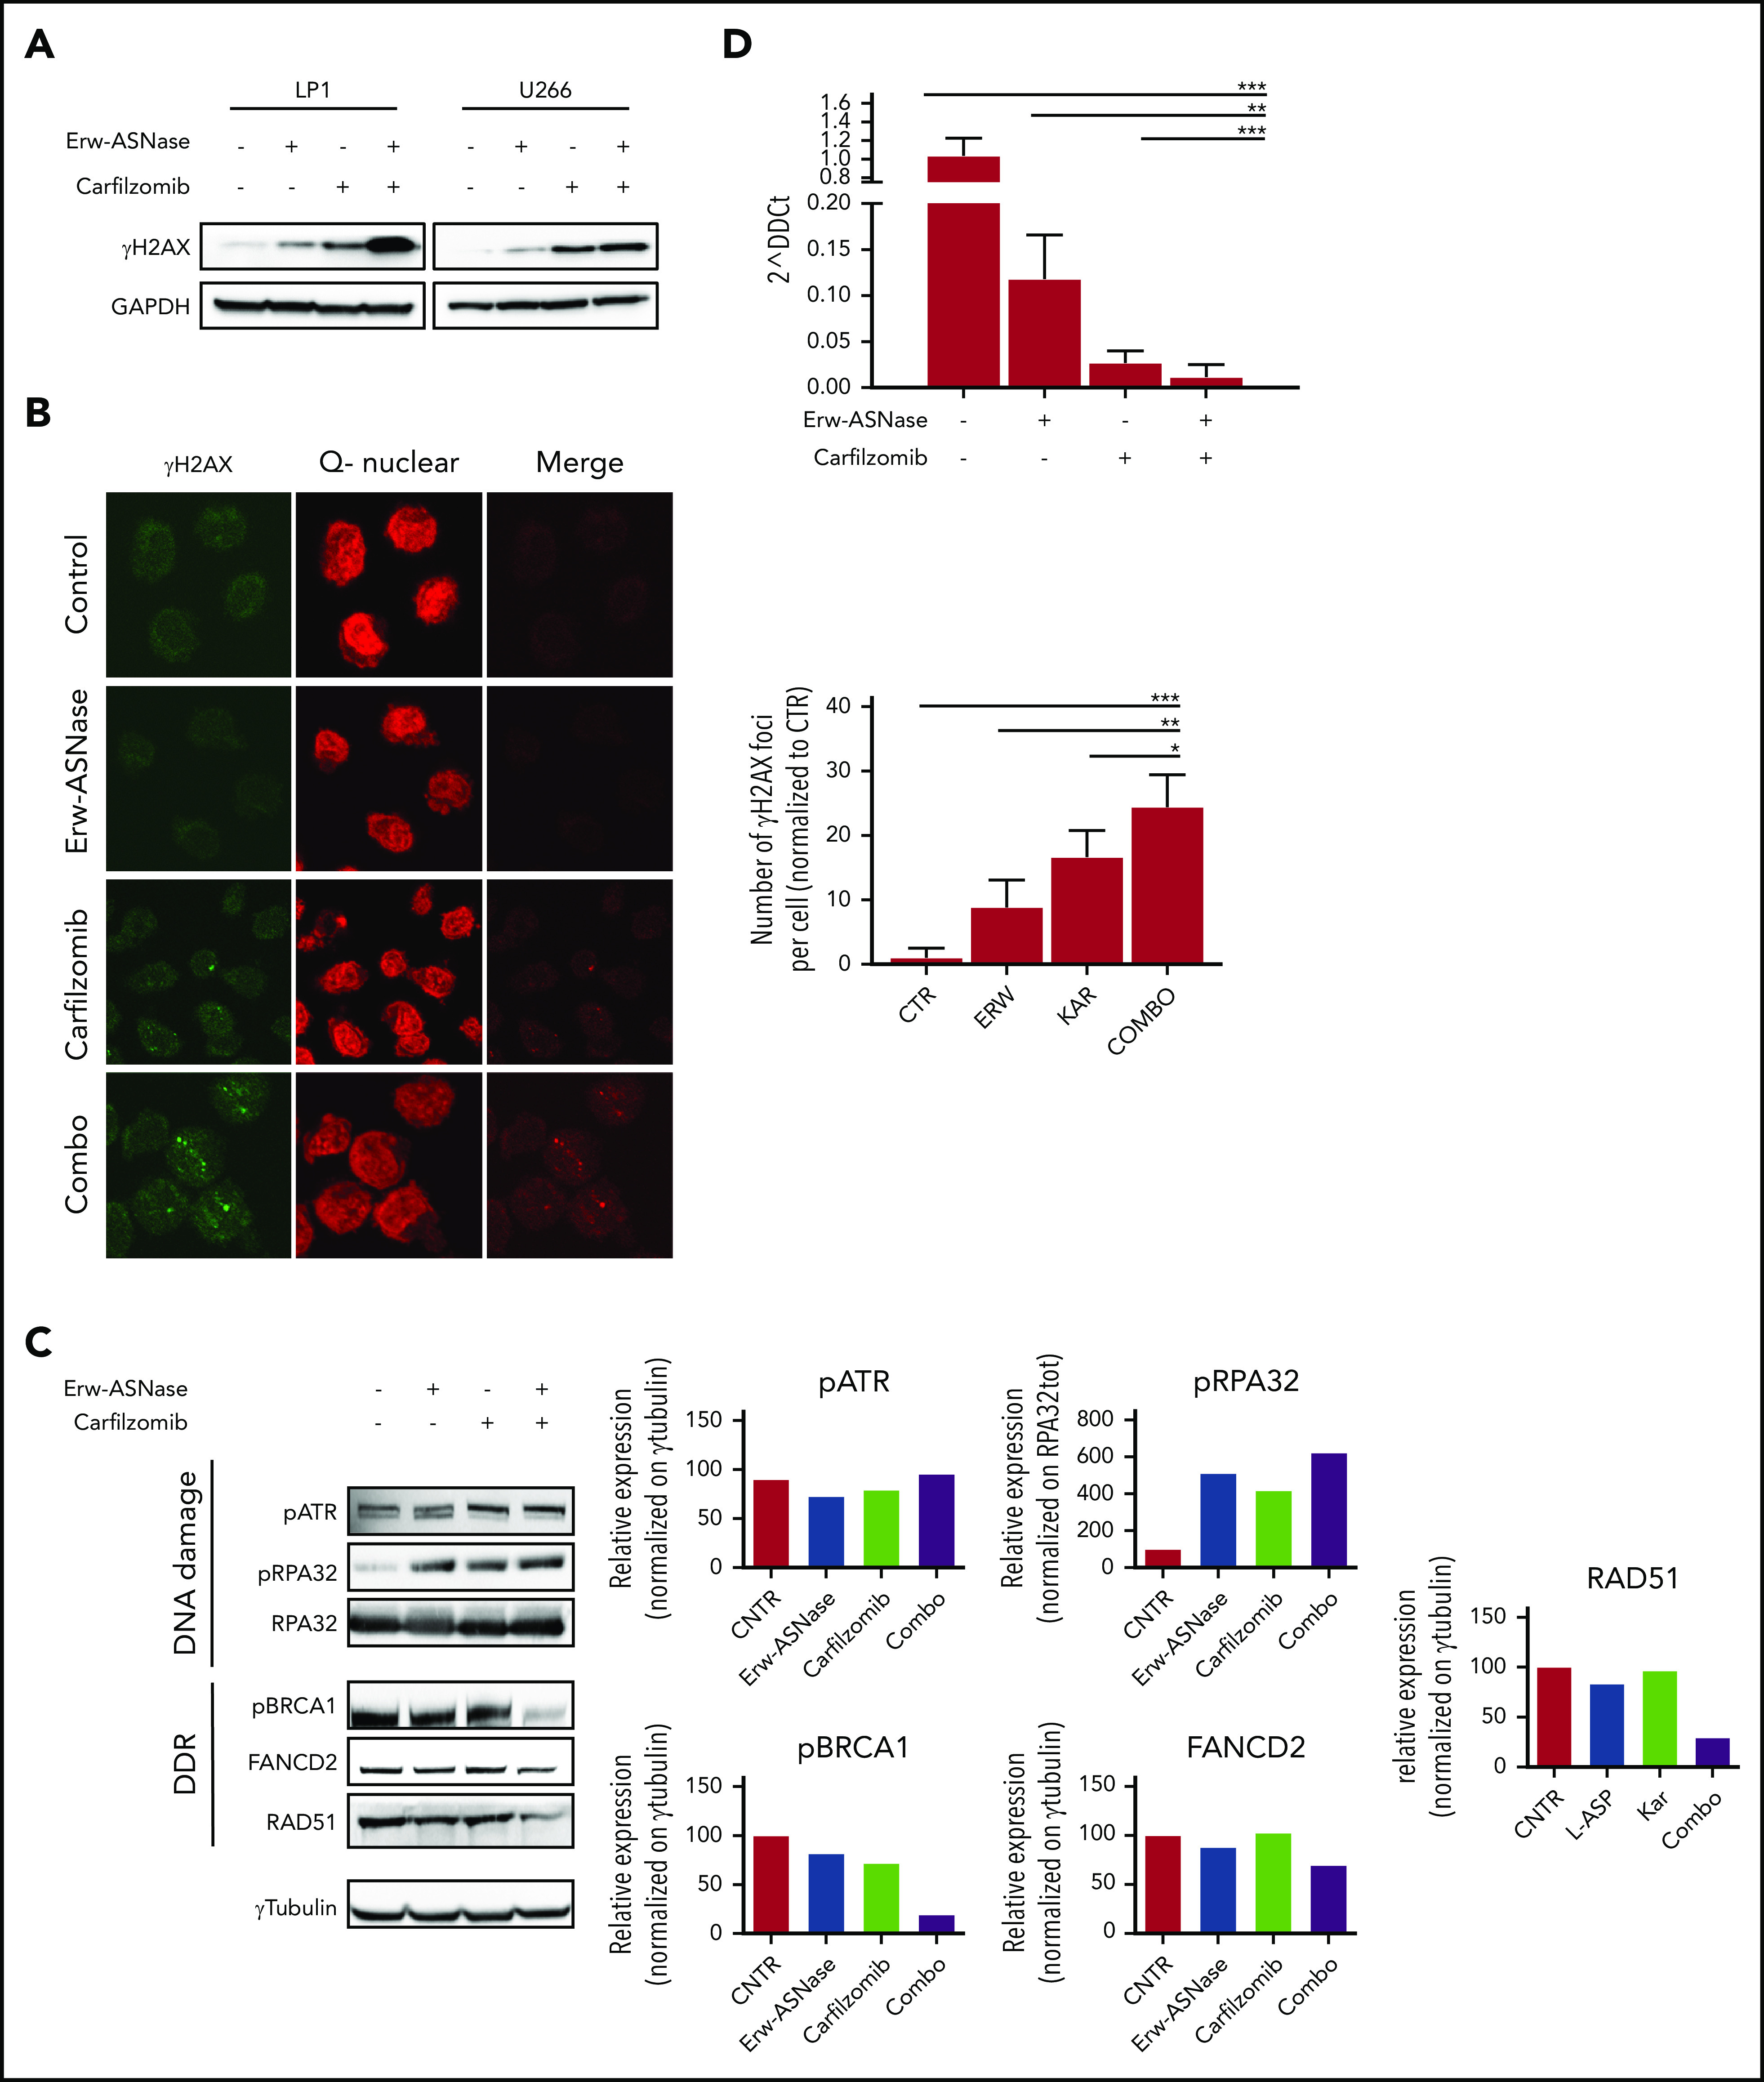
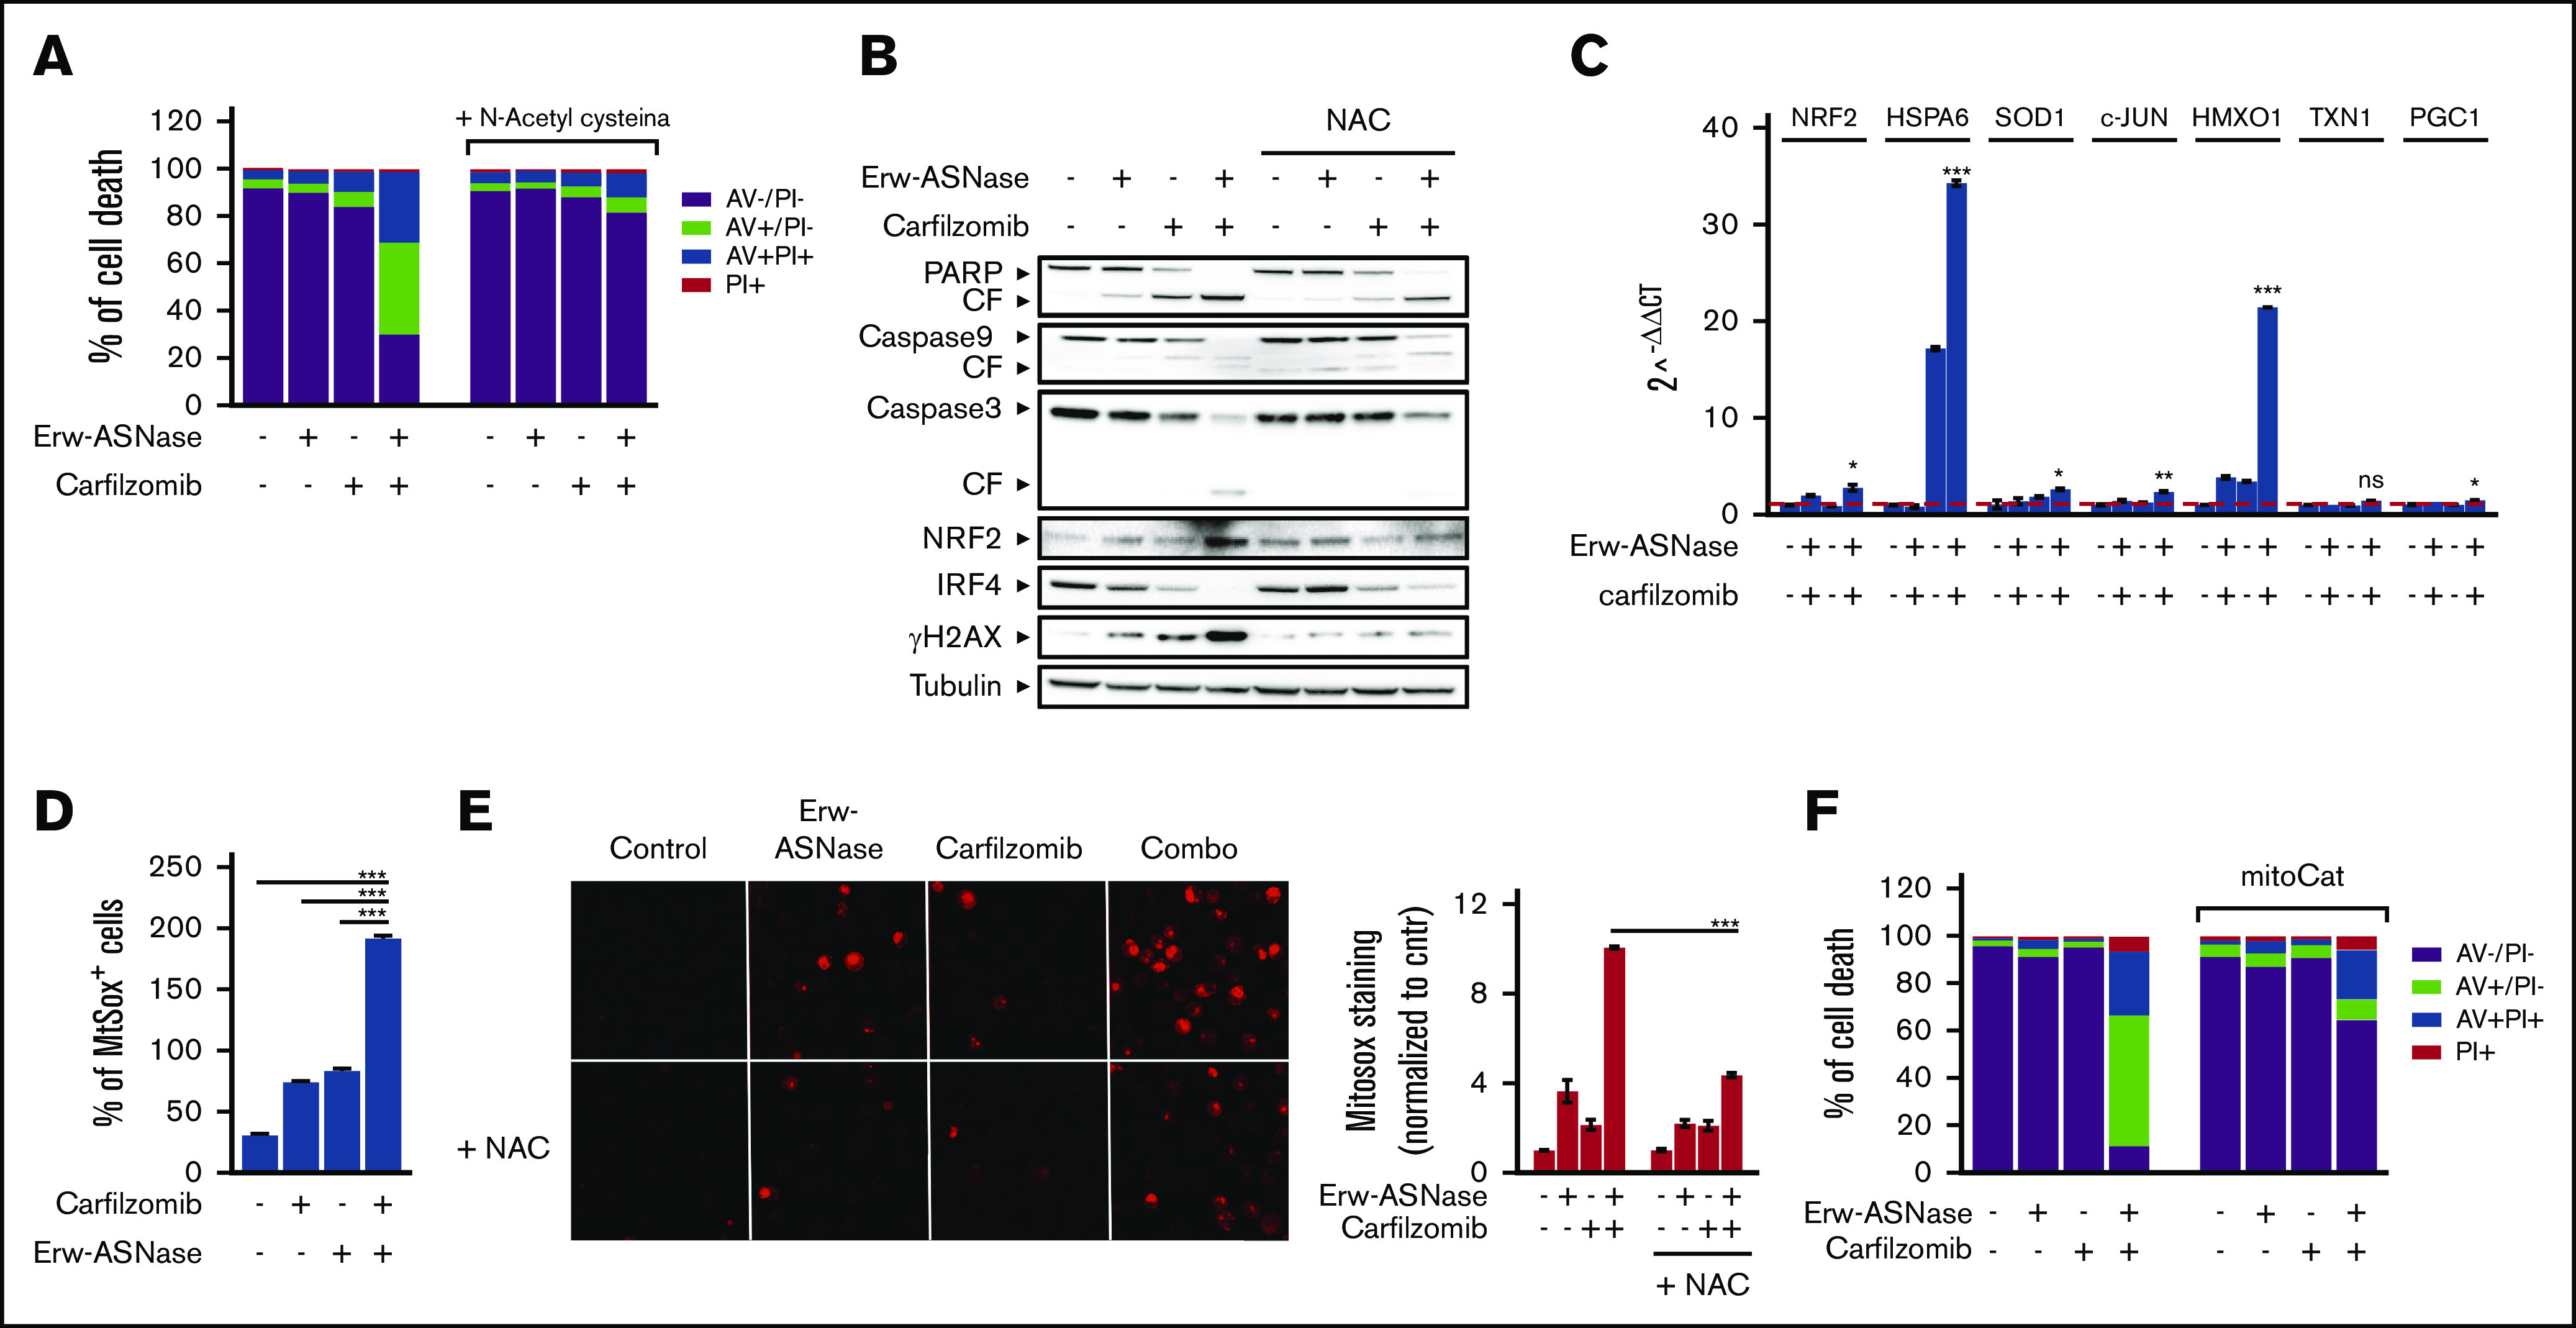
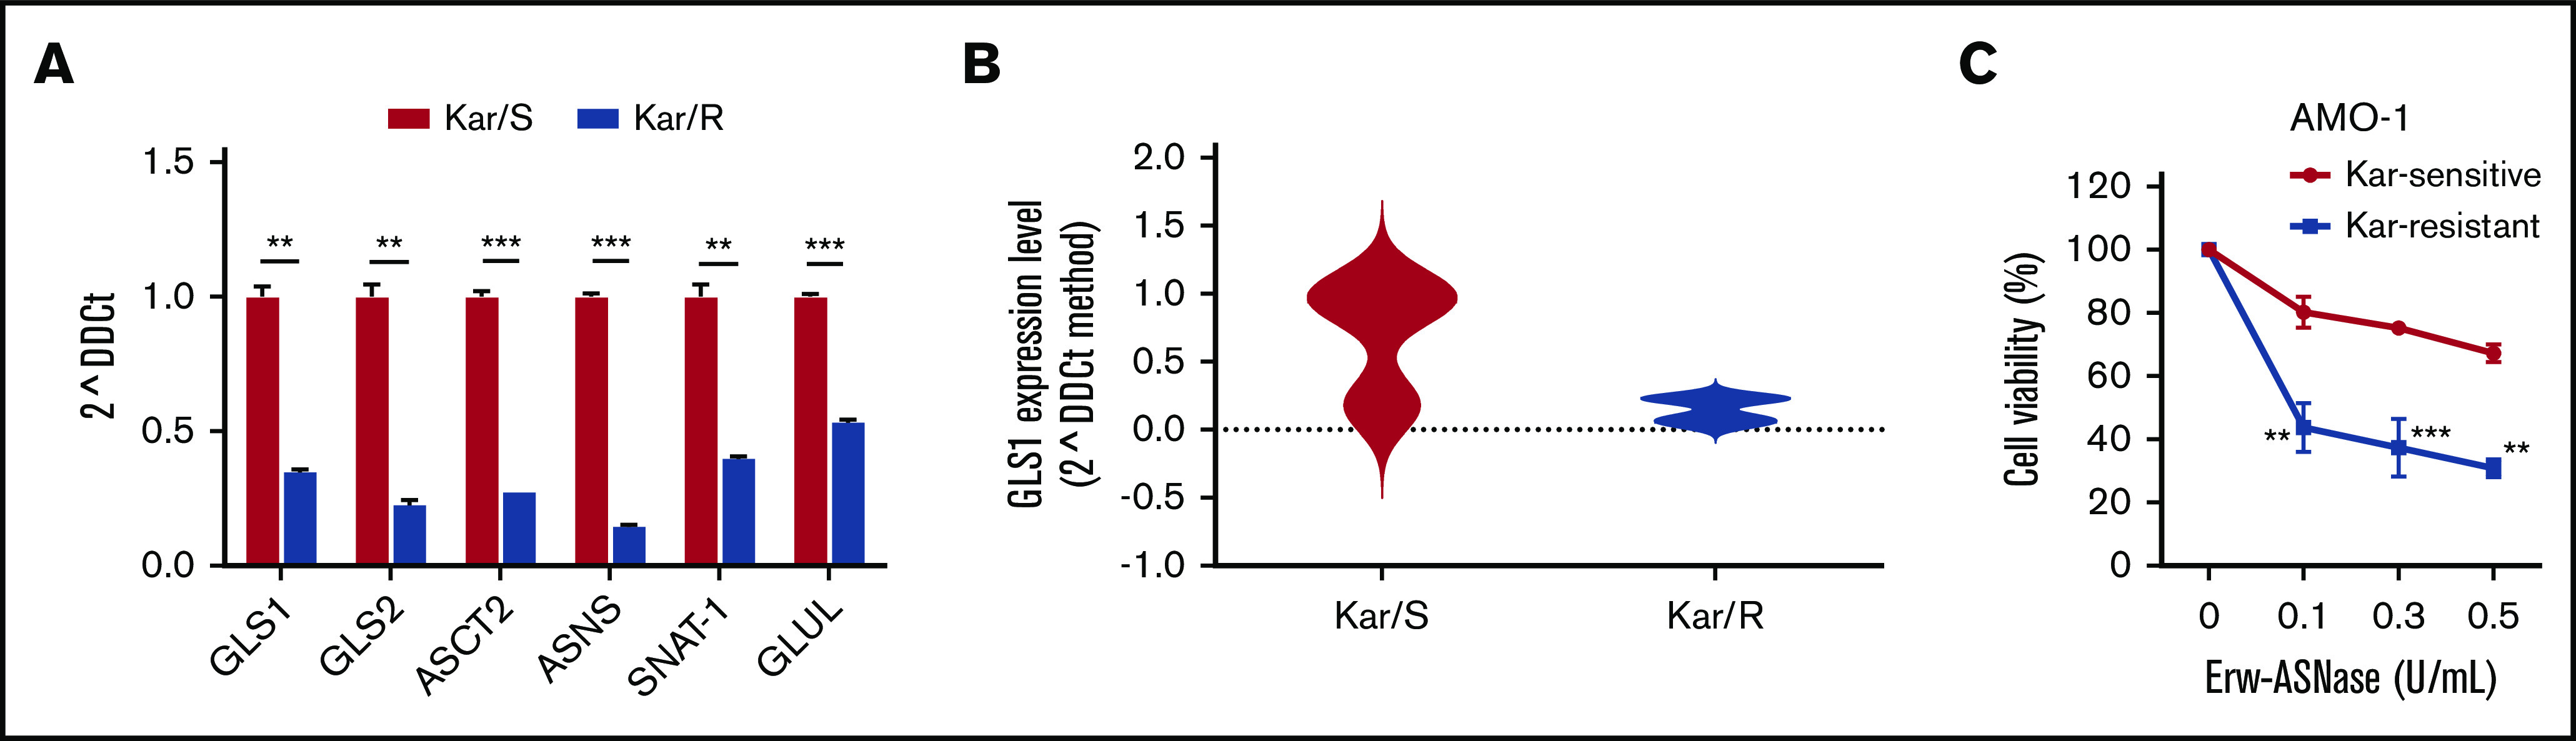
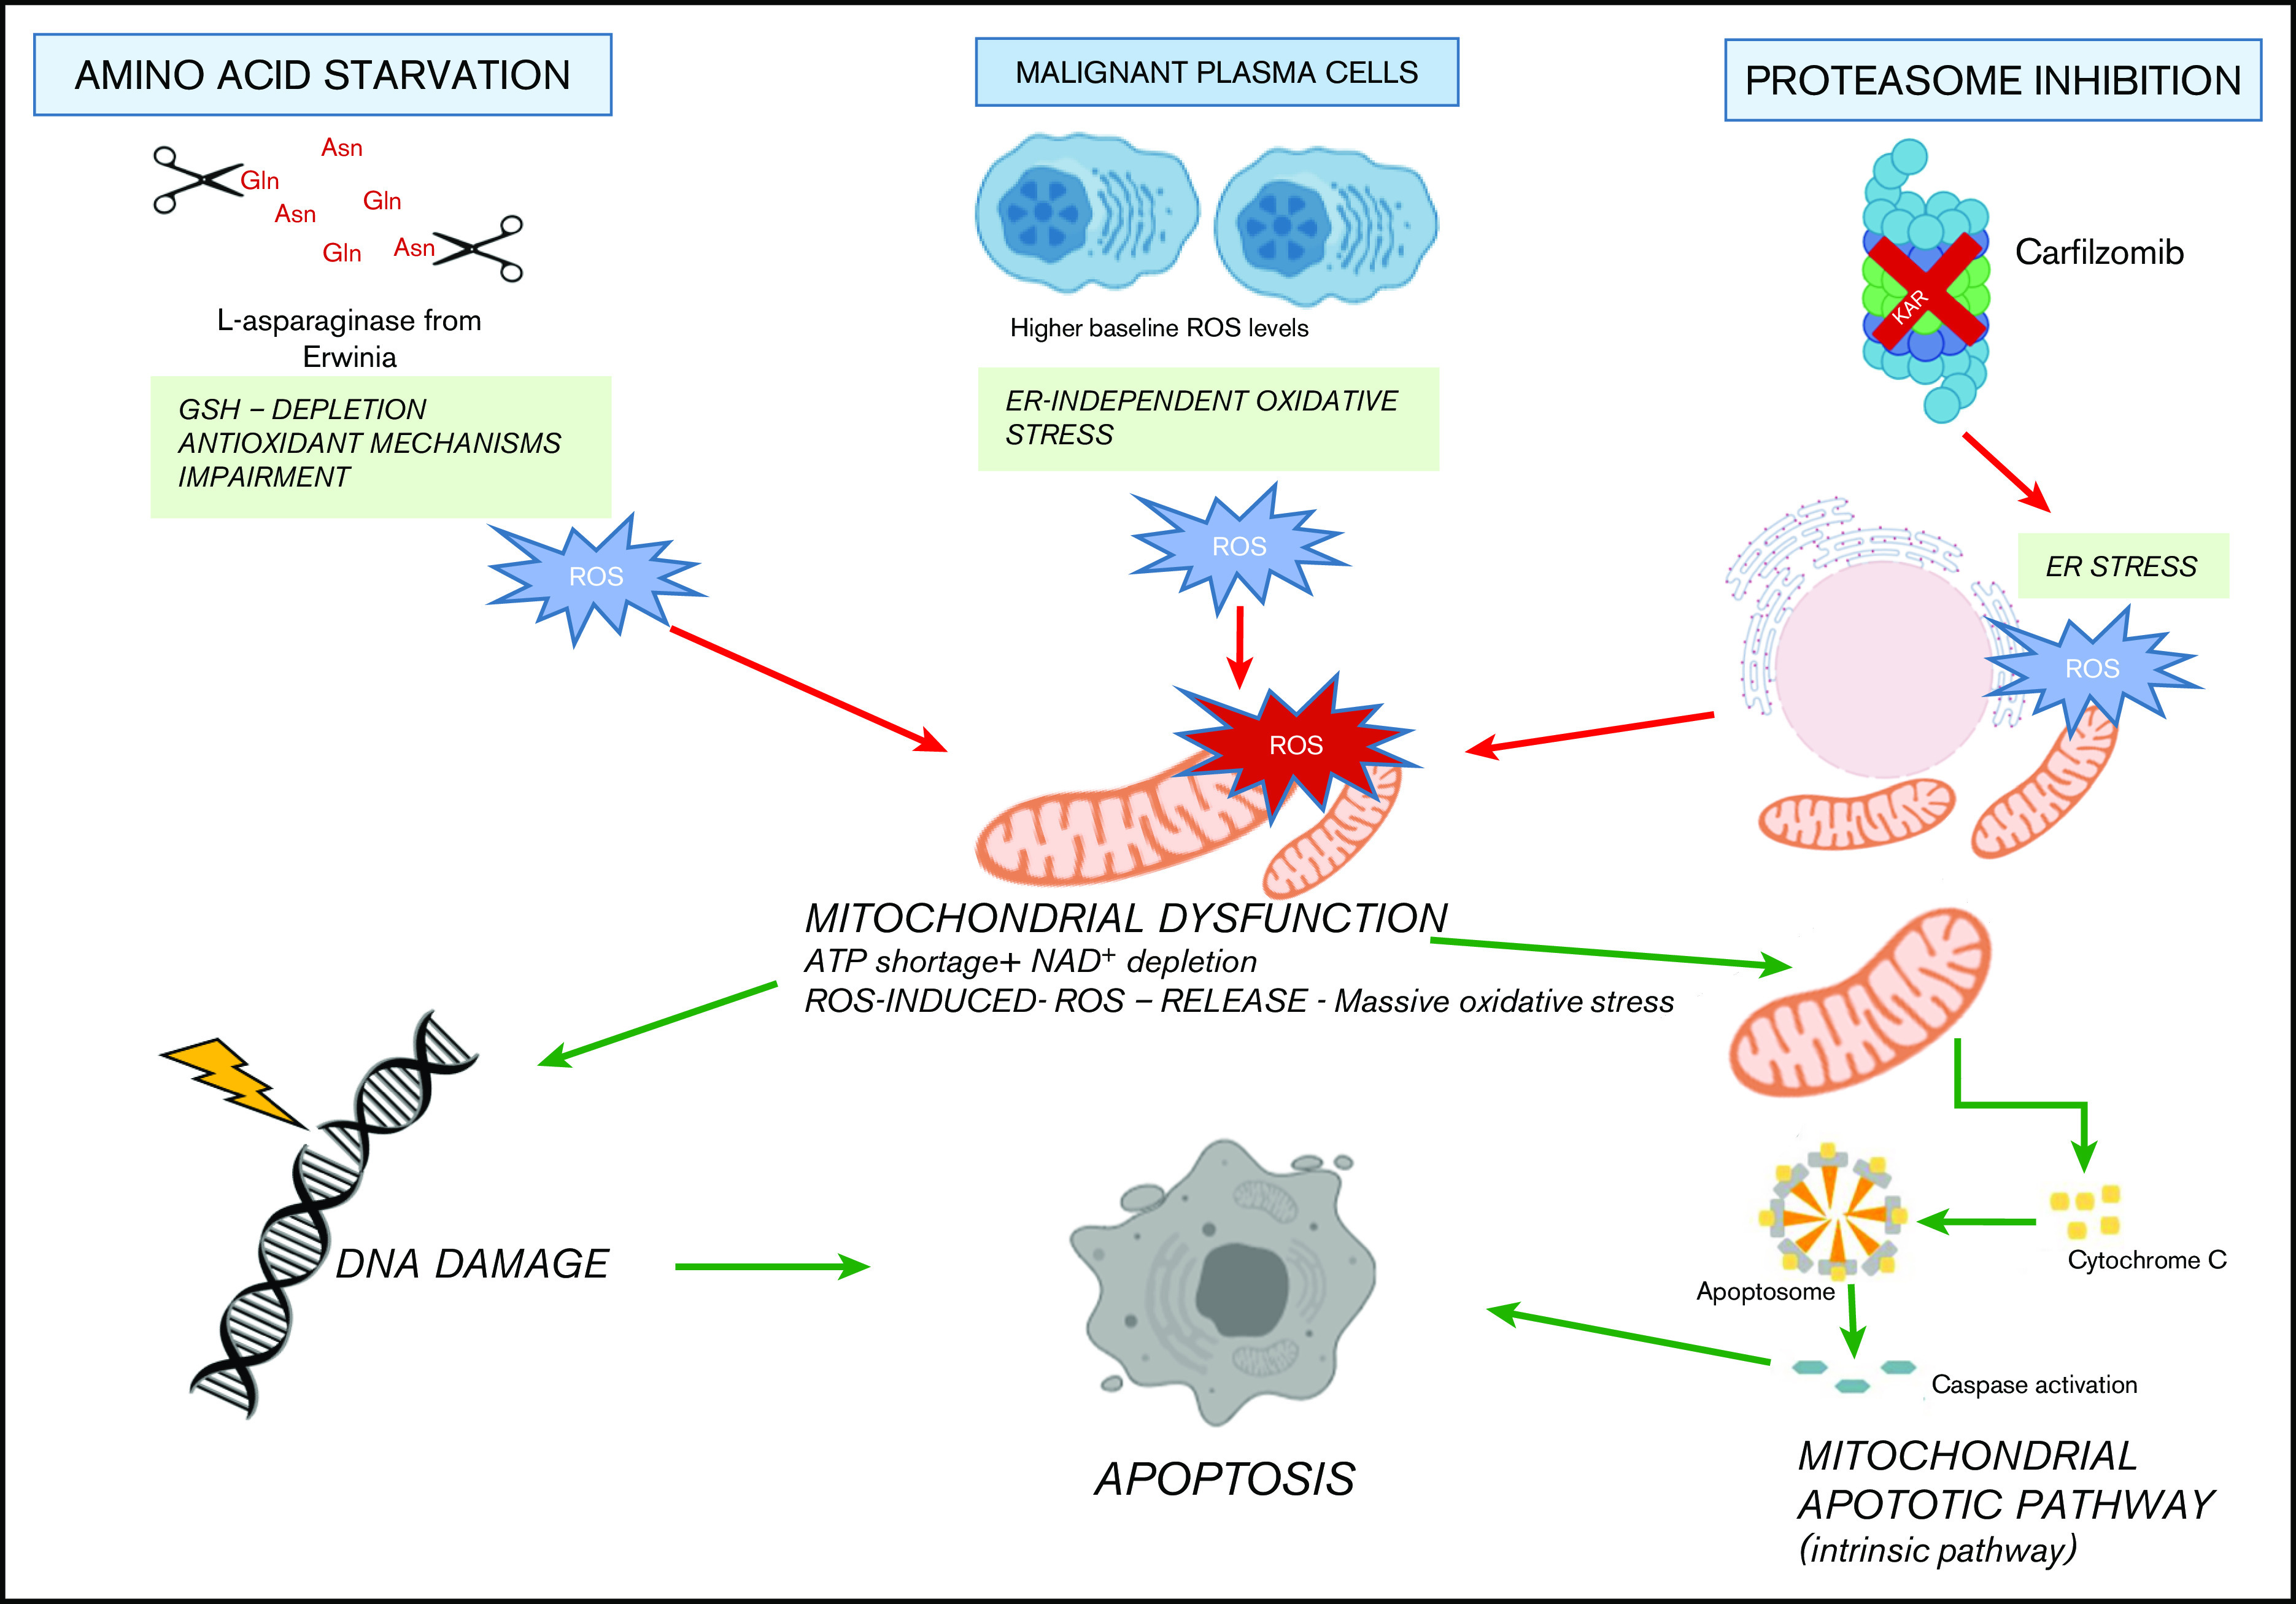
Metabolic reprogramming is emerging as a cancer vulnerability that could be therapeutically exploitable using different approaches, including amino acid depletion for those tumors that rely on exogenous amino acids for their maintenance. ʟ-Asparaginase (ASNase) has contributed to a significant improvement in acute lymphoblastic leukemia outcomes; however, toxicity and resistance limit its clinical use in other tumors. Here, we report that, in multiple myeloma (MM) cells, the DNA methylation status is significantly associated with reduced expression of ASNase-related gene signatures, thus suggesting ASNase sensitivity for this tumor. Therefore, we tested the effects of ASNase purified from Erwinia chrysanthemi (Erw-ASNase), combined with the next-generation proteasome inhibitor (PI) carfilzomib. We observed an impressive synergistic effect on MM cells, whereas normal peripheral blood mononuclear cells were not affected. Importantly, this effect was associated with increased reactive oxygen species (ROS) generation, compounded mitochondrial damage, and Nrf2 upregulation, regardless of the c-Myc oncogenic-specific program. Furthermore, the cotreatment resulted in genomic instability and DNA repair mechanism impairment via increased mitochondrial oxidative stress, which further enhanced its antitumor activity. Interestingly, carfilzomib-resistant cells were found to be highly dependent on amino acid starvation, as reflected by their higher sensitivity to Erw-ASNase treatment compared with isogenic cells. Overall, by affecting several cellular programs, Erw-ASNase makes MM cells more vulnerable to carfilzomib, providing proof of concept for clinical use of this combination as a novel strategy to enhance PI sensitivity in MM patients.


Conflict of interest statement

Conflict-of-interest disclosure: The authors declare no competing financial interests.

Figures

None
Graphical abstract
Figure 1.
Figure 1.
Metabolic landscape provides the biological rationale for amino acid–depletion therapies in MM. (A) Heat map showing expression levels for the probe sets corresponding to ASNase signature defined by Sugimoto et al in plasma cells from patients with monoclonal gammopathy of undetermined significance (MGUS), smoldering MM (SMM), active disease (MM), and plasma cell leukemia (PCL), as well as in HMCLs compared with normal plasma cells (accession numbers GSE66293 and GSE47552). The color scale spans the relative gene expression changes standardized on the variance. (B) Bar graph showing the frequency of primary patient MM samples included in GSE66293 with t(11;14) (left panel) and t(4;14) (right panel) displaying ASNase high vs low signature. The P value was calculated using Fisher’s exact test. (C) Kaplan-Meier survival curves on OS (left panel) and PFS (right panel) data for low and high z-scores of ASNase signature MM groups from CoMMpass study. Log-rank test P values and MM patients are stratified in each group, according to their risk at the time of diagnosis. (D) Waterfall plots showing ASNS and GLS2 mRNA levels related to their DNA methylation in MM patients. Each bar represents a tumor sample. The P values were calculated based on the Spearman correlations test (2-sided). Red indicates expression above the median, and blue indicates expression below the median. (E) Asn (upper panel) and Gln (lower panel) concentration, as measured in conditioned media collected at each time point from RPMI-8226 cells treated with 0.3 U/mL E coli ASNase or Erw-ASNase. Amino acid concentration was normalized to relative control. (F) Drug effects on the indicated MM cell lines treated with increasing doses of Erw-ASNase (0.1-3 U/mL for 48 hours). (G) MM.1S cells were treated with 0.5 U/mL Erw-ASNase at indicated time. Immunoblots for cMyc, CDK4, CDK6, and p21 are shown. γ-tubulin was used as loading control. (H) Cell cycle analysis of MM.1S cells at the indicated time points following Erw-ASNase treatment (0.5 U/mL), by flow cytometry. **P < .01, unpaired Student t test.
Figure 2.
Figure 2.
Anti-MM activity of dual Asn/Gln depletion plus Kar. MM cell lines (A) and primary CD138+ cells (NDMM and RRMM) (B) were treated with ASNase, Kar, or their combination. Cell viability was measured and presented as a percentage of control cells (untreated). Synergism was calculated by CI analysis, with heat maps depicting the CI values at increasing doses of Erw-ASNase and Kar. CIs were generated with CalcuSyn software for each drug combination. CI < 1, CI = 1, and CI > 1 denote synergism, additive effect, and antagonism, respectively. Data are mean ± SD (n = 3). (C) Viability of U266 NanoLuc+ cells treated with Erw-ASNase, Kar, or their combination for 48 hours, alone and in the presence of MM patient–derived BMSCs (gray), measured by luciferase-based luminescence assay. Data are mean ± SD in all graphs (n = 3). (D) Healthy donor PBMCs were exposed to increased doses of each drug, alone or in combination, and viability was measured using an MTS assay. (E) LP1 cells were treated with Erw-ASNase (0.5 U/mL), Kar (3 nM), or both. Apoptotic cell death was assessed by flow cytometry using annexin V and propidium iodide double staining after 48 hours. (F) Immunoblots for PARP1, caspase-3, caspase-9, and GAPDH on the indicated MM cell lines at 24 hours posttreatment with Erw-ASNase (0.5 U/mL), Kar (5 nM), or both. (G) Western blot showing that amino acid depletion recapitulates apoptotic features triggered by Erw-ASNase treatment on Kar-exposed U266 cells. Cleavage of PARP1, caspase-3, caspase-9, and GAPDH (loading control) was detected. One representative western blot of 3 is shown. **P < .01, ***P < .0001, unpaired Student t test. ns, not significant.
Figure 3.
Figure 3.
Kar combined with Erw-ASNase results in massive mitochondria impairment. (A) LP1 and U266 cells were treated with Erw-ASNase (0.5 U/mL), Kar (3 nM), or both for 48 hours. Then cells were harvested, and whole-cell lysates were subjected to immunoblot analysis using anti–c-Myc, anti-4EBP1, anti-IRF4, or anti-GAPDH (loading control). (B) Isogenic U266 cells (pLVempty) or c-Myc–overexpressing (pLVcMyc-OE) cells were treated with Erw-ASNase (0.5 U/mL), Kar (0-2 nM), or both for 48 hours. Cell viability was measured using an MTS assay and is presented as a percentage of control. Inset shows immunoblot for c-Myc protein levels in tested cell lines. (C) Western blot analysis of LP1 cells shows that 24-hour treatment with Erw-ASNase (0.5 U/mL), Kar (3 nM), or both results in ER stress pathway boosting. (D) LP1 cell line was treated with Erw-ASNase (0.5 U/mL), Kar (2 nM), or combined therapy for 48 hours. Then cells were harvested, and intracellular ATP levels were measured using a sensitive enzyme cyclic assay. All data are mean ± SD of 3 independent experiments. (E) TMRE peak M2 detects signal from polarized mitochondria upon 48 hours of drug exposure (used as single agents or in combination) in U266 cells. All data are mean ± SD of 3 independent experiments. (F) Cytochrome c release from mitochondria was assessed using western blot analysis of subcellular fractions of the indicated MM cells treated with Erw-ASNase (0.5 U/mL), Kar (3 nM), or their combination for 24 hours. Then cytoplasmic and mitochondria extracts were subjected to western blotting using the indicated antibodies. The quality check for each subcellular fraction was performed using specific cytosolic (PFKP) or mitochondrial (UQRC1) markers. **P < .01, ***P < .0001, unpaired Student t test.
Figure 4.
Figure 4.
Cotreatment triggers DNA damage accumulation in MM cells. (A) Western blot analysis of γ-H2A.X in the indicated MM cell lines treated with Erw-ASNase (0.5 U/mL), Kar (3 nM), or their combination for 24 hours. GAPDH was used as loading control. (B) Immunofluorescence staining of γ-H2A.X in treated LP1 cells (left panels). The number of γH2AX foci per cell was quantified and is shown normalized to control (right panel). Magnification ×40. (C) Western blots showing DNA damage and DDR pathway deregulation of LP1 cells after drug treatment (left panels). Quantification of each signal is shown normalized to γ-tubulin as loading control (right panel). (D) HR activity of U266 after the indicated drug treatment. Cells were treated for 6 hours, nucleofected with dl1 and dl2 plasmids (250 ng each), and treated for an additional 20 hours. Next, DNA was extracted, and qPCR was performed. 2^DDCt was used to quantitate HR activity (assay vs universal mix, according to the manufacturer’s instructions). Data in panels B and D are mean ± SD of 3 independent experiments. *P < .05, ** P < .01, ***P < .0001, unpaired Student t test.
Figure 5.
Figure 5.
ROS mediate sensitization of Erw-ASNase–treated MM cells to Kar. (A) U266 cells were incubated or not with NAC (5 mM) for 2 hours and treated, in the presence or absence, with Erw-ASNase (0.5 U/mL), Kar (2.5 nM), or both. Cell death was assessed by flow cytometry using annexin V (AV) and propidium iodide (PI) double staining after 48 hours. One representative experiment of 3 is shown. (B) Western blot showing that NAC pretreatment (5 mM) rescues proapoptotic features triggered by Erw-ASNase treatment on Kar-exposed U266 cells. Cleavage of PARP1, caspase-3, caspase-9, NRF2, IRF4, γ-H2A.X, and GAPDH (loading control) was assessed. One representative western blot of 3 is shown. (C) qPCR analysis for oxidative stress–induced genes in U266 cells treated with Erw-ASNase (0.5 U/mL), Kar (2.5 nM), or both. The dashed red line indicates the reference level of DMSO-treated cells. (D) MitoSOX staining on U266 cells upon Erw-ASNase treatment (0.5 U/mL), with or without Kar (5 nM) treatment, was evaluated by flow cytometry 28 hours posttreatment. All data are mean ± SD of 3 independent experiments. (E) U266 cells were incubated or not with NAC (5 mM) for 2 hours and then treated, in the presence or absence of NAC, with Erw-ASNase (0.5 U/mL), Kar (3 nM), or both. Mitochondrial superoxide levels were detected by immunofluorescence 24 hours later (left panels). Signals from MitoSOX staining were quantitated with ImageJ software and normalized to control (right panel). One representative experiment of 3 is shown. Magnification ×20. (F) Cell death of mitochondria-targeted catalase (mitoCat) and empty vector–overexpressing LP1 cells treated with the indicated stimuli (0.5 U/mL Erw-ASNase and 3 nM Kar). Cell death was assessed by flow cytometry using annexin V (AV) and propidium iodide (PI) double staining after 48 hours. The percentage of early apoptotic cells (AV+/PI−) are shown as white columns; late apoptotic cells (AV+/PI+) are shown as gray columns. One representative experiment of 3 is shown. *P < .05, **P < .01, ***P < .001, Student t test.
Figure 6.
Figure 6.
Kar resistance elicits an unforeseen metabolic vulnerability in MM cells. (A) qPCR analysis of the indicated genes in AMO-1 cells was performed by comparing isogenic wild-type (Kar/S) and Kar-resistant (Kar/R) cells. (B) Violin plot representing GLS1 expression level in tumor cells derived from NDMM (Kar/S) and RRMM (Kar/R) patients. (C) Dose-response curves of AMO-1 Kar/S and Kar/R cells to increasing doses of Erw-ASNase (0.1-0.5 U/mL for 48 hours). All data are mean ± SD of 3 independent experiments. **P < .01, ***P < .001, Student t test.
Figure 7.
Figure 7.
Proposed model. Amino acid starvation induced by Erw-ASNase primes MM cell vulnerability to proteasome inhibition. Mechanistically, the combination of proteasome inhibition and amino acid starvation affects the mitochondrial compartment, resulting in metabolic failure and significant ROS generation. Moreover, by leading to DNA damage, these events result in substantial MM cell death.

References

    1. Palumbo A, Anderson K. Multiple myeloma. N Engl J Med. 2011;364(11):1046-1060. - PubMed
    1. Anderson KC. Progress and paradigms in multiple myeloma. Clin Cancer Res. 2016;22(22):5419-5427. - PMC - PubMed
    1. Kyle RA, Rajkumar SV. Multiple myeloma. N Engl J Med. 2004;351(18):1860-1873. - PubMed
    1. Cagnetta A, Lovera D, Grasso R, et al. Mechanisms and clinical applications of genome instability in multiple myeloma. BioMed Res Int. 2015;2015:943096. - PMC - PubMed
    1. Walker BA, Mavrommatis K, Wardell CP, et al. Identification of novel mutational drivers reveals oncogene dependencies in multiple myeloma [published correction appears in Blood. 2018;132(13):1461]. Blood. 2018;132(6):587-597. - PMC - PubMed

Publication types