. 2020 Nov 9;55(3):289-297.e4.
doi: 10.1016/j.devcel.2020.08.008. Epub 2020 Sep 10.

Selective Lysosome Membrane Turnover Is Induced by Nutrient Starvation

Affiliations

Selective Lysosome Membrane Turnover Is Induced by Nutrient Starvation

Chan Lee et al. Dev Cell. .

Abstract

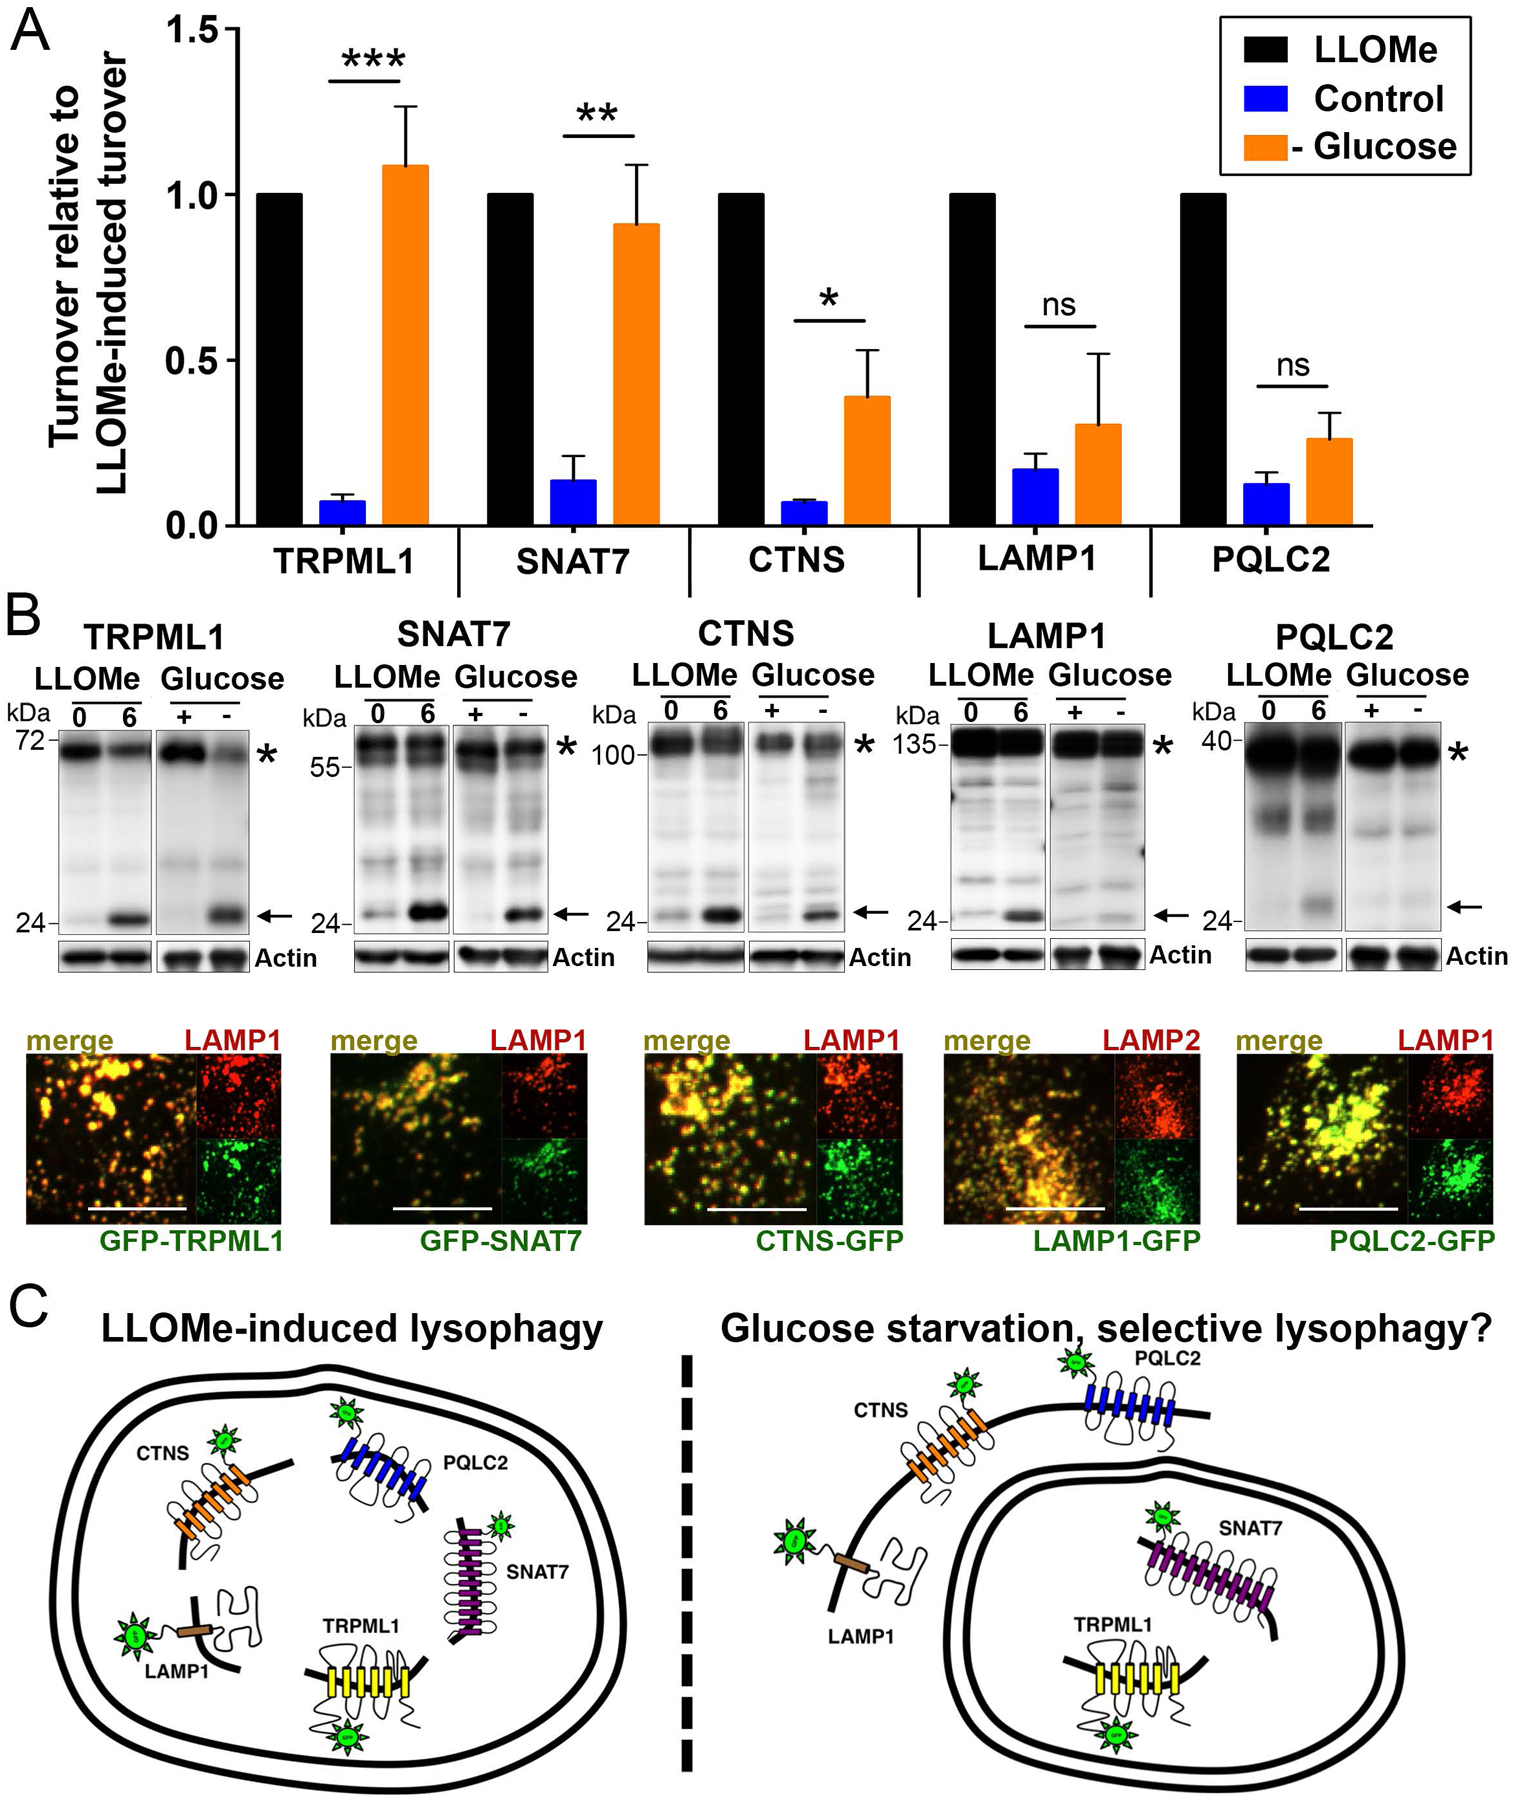
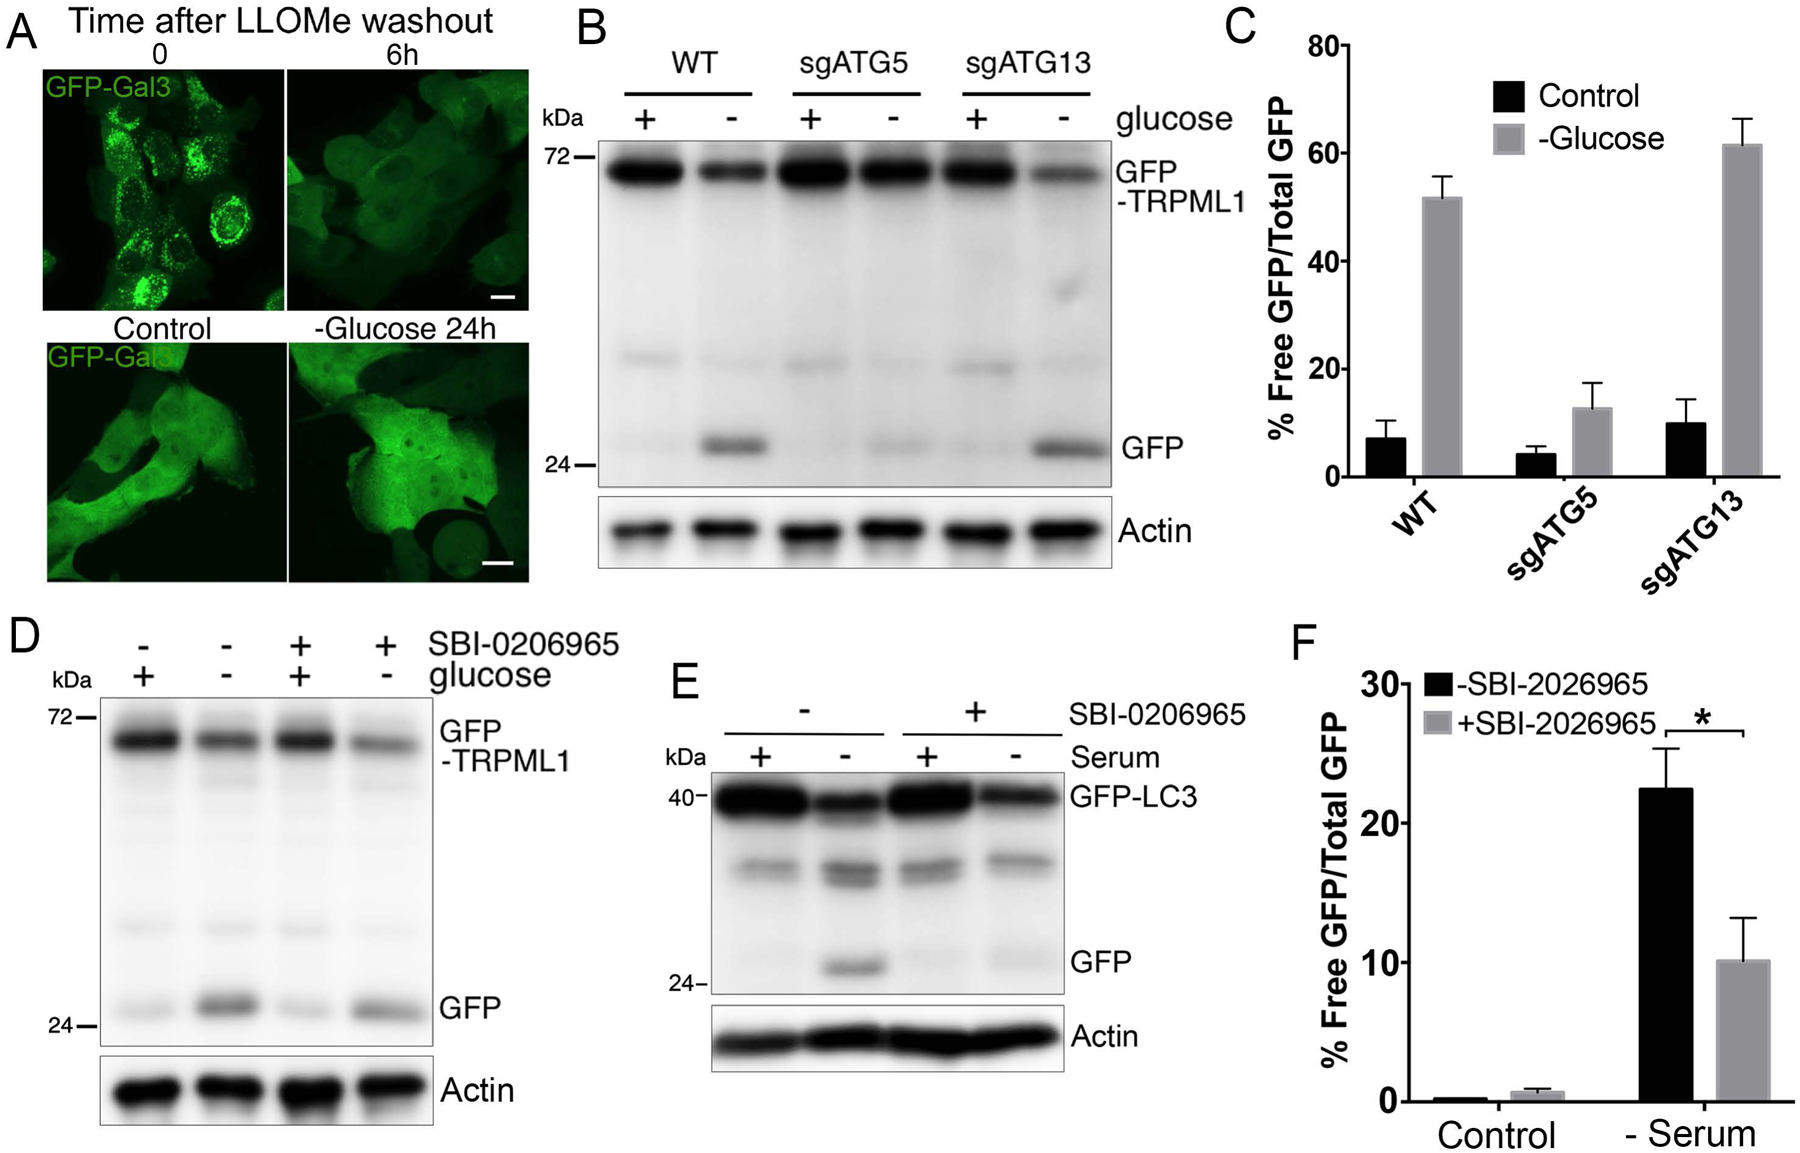
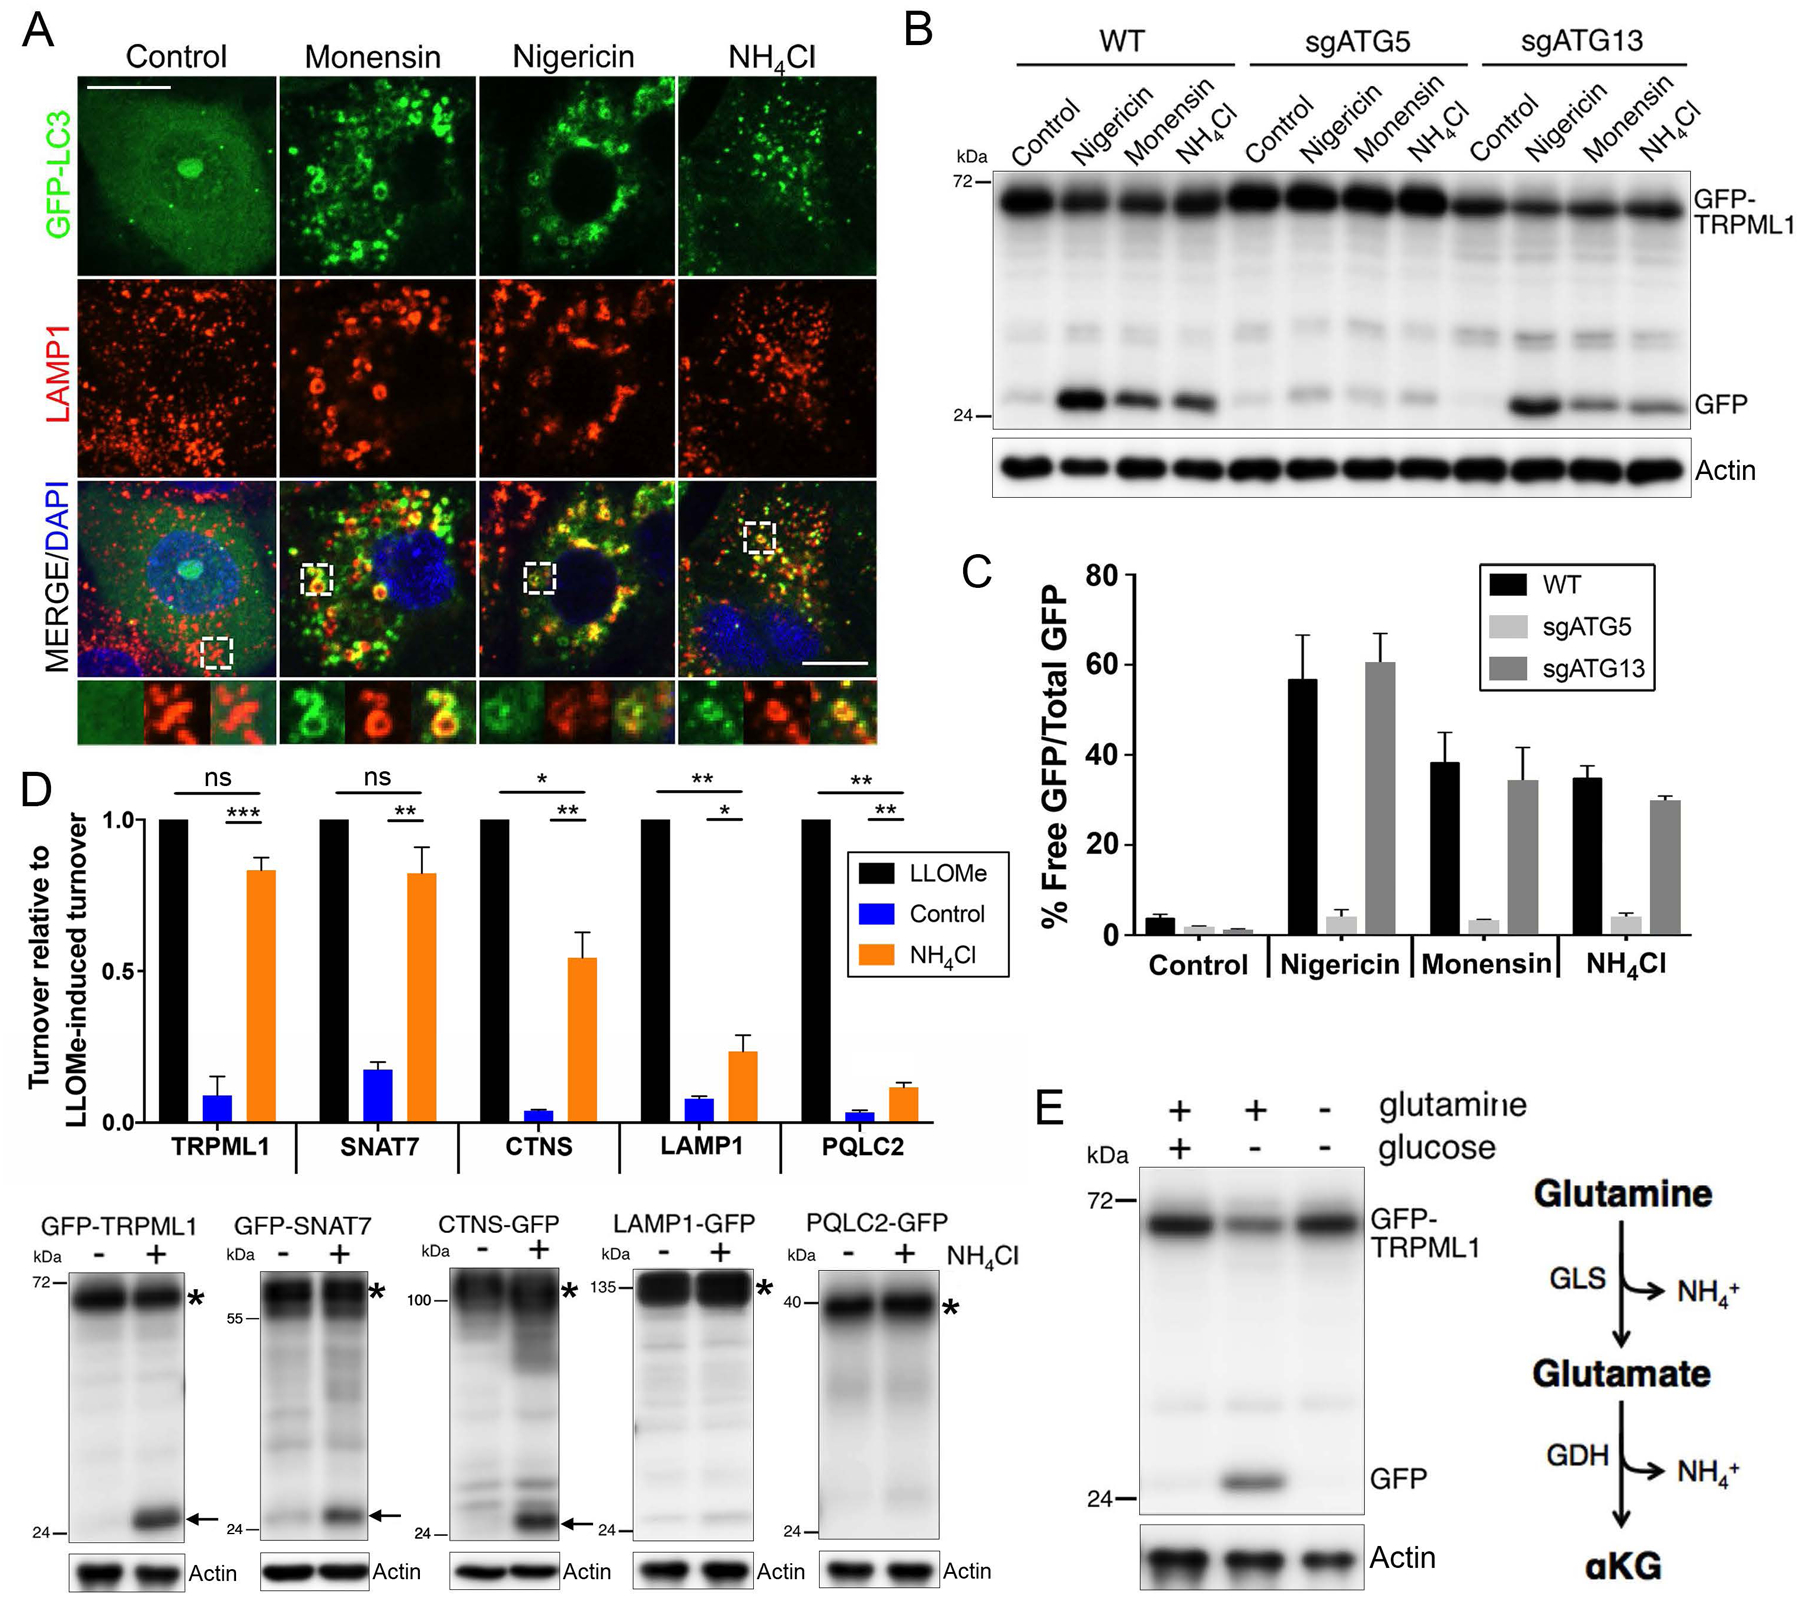
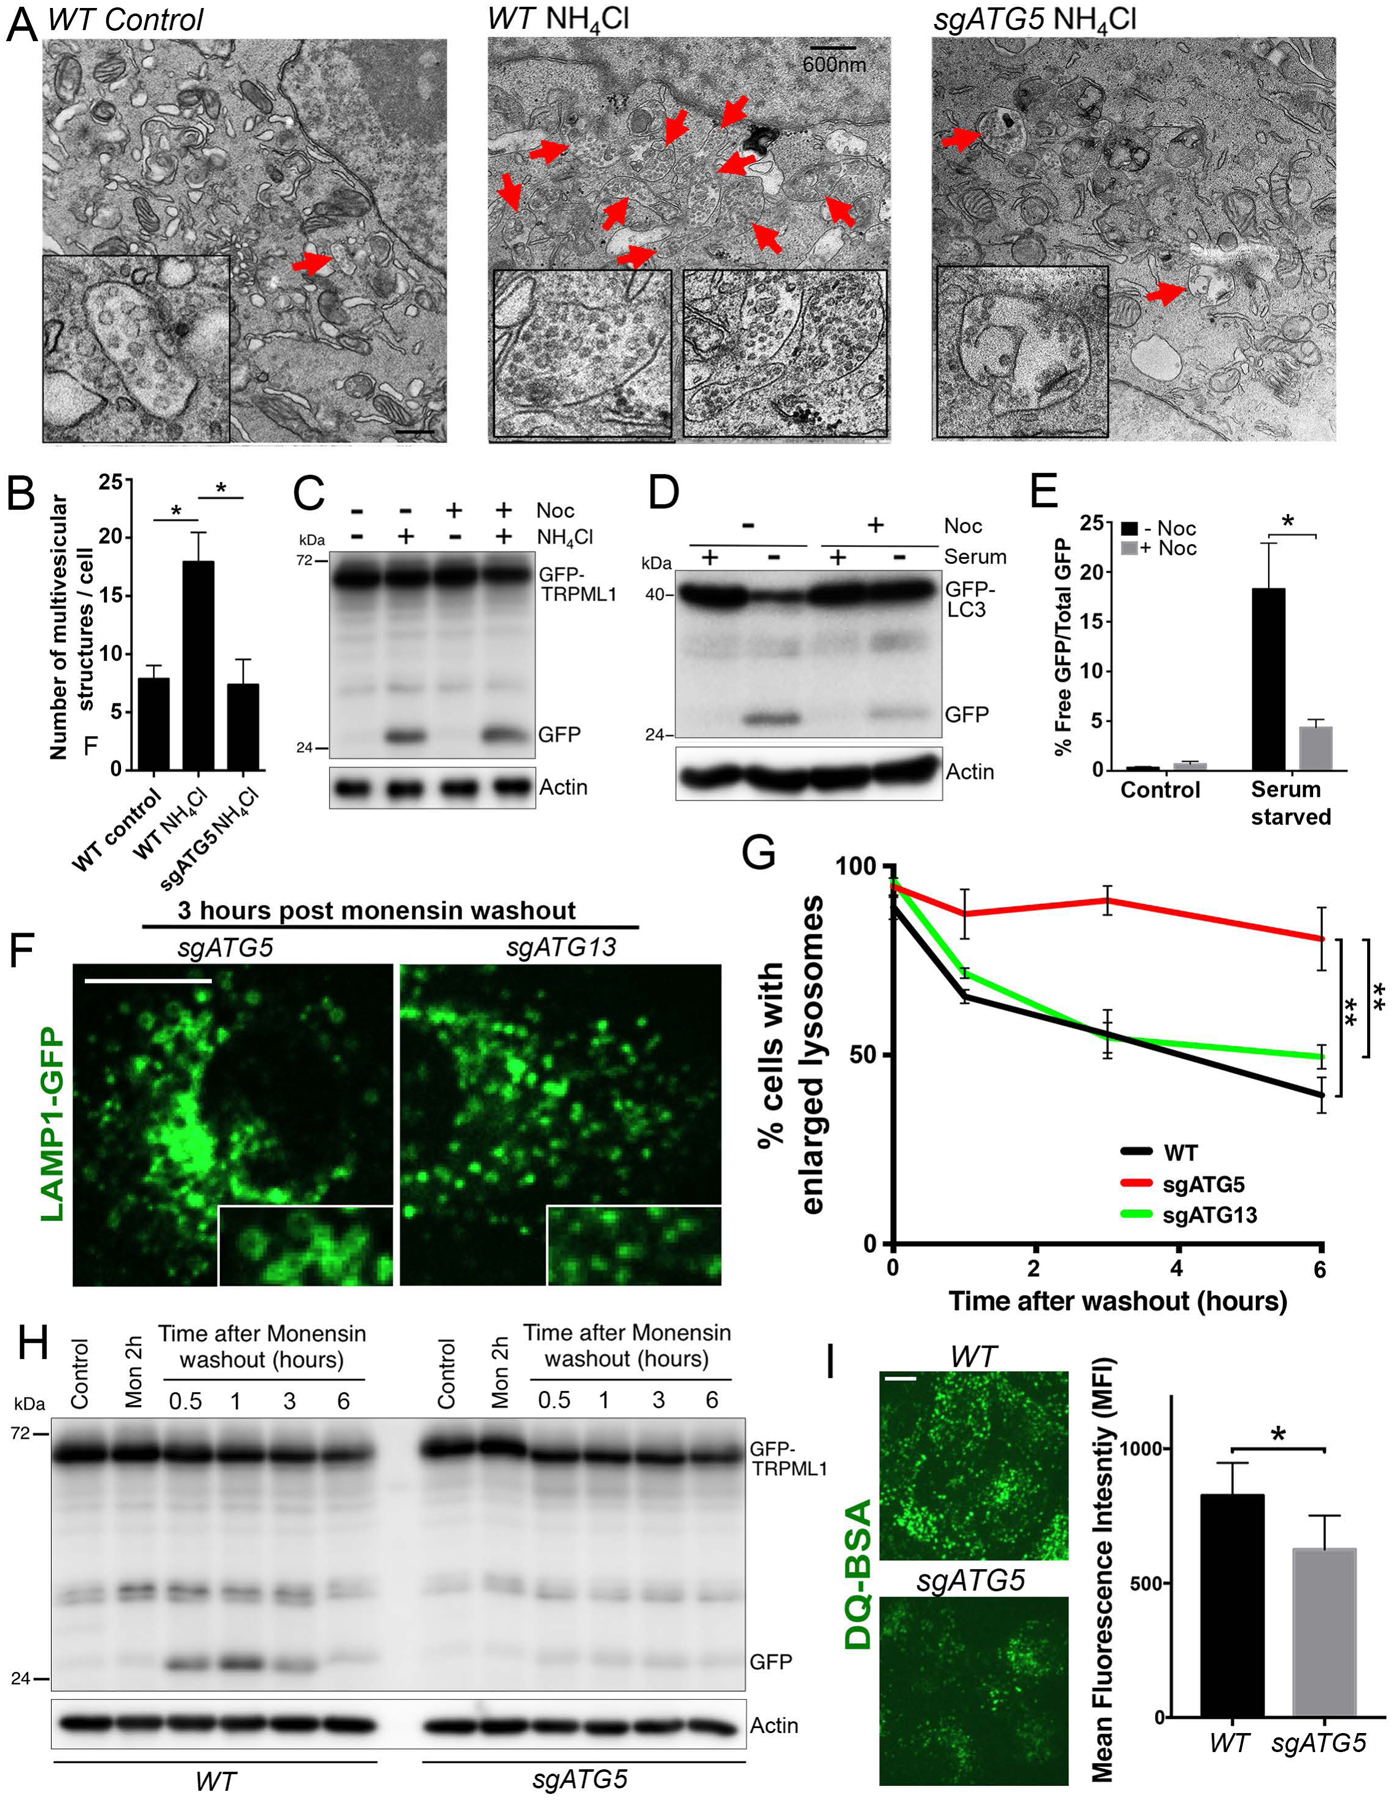
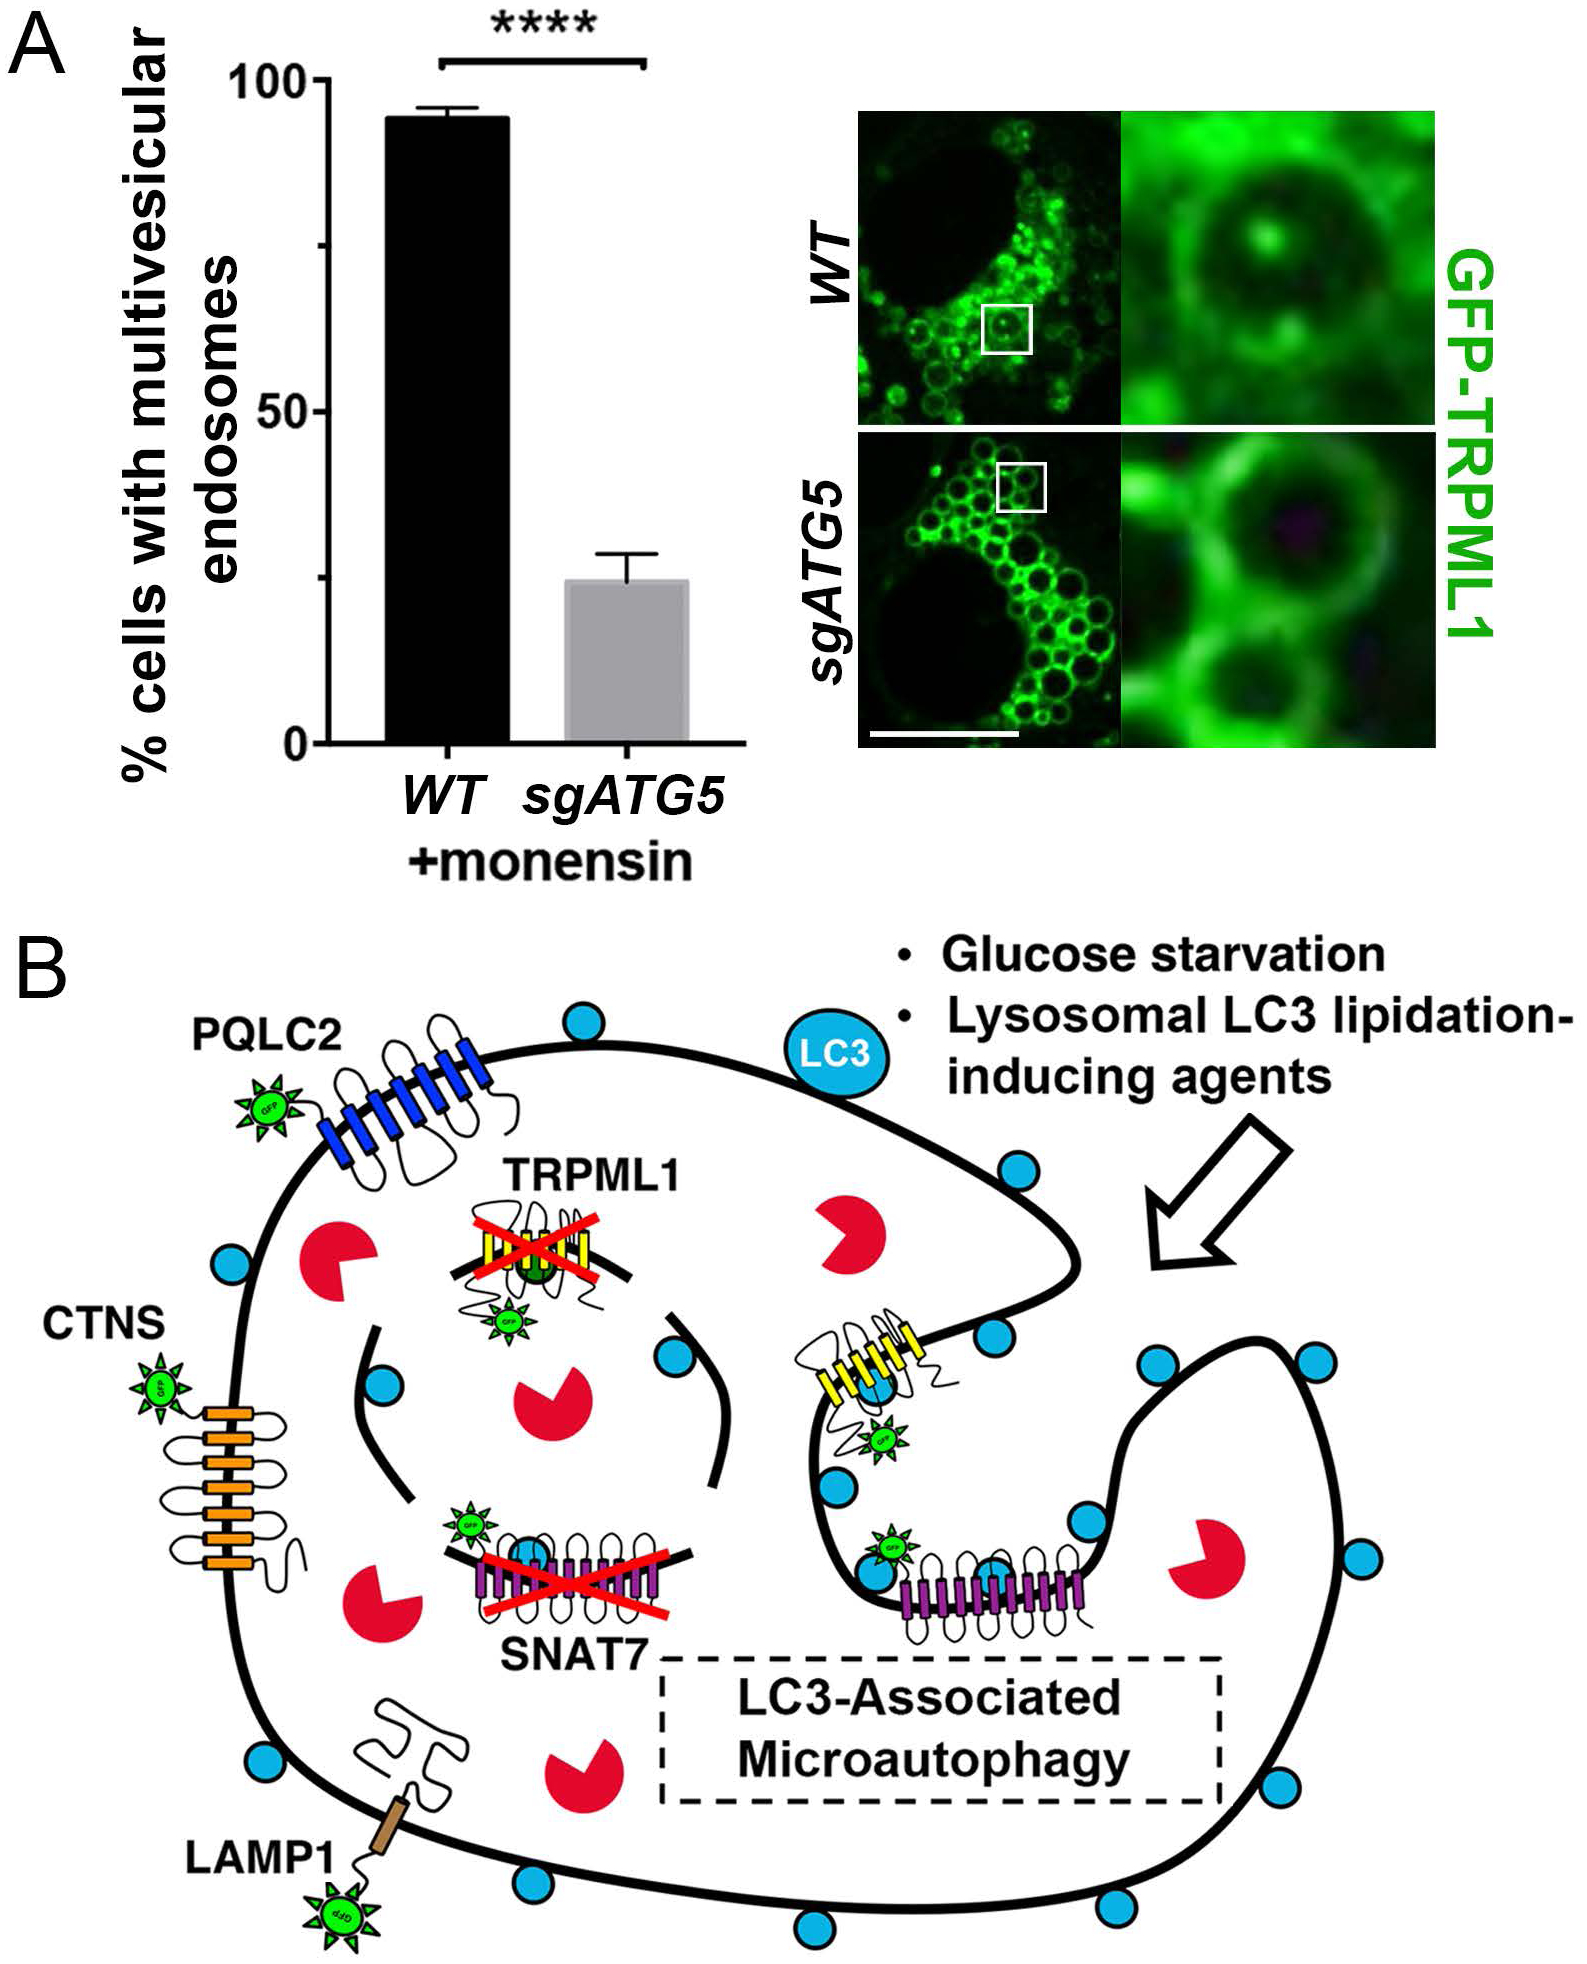
Lysosome function is essential for cellular homeostasis, but quality-control mechanisms that maintain healthy lysosomes remain poorly characterized. Here, we developed a method to measure lysosome turnover and use this to identify a selective mechanism of membrane degradation that involves lipidation of the autophagy protein LC3 onto lysosomal membranes and the formation of intraluminal vesicles through microautophagy. This mechanism is induced in response to metabolic stress resulting from glucose starvation or by treatment with pharmacological agents that induce osmotic stress on lysosomes. Cells lacking ATG5, an essential component of the LC3 lipidation machinery, show reduced ability to regulate lysosome size and degradative capacity in response to activation of this mechanism. These findings identify a selective mechanism of lysosome membrane turnover that is induced by stress and uncover a function for LC3 lipidation in regulating lysosome size and activity through microautophagy.

Keywords: ATG5; LAP; LC3; ammonium; autophagy; glucose; glutamine; lysosome; metabolism; microautophagy.


Conflict of interest statement

Declaration of Interests The authors declare no competing interests.

Figures

Figure 1.
Figure 1.. Whole organelle and selective lysosome turnover measured by the degradation of lysosomal transmembrane proteins.
(A) Graph shows relative turnover of the indicated GFP-tagged lysosomal transmembrane proteins normalized to turnover in response to LLOMe. Turnover was quantified as the percentage of free GFP over the total full-length protein plus free GFP, in control, LLOMe-treated, or glucose-starved conditions. Cells were starved for glucose for 24 hours or treated with LLOMe for one hour followed by a six-hour chase. Graph shows data from three or more independent experiments for each reporter; error bars show SEM. *p<.05; **p<.01; ***p<.001. (B) Representative western blots from the data graphed in part A. For each reporter, free GFP is indicated with an arrow, and full-length protein is indicated with an asterisk. For GFP-TRPML1, full length protein indicated by asterisk is cleavage product, as reported (Kiselyov et al., 2005). Actin loading controls are also shown. Images below the blots show colocalization of GFP-tagged reporter proteins with endogenous LAMP1 or LAMP2 lysosomal proteins detected by immunostaining. Scale bars = 10μm. (C) Working models for whole lysosome turnover through lysophagy in response to lysosome rupture with LLOMe (left), or selective turnover observed in response to starvation for glucose (right). Double-membrane structure on left depicts autophagosome surrounding whole damaged lysosome. Double membrane structure on right is drawn to surround only those reporter proteins that undergo selective turnover in glucose-starved cells.
Figure 2.
Figure 2.. Selective turnover occurs through an ATG5-regulated mechanism.
(A) Lysosomes undergo rupture in response to LLOMe but not glucose starvation. Images show GFP-Gal3 fluorescence in LLOMe-treated cells at time zero after treatment (top left), or six hours after LLOMe washout (top right), and in control or cells starved of glucose for 24 hours (bottom images). (B) GFP-TRPML1 turnover in response to glucose starvation is regulated by ATG5 but not ATG13. Western blot shows GFP-TRPML1 cleavage after 24 hours of glucose starvation. GFP-TRPML1 and free GFP are indicated. Actin loading controls are also shown. (C) Quantification of data shown in part B from three independent experiments; error bars show SEM. (D) GFP-TRPML1 turnover in glucose-starved cells (24 hours) is not inhibited with treatment with the ULK1 kinase inhibitor SBI-0206965. Actin loading controls are also shown. (E) Autophagy flux in response to serum starvation for 10 hours, measured by GFP-LC3 cleavage leading to the generation of free GFP, is inhibited by treatment with SBI-0206965. Actin loading controls are also shown. (F) Quantification of data shown in part E from three independent experiments; error bars show SEM. *p<.05.
Figure 3.
Figure 3.. Endolysomal LC3 lipidation induces selective lysosome turnover.
(A) Treatment with monensin, nigericin, or ammonium chloride for two hours induces colocalization of GFP-LC3 (green) with LAMP1 (red) on enlarged endolysosomes. Insets at bottom are indicated by white hatched boxes. Scale bar = 10μm. (B) Treatment with monensin, nigericin, or ammonium chloride for eight hours induces turnover of GFP-TRPML1 in an ATG5-regulated, ATG13-independent manner. Actin loading controls are also shown. (C) Graph shows quantification of data from part B from three independent experiments; error bars show SEM. (D) Treatment with ammonium chloride for 24 hours induces selective turnover of GFP-TRPML1 and GFP-SNAT7. Graph shows relative turnover of the indicated GFP-tagged lysosomal transmembrane proteins in control or ammonium-treated cells, normalized to turnover in response to LLOMe. Data are from three independent experiments for each reporter; error bars show SEM. *p<.05; **p<.01; ***p<.001. Note that CTNS-GFP, LAMP1-GFP, and PQLC2-GFP turnover to a significantly lesser extent in response to ammonium as compared to LLOMe. Representative western blots are shown below the graph. For each reporter, free GFP is indicated with an arrow and full-length protein is indicated with an asterisk. (E) GFP-TRPML1 turnover in cells starved for glucose for 24 hours requires the presence glutamine. Right schematic: glutamine catabolism generates ammonium.
Figure 4.
Figure 4.. Selective turnover occurs through microautophagy.
(A) Treatment with ammonium induces the appearance of multivesicular endosomes (indicated with red arrows) in an ATG5-regulated manner. Electron micrographs show control untreated WT cells (left), or WT cells (middle) or sgATG5 cells (right) treated with ammonium for 24 hours. Scale bar = 600nm. (B) Quantification of data from part A from >10 independent cells per condition; error bars show SEM. *p<.05. (C) GFP-TRPML1 turnover induced by ammonium treatment for 24 hours is unaffected by treatment with nocodazole (Noc). Actin loading controls are also shown. (D) Autophagy flux induced by serum starvation for 10 hours and measured by GFP-LC3 cleavage is inhibited by treatment with nocodazole. Actin loading controls are also shown. (E) Quantification of data from part D from three independent experiments; error bars show SEM. *p<.05. (F) Lysosomes undergo ATG5-regulated shrinkage after treatment with monensin. Images show lysosomes marked by LAMP1-GFP expression (green), three hours post monensin washout after a two-hour treatment. Note lysosomes in sgATG5 cells appear larger than in sgATG13 cells (inset). Scale bar = 10μm. (G) Quantification of lysosome sizes over time in WT, sgATG5 and sgATG13 cells after washout of monensin following a two-hour treatment. Data from three independent experiments are quantified and graphed as percent cells with five or more lysosomes of 2μm diameter or larger. In total >150 cells were analyzed for each condition across three independent experiments. **p<.01. (H) GFP-TRPML1 undergoes turnover following monensin washout after a two-hour treatment. GFP-TRPML1 and GFP are indicated. Actin loading controls are also shown. (I) sgATG5 cells exhibit reduced DQ-BSA cleavage compared to WT cells four hours after monensin washout. Images show DQ-BSA fluorescence (green). Scale bar = 10μm. Graph shows DQ-BSA fluorescence intensities quantified by flow cytometry from three independent experiments. *p<.05.
Figure 5.
Figure 5.. ATG5-regulated microautophagy.
(A) ATG5-regulated formation of intraluminal vesicles is induced by monensin treatment. Graph shows quantification of intraluminal vesicles in monensin-treated WT and sgATG5 cells. In total >180 cells were analyzed for each condition across four independent experiments. Error bars show SEM. ****p<.0001. Images show enlarged lysosomes from WT and sgATG5 GFP-TRPML1 expressing cells treated with monensin for one hour, followed by apilimod for two hours. See Supplemental Movie 1. Scale bar = 10μm. (B) Glucose-starved cells and cells treated with pharmacological agents that induce endolysosmal LC3 lipidation exhibit ATG5-regulated microautophagy, involving the formation of intraluminal vesicles (arrow) and selective turnover of lysosomal membrane proteins including TRPML1 and SNAT7.

Comment in

  • Getting picky with the lysosome membrane.
    Lee C, Overholtzer M. Lee C, et al. Autophagy. 2021 Apr;17(4):1034-1036. doi: 10.1080/15548627.2021.1877935. Epub 2021 Jan 26. Autophagy. 2021. PMID: 33499722 Free PMC article.

Similar articles

Cited by

References

    1. Cai X, Xu Y, Cheung AK, Tomlinson RC, Alcazar-Roman A, Murphy L, Billich A, Zhang B, Feng Y, Klumpp M, et al. (2013). PIKfyve, a class III PI kinase, is the target of the small molecular IL-12/IL-23 inhibitor apilimod and a player in Toll-like receptor signaling. Chem Biol 20, 912–921. - PMC - PubMed
    1. Cheong H, Lindsten T, Wu J, Lu C, and Thompson CB (2011). Ammonia-induced autophagy is independent of ULK1/ULK2 kinases. Proc Natl Acad Sci U S A 108, 11121–11126. - PMC - PubMed
    1. Choy CH, Saffi G, Gray MA, Wallace C, Dayam RM, Ou ZA, Lenk G, Puertollano R, Watkins SC, and Botelho RJ (2018). Lysosome enlargement during inhibition of the lipid kinase PIKfyve proceeds through lysosome coalescence. J Cell Sci 131. - PMC - PubMed
    1. Dikic I (2017). Proteasomal and Autophagic Degradation Systems. Annu Rev Biochem 86, 193–224. - PubMed
    1. Egan DF, Chun MG, Vamos M, Zou H, Rong J, Miller CJ, Lou HJ, Raveendra-Panickar D, Yang CC, Sheffler DJ, et al. (2015). Small Molecule Inhibition of the Autophagy Kinase ULK1 and Identification of ULK1 Substrates. Mol Cell 59, 285–297. - PMC - PubMed

Publication types