. 2020 Sep 23;11(3):229-238.e5.
doi: 10.1016/j.cels.2020.08.005. Epub 2020 Sep 10.

The Genetic Makeup of the Electrocardiogram

Affiliations

The Genetic Makeup of the Electrocardiogram

Niek Verweij et al. Cell Syst. .

Abstract

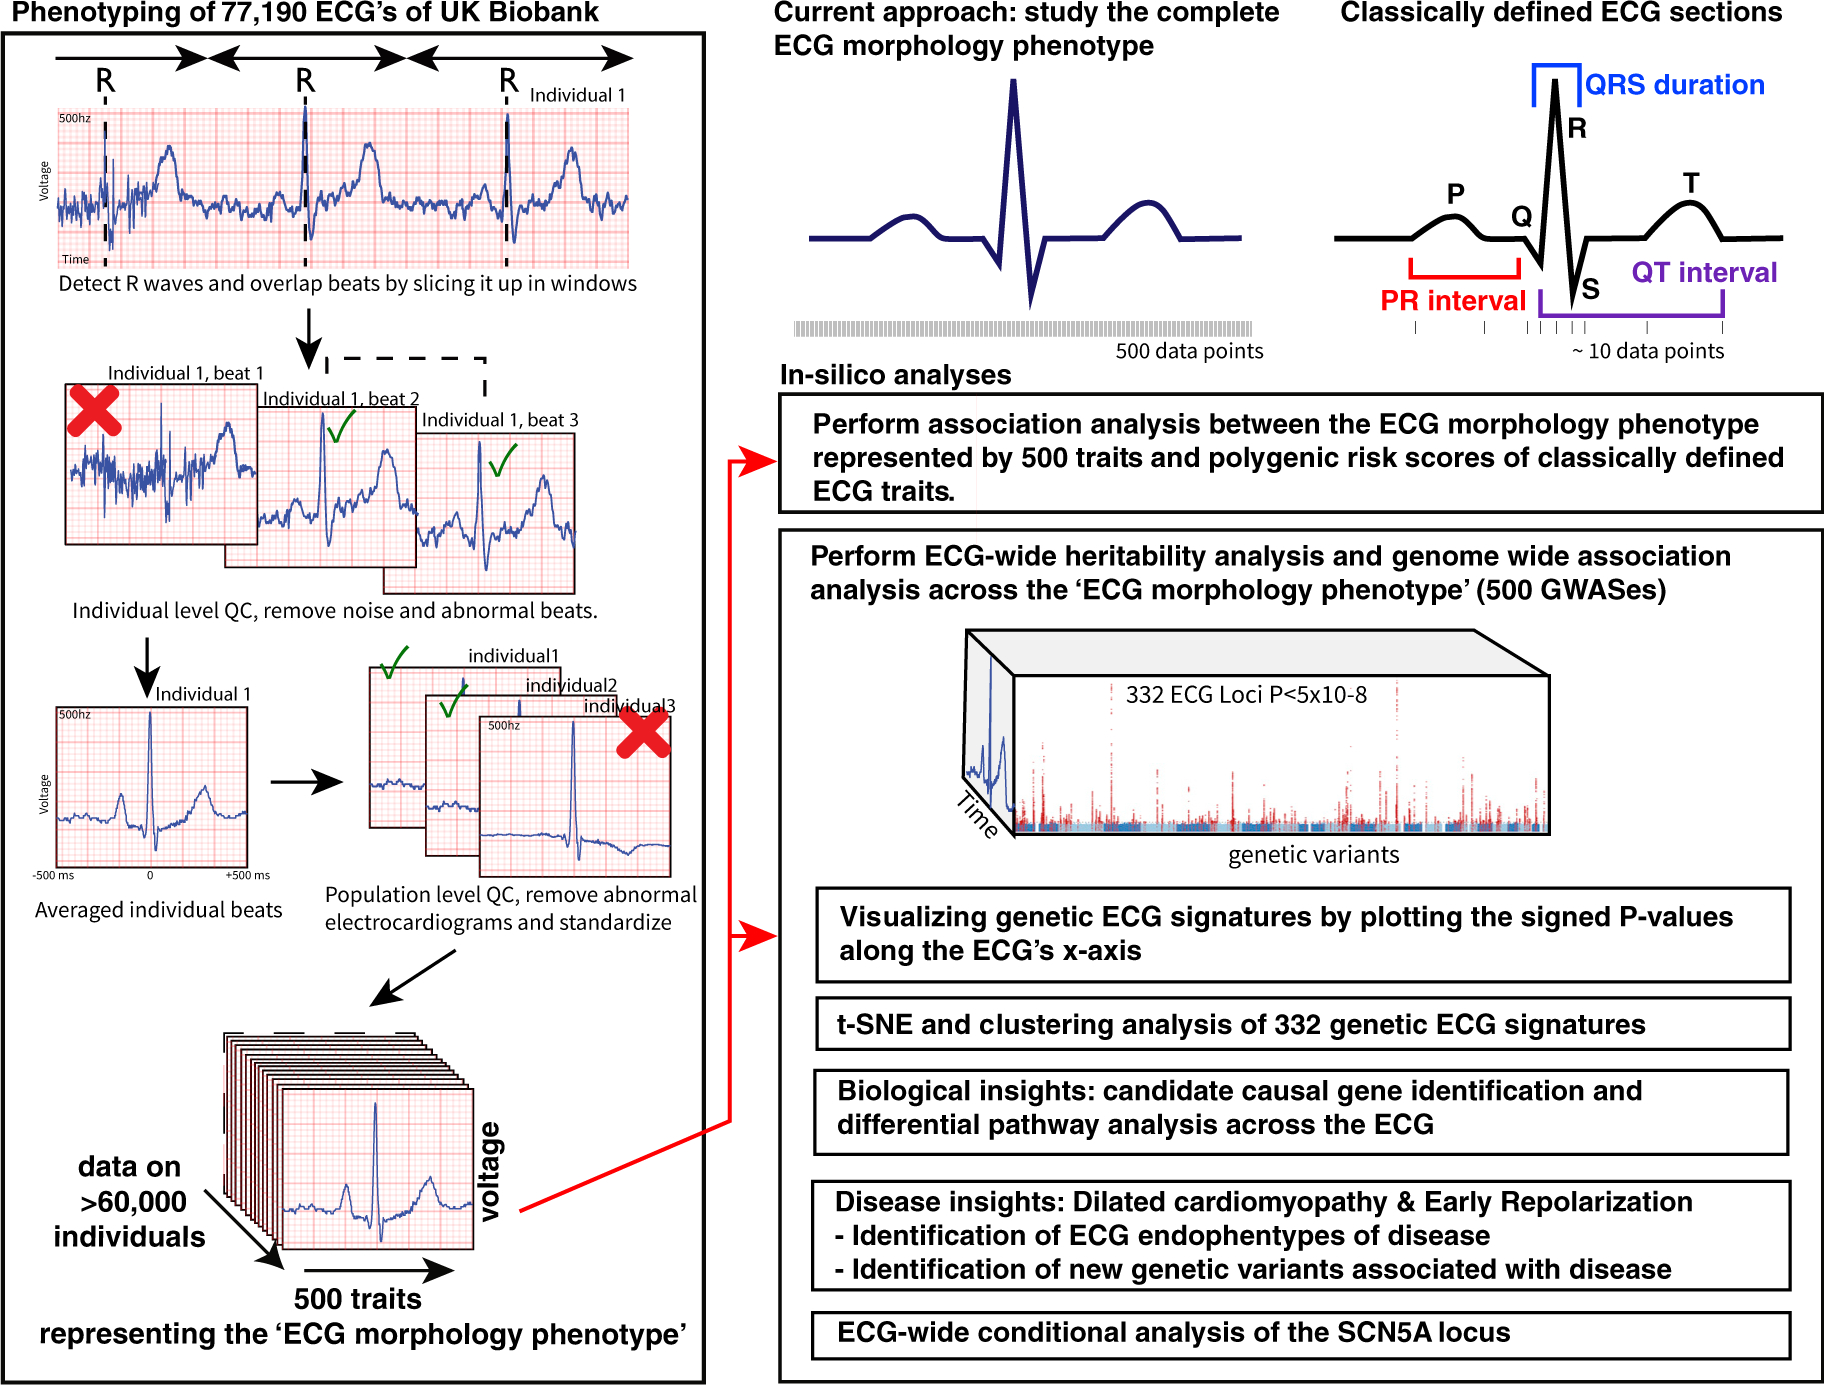
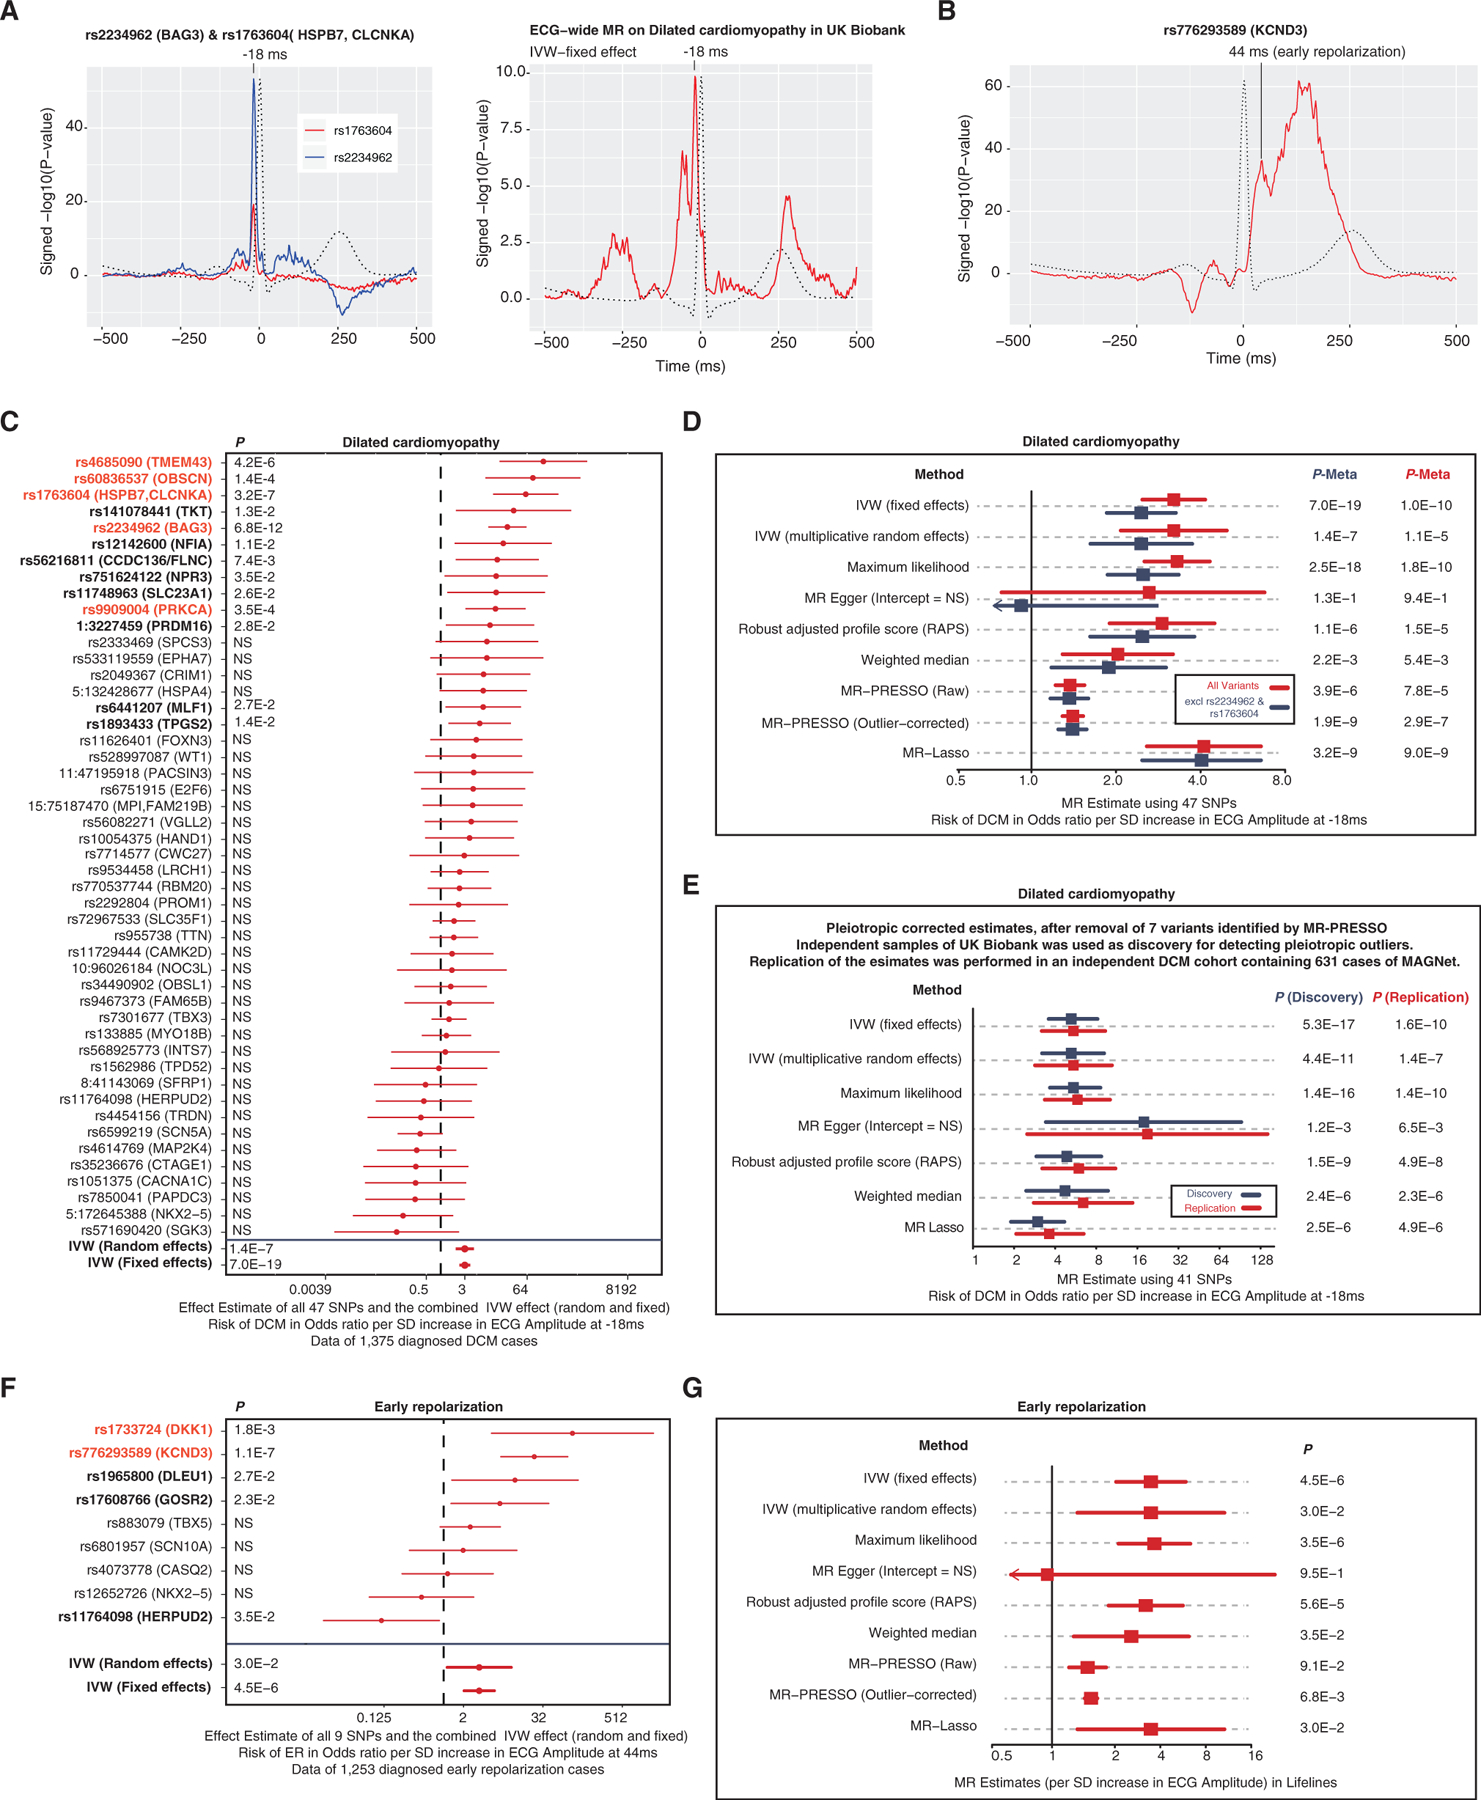
The electrocardiogram (ECG) is one of the most useful non-invasive diagnostic tests for a wide array of cardiac disorders. Traditional approaches to analyzing ECGs focus on individual segments. Here, we performed comprehensive deep phenotyping of 77,190 ECGs in the UK Biobank across the complete cycle of cardiac conduction, resulting in 500 spatial-temporal datapoints, across 10 million genetic variants. In addition to characterizing polygenic risk scores for the traditional ECG segments, we identified over 300 genetic loci that are statistically associated with the high-dimensional representation of the ECG. We established the genetic ECG signature for dilated cardiomyopathy, associated the BAG3, HSPB7/CLCNKA, PRKCA, TMEM43, and OBSCN loci with disease risk and confirmed this association in an independent cohort. In total, our work demonstrates that a high-dimensional analysis of the entire ECG provides unique opportunities for studying cardiac biology and disease and furthering drug development. A record of this paper's transparent peer review process is included in the Supplemental Information.

Keywords: cardiac conduction; cardiovascular risk; complex disease; dilated cardiomyopathy; electrocardiogram; electrophysiology; genetics; genome wide association.


Conflict of interest statement

Declaration of Interests N.V. is a paid consultant for Regeneron Pharmaceuticals. The other authors declare no competing interests.

Figures

Figure 1.
Figure 1.. Overview of the Study Design
A schematic overview of the phenotyping approach and downstream in silico annotations and analyses.
Figure 2.
Figure 2.. Polygenic Risk Scores of ECG Indices Are Associated with the Trait Expected Segments of the ECG
For each of the classical ECG traits we calculated polygenic scores and associated them with each of the data points that make up the ECG morphology phenotype. The left y axis depicts the micro voltage scale, the y axis on the right indicates the signed −log10(p values). The x axis is time in milliseconds (ms) or percentage (%) from the R-R in the case of the R-R-adjusted ECG morphology phenotype. The blue lines are the average ECG amplitude of the full cohort and the red lines the p value for association with each datapoint of the ECG morphology phenotype (n = 500 time points) on a log10 scale, signed to show direction of association. The dashed vertical black lines mark point of strongest negative and positive association. Additional plots for the R-R-adjusted ECG phenotype and sensitivity analyses can be found in the appendix.
Figure 3.
Figure 3.. Genetic Variants Display Unique Morphological Signatures and the Heritability Is Highest at ECG Segments Showing Greatest Electrical Activity
(A) A heatmap of the genetic ECG signatures that were previously found to be associated with atrial fibrillation. We normalized the genetic ECG signatures of genetic variants in order to compare the effects across loci. Effects were orientated to the most positively associated allele across all time points and colored in red on the heatmap; a blue color indicates a negative effect while yellow indicates no effect. On the left side is the unadjusted ECG phenotype, on the right side the R-R-adjusted ECG phenotype. (B) Excerpts of genetic ECG signatures for previously reported genetic variants, plotted in the same way as the polygenic risk scores in Figure 2. The red line indicates the signed −log10(p value) for association across the heartbeat. And the blue line the average ECG amplitudes in the population. (C) The SNP heritability’s (h2g) are plotted in red for the unadjusted and the R-R interval-adjusted ECG morphology phenotype. The SNP heritability was highest for the ECG morphology phenotype unadjusted for the R-R interval (left plots). The maximum observed heritability was 0.29 (SE = 0.01) at the ST-wave segment. Heritability estimates were high for ECG segments that have high electrical activity, consistent with molecular mechanism of cardiac conduction. The plots on the bottom shows the pairwise Pearson correlation matrix on the phenotype level between each ECG datapoint across the ECG morphology phenotypes. Red indicates a high positive correlation, blue indicates a high negative correlation, yellow indicates no correlation; both the x and y axes depict the ECG in time and match the average ECG amplitudes plotted on the top.
Figure 4.
Figure 4.. Unbiased Clustering Maps Main Effects of Genetic Variants on the Electrocardiogram
(A) Manhattan plot of the ECG morphology phenotype (smallest p value across all traits is shown), variants in red indicate those passing p < 5 × 10⁻⁸, the top loci have been annotated with their nearby genes. (B) The t-SNE plot was derived from a large matrix that contained all genetic ECG signatures (signed −log(p) values) for all lead genetic variants that were identified in the GWAS. An interactive t-SNE plot is available on www.ecgenetics.org. (C) Exemplar ECG signatures were annotated with the most likely candidate causal gene, illustrating how each cluster can be linked back to their primary ECG effect.
Figure 5.
Figure 5.. MR of Dilated Cardiomyopathy and Early Repolarization
(A) The left plot illustrates the ECG signature of two loci previously identified for dilated cardiomyopathy but never before for the ECG. The right plot illustrates an ECG-wide genetic signature for dilated cardiomyopathy: for this we carried out a fixed effects MR for each time point, including all lead variants p < 5 × 10⁻⁸ per time point of the ECG as instrumental variables and dilated cardiomyopathy as outcome variable. The red lines indicate the p value for association with each datapoint of the ECG morphology phenotype (n = 500 time points) on a log10 scale, signed to show direction of association. (B) The genetic ECG signature of KCND3 shows an association peak that is consistent with the early repolarization criterion at 44 ms after the R peak. (C) Forest plot of the MR estimates of the ECG at −18 ms on dilated cardiomyopathy for each variant individually. Variants in red are Bonferroni significant (p < 0.001), variants in bold are p < 0.05 for dilated cardiomyopathy. (D) MR estimates of the ECG at −18 ms on dilated cardiomyopathy. (E) MR estimates of the ECG at −18 ms on dilated cardiomyopathy in the discovery (UK Biobank) and replication (MAGNet) cohort controlling for pleiotropic variants identified by MR-PRESSO. (F) Forest plot of the MR estimates of the ECG at 44 ms on early repolarization for each variant individually. Variants in red are Bonferroni significant (p < 0.001), variants in bold are p < 0.05 for early repolarization.

Comment in

Similar articles

Cited by

  • Spatially Distinct Genetic Determinants of Aortic Dimensions Influence Risks of Aneurysm and Stenosis.
    Nekoui M, Pirruccello JP, Di Achille P, Choi SH, Friedman SN, Nauffal V, Ng K, Batra P, Ho JE, Philippakis AA, Lubitz SA, Lindsay ME, Ellinor PT. Nekoui M, et al. J Am Coll Cardiol. 2022 Aug 2;80(5):486-497. doi: 10.1016/j.jacc.2022.05.024. J Am Coll Cardiol. 2022. PMID: 35902171 Free PMC article.
  • Genetic and phenotypic architecture of human myocardial trabeculation.
    McGurk KA, Qiao M, Zheng SL, Sau A, Henry A, Ribeiro ALP, Ribeiro AH, Ng FS, Lumbers RT, Bai W, Ware JS, O'Regan DP. McGurk KA, et al. Nat Cardiovasc Res. 2024 Dec;3(12):1503-1515. doi: 10.1038/s44161-024-00564-3. Epub 2024 Nov 20. Nat Cardiovasc Res. 2024. PMID: 39567769 Free PMC article.
  • Unsupervised deep learning of electrocardiograms enables scalable human disease profiling.
    Friedman SF, Khurshid S, Venn RA, Wang X, Diamant N, Di Achille P, Weng LC, Choi SH, Reeder C, Pirruccello JP, Singh P, Lau ES, Philippakis A, Anderson CD, Maddah M, Batra P, Ellinor PT, Ho JE, Lubitz SA. Friedman SF, et al. NPJ Digit Med. 2025 Jan 12;8(1):23. doi: 10.1038/s41746-024-01418-9. NPJ Digit Med. 2025. PMID: 39799251 Free PMC article.
  • Genetic insights into resting heart rate and its role in cardiovascular disease.
    van de Vegte YJ, Eppinga RN, van der Ende MY, Hagemeijer YP, Mahendran Y, Salfati E, Smith AV, Tan VY, Arking DE, Ntalla I, Appel EV, Schurmann C, Brody JA, Rueedi R, Polasek O, Sveinbjornsson G, Lecoeur C, Ladenvall C, Zhao JH, Isaacs A, Wang L, Luan J, Hwang SJ, Mononen N, Auro K, Jackson AU, Bielak LF, Zeng L, Shah N, Nethander M, Campbell A, Rankinen T, Pechlivanis S, Qi L, Zhao W, Rizzi F, Tanaka T, Robino A, Cocca M, Lange L, Müller-Nurasyid M, Roselli C, Zhang W, Kleber ME, Guo X, Lin HJ, Pavani F, Galesloot TE, Noordam R, Milaneschi Y, Schraut KE, den Hoed M, Degenhardt F, Trompet S, van den Berg ME, Pistis G, Tham YC, Weiss S, Sim XS, Li HL, van der Most PJ, Nolte IM, Lyytikäinen LP, Said MA, Witte DR, Iribarren C, Launer L, Ring SM, de Vries PS, Sever P, Linneberg A, Bottinger EP, Padmanabhan S, Psaty BM, Sotoodehnia N, Kolcic I; DCCT/EDIC Research Group; Arnar DO, Gudbjartsson DF, Holm H, Balkau B, Silva CT, Newton-Cheh CH, Nikus K, Salo P, Mohlke KL, Peyser PA, Schunkert H, Lorentzon M, Lahti J, Rao DC, Cornelis MC, Faul JD, Smith JA, Stolarz-Skrzypek K, Bandinelli S, Concas MP, Sinagra G, Meitinger T, Waldenberger M, Sinner MF, Strauch K, Delgado GE, Taylor KD, Yao J,… See abstract for full author list ➔ van de Vegte YJ, et al. Nat Commun. 2023 Aug 2;14(1):4646. doi: 10.1038/s41467-023-39521-2. Nat Commun. 2023. PMID: 37532724 Free PMC article.
  • A large genome-wide association study of QT interval length utilizing electronic health records.
    Hoffmann TJ, Lu M, Oni-Orisan A, Lee C, Risch N, Iribarren C. Hoffmann TJ, et al. Genetics. 2022 Nov 30;222(4):iyac157. doi: 10.1093/genetics/iyac157. Genetics. 2022. PMID: 36271874 Free PMC article.

References

    1. AlGhatrif M, and Lindsay J (2012). A brief review: history to understand fundamentals of electrocardiography. J. Community Hosp. Intern. Med. Perspect 2. - PMC - PubMed
    1. Arking DE, Pulit SL, Crotti L, Van Der Harst P, Munroe PB, Koopmann TT, Sotoodehnia N, Rossin EJ, Morley M, Wang X, et al. (2014). Genetic association study of QT interval highlights role for calcium signaling pathways in myocardial repolarization. Nat. Genet 46, 826–836. - PMC - PubMed
    1. Bastiaenen R, Nolte IM, Munroe PB, Riese H, Nelson C, O’Connor H, Gang Y, Warren HR, Cabrera C, Reinhard W, et al. (2019). The narrow-sense and common single nucleotide polymorphism heritability of early repolarization. Int. J. Cardiol 279, 135–140. - PubMed
    1. Bihlmeyer NA, Brody JA, Smith AV, Warren HR, Lin H, Isaacs A, Liu CT, Marten J, Radmanesh F, Hall LM, et al. (2018). ExomeChip-wide analysis of 95 626 individuals identifies 10 novel loci associated with QT and JT intervals. Circ. Genom. Precis. Med 11, e001758. - PMC - PubMed
    1. Bozkurt B, Colvin M, Cook J, Cooper LT, Deswal A, Fonarow GC, Francis GS, Lenihan D, Lewis EF, McNamara DM, et al. (2016). Current diagnostic and treatment strategies for specific dilated cardiomyopathies: a scientific statement from the American Heart Association. Circulation 134, e579–e646. - PubMed

Publication types