. 2020 Oct 6;32(4):575-590.e7.
doi: 10.1016/j.cmet.2020.08.012. Epub 2020 Sep 10.

Warmth Prevents Bone Loss Through the Gut Microbiota

Affiliations

Warmth Prevents Bone Loss Through the Gut Microbiota

Claire Chevalier et al. Cell Metab. .

Abstract

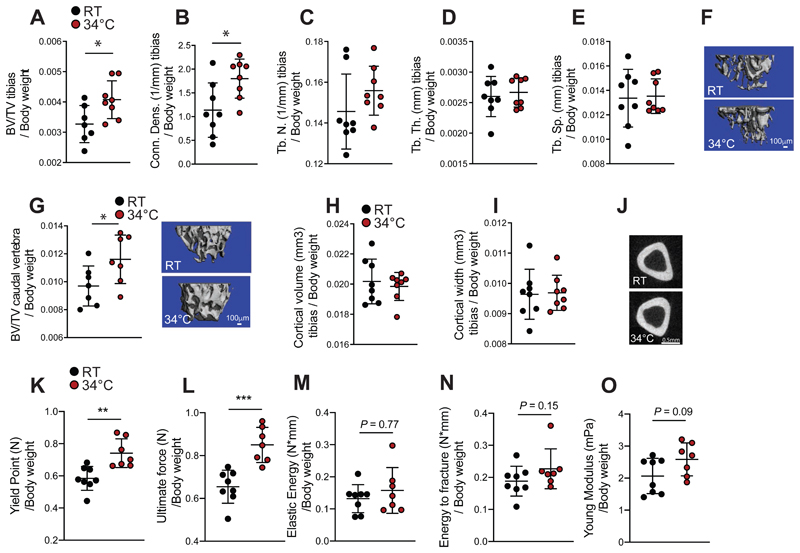
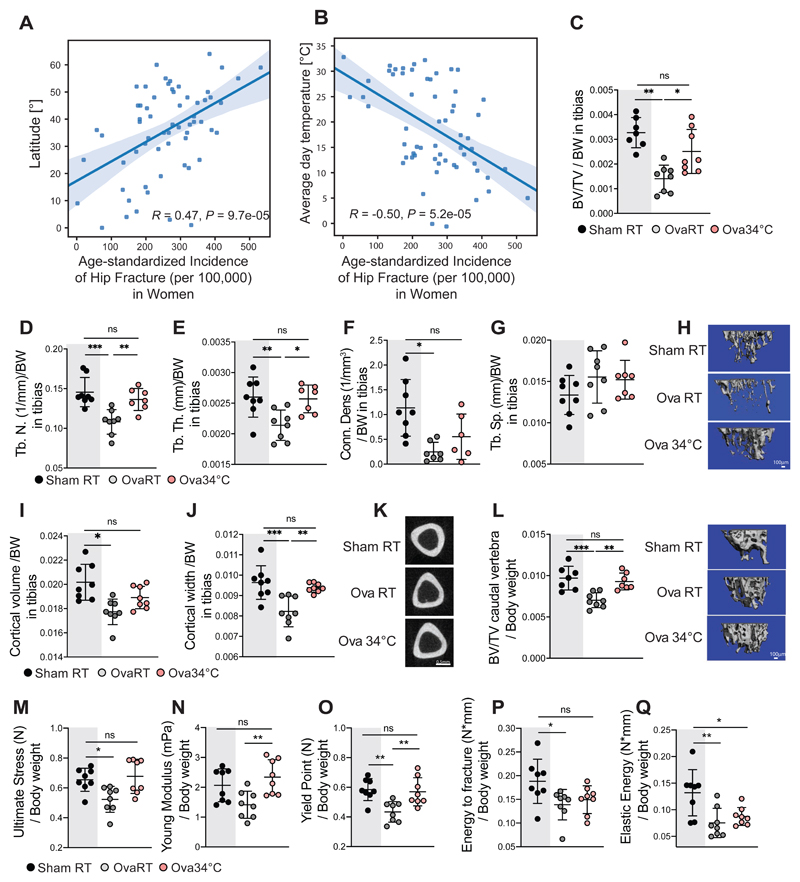
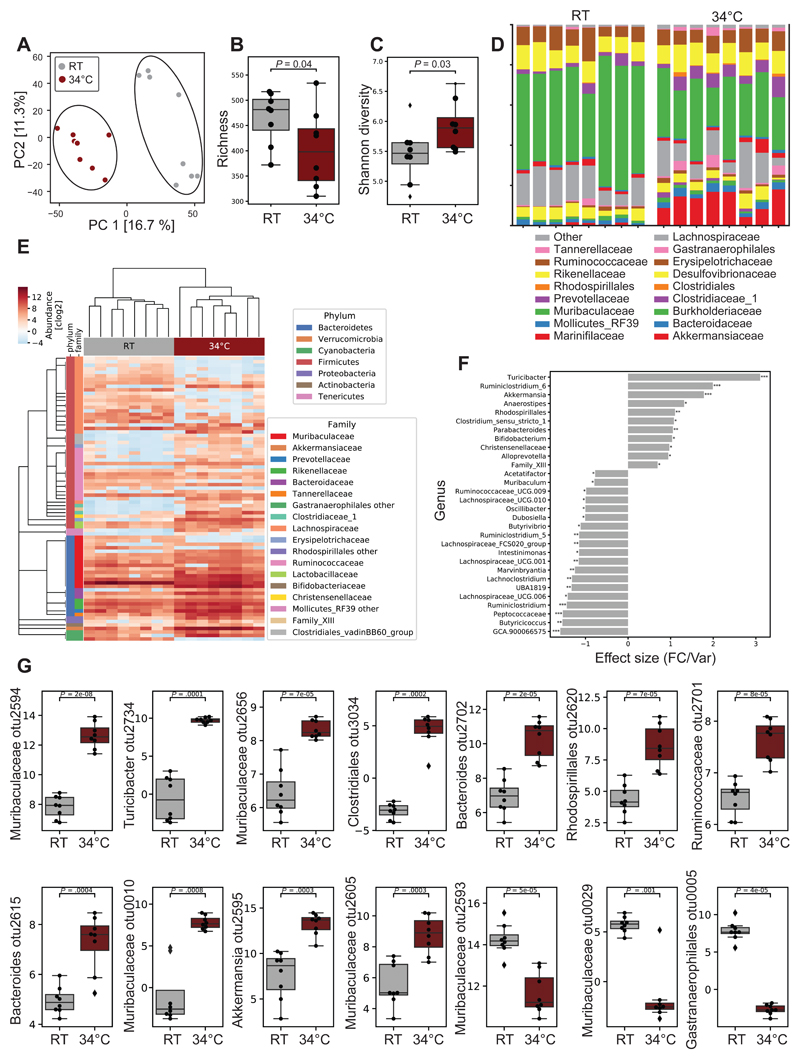
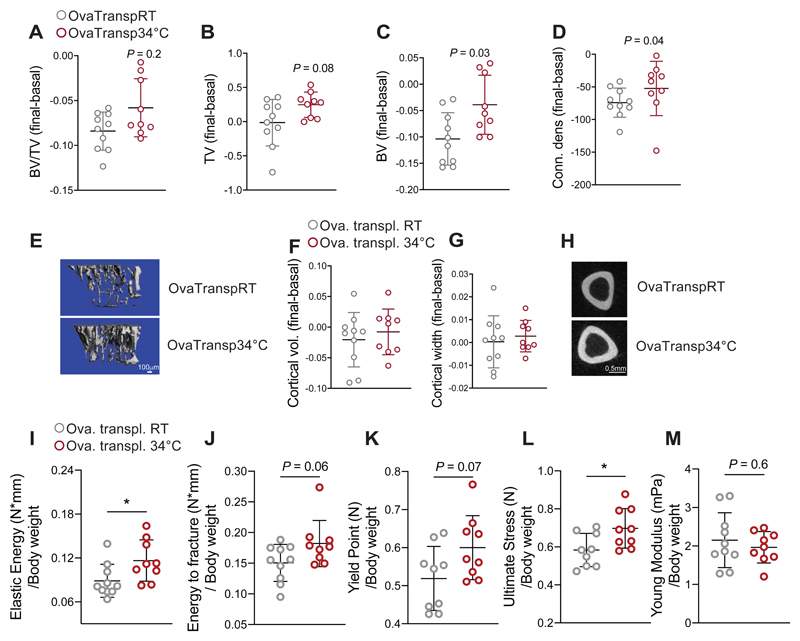
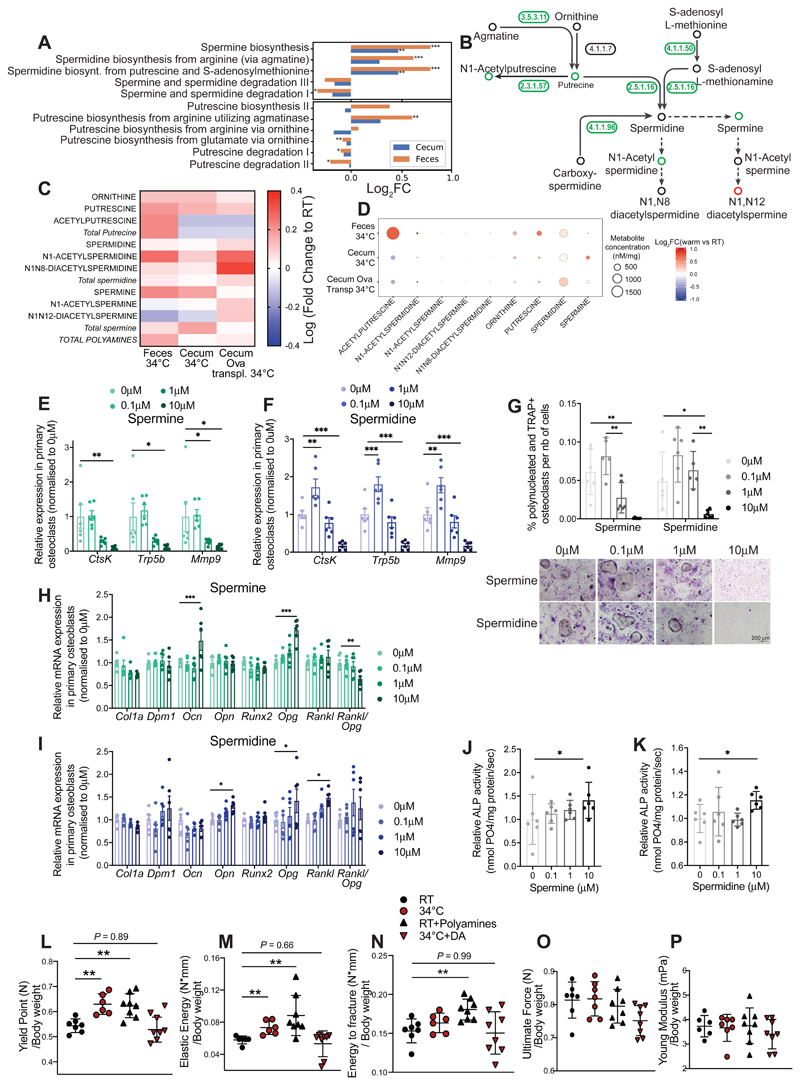
Osteoporosis is the most prevalent metabolic bone disease, characterized by low bone mass and microarchitectural deterioration. Here, we show that warmth exposure (34°C) protects against ovariectomy-induced bone loss by increasing trabecular bone volume, connectivity density, and thickness, leading to improved biomechanical bone strength in adult female, as well as in young male mice. Transplantation of the warm-adapted microbiota phenocopies the warmth-induced bone effects. Both warmth and warm microbiota transplantation revert the ovariectomy-induced transcriptomics changes of the tibia and increase periosteal bone formation. Combinatorial metagenomics/metabolomics analysis shows that warmth enhances bacterial polyamine biosynthesis, resulting in higher total polyamine levels in vivo. Spermine and spermidine supplementation increases bone strength, while inhibiting polyamine biosynthesis in vivo limits the beneficial warmth effects on the bone. Our data suggest warmth exposure as a potential treatment option for osteoporosis while providing a mechanistic framework for its benefits in bone disease.

Keywords: bone; metabolomics; metadata; metagenomics; microbiota; osteoporosis; ovariectomy; polyamines; post-menopause; warm.


Conflict of interest statement

Declaration of Interests M.T. and C.C. disclose that they are inventors of a submitted patent application for treatment of bone diseases. All other authors declare no competing interests.

Figures

Figure 1
Figure 1. Warmth Exposure Improves Bone Strength during Adulthood
(A-F) Trabecular bone microarchitecture of tibias showing bone volume/total volume (BV/TV) (A), connectivity density (Conn. Dens) (B), number of trabeculae (Tb. N) (C), trabecular thickness (Tb.Th.) (D) and trabecular separation (Tb.Sp) (E) of 24 week-old female mice exposed to 34°C for 2 month prior sacrifice and their RT controls (n = 8 per group), all normalized to body weight. (F) Representative reconstruction of trabecular bone used for the calculations in A-F. Scale = 100μm. Each trabecular reconstruction was done by scanning and compiling 262 sections from the beginning of the growth plate to the midshaft in each mouse using n = 8 per group. (G-I) Cortical bone volume (G) and width (H) of mice as in (A), measured in midshaft of the tibias and normalized to body weight. (G right) Representative reconstruction (each consisting of 262 sections, n = 8 per group) of trabecular bone used for calculation. Scale = 100μm. (I) Representative cortical section (from 62 sections per bone of each mouse of n = 8 per group). Scale: 0.5mm. (J) Bone volume/total volume (BV/TV) (left), measured in the caudal vertebra (CA2) (normalized to body weight) of mice as in (A). (K-O) Biomechanical analysis of femur from mice as in (A) using a 3-point bending test. The parameters measured include the yield point (K), the ultimate force (L), the elastic energy (M), the energy to fracture (N) and the Young’s modulus (O) and normalized to their respected body weight. Data are shown as mean ± SD (n = 8 per group). Significance (P value) is calculated using Mann-Whitney t-test *P < 0.05; **P < 0.01; ***P < 0.001.
Figure 2
Figure 2. Warmth Exposure Protects Against Osteoporosis
(A and B) Metadata analysis showing age-standardized correlation between hip fracture incidence (per 100’000 inhabitants) in women per country, versus the latitude of the country’s capitals (A), or versus the country’s average day temperature (B). (C-H) Trabecular bone microarchitecture of tibias in female mice that were ovariectomized, or sham-operated at 16 weeks of age, and then exposed to 34°C for 2 months (Ova34°C, or Sham34°C, respectively), or kept at RT (OvaRT, or ShamRT). Bone volume/total volume (BV/TV) (C), the number of trabeculae (Tb. N) (D), the trabecular thickness (Tb.Th.) (E), the connectivity density (Conn. Dens) (F), and the trabecular separation (Tb.Sp) (G) from the mice as in (C) at the end of the warm exposure, normalized to their respective body weight. (H) Representative reconstruction (each consisting of 262 sections, n = 8 per group) of trabecular bone used for calculations. Scale: 100μm. (I-K) Cortical bone volume (I) and width (J) of mice as in (C) measured in the midshaft of the tibias and normalized to the body weight. (K) Representative cortical sections from each group (from 62 sections per bone of each mouse of n = 8 per group). Scale: 0.5mm. (L) Trabecular bone volume/tissue volume (BV/TV), measured in the caudal vertebra (CA2) (normalized to body weight) of mice as in (C). Right, representative reconstruction (each consisting of 262 sections, n = 8 per group) of a vertebra used for calculation. Scale: 100μm (M-Q) Biomechanical analysis of femur from mice as in (C) showing ultimate stress (M), Young’s modulus (N), yield point (O), energy to fracture (P) and elastic energy (Q), all normalized to the body weight. Data are shown as mean ± SD (n = 8 per group). Significance (P value) is calculated using Mann-Whitney t-test: *P < 0.05; **P < 0.01; ***P < 0.001. Sham RT mice (as shown in Figure 1) are shadowed in grey.
Figure 3
Figure 3. Warmth Exposure Changes the Gut Microbiota Composition
(A) Principal component analysis (PCA) of 16S rDNA sequencing of fecal microbiota from 24 weeks old female mice exposed for 2 months to 34°C, or kept at RT. Each dot represents a fecal microbiota from one mouse. The analysis is based on the centric log2 ratio (CLR). (B and C) Estimated richness (B) and Shannon diversity (C) of microbiota samples as in (A). (D) Bar chart of the relative microbiome abundance at family level from mice as in (A). (E) Hierarchical clustering associated with a heatmap comparing the CLRs of the OTUs selected for a P < 0.05 of mice as in (A). An idealized tree represents their taxonomic hierarchy down to genus level associated with bars that are color-coded for phylum and family. Each column represents one mouse. (F) Effect size of all significantly changed genera calculated with aldex2 (FDR<0.05) in samples from mice as in (A). (G) CLRs representing relative abundance of the most changed OTUs (FDR<0.01) by warm exposure in samples from mice as in (A). Boxplots represent median and quantiles; the whiskers show 1.5 inter quartile range and values outside the whisker’s box are represented as diamonds. Data are shown as mean ± SD (n = 8 per group). Significance in (F) and (G) is calculated using Welch t-test: *P < 0.05; **P < 0.01; ***P < 0.001.
Figure 4
Figure 4. Warm–Microbiota Transplantation Prevents Bone Loss and Improves Bone Strength
(A-E) Delta between two Micro-CT measurements (day 0 and day 32 after starting the microbiota transplantation) of proximal tibias at trabecular level in 21 weeks old ovariectomized, microbiota recipient female mice. The recipient mice were ovariectomized at week 16, and repetitivelly transplanted with fecal microbiota from 34°C exposed, or RT-kept donors (OvaTransp34°C, or OvaTranspRT, respectively). The 34°C treatment of the 16 weeks old female donor mice was initiated one month before the starting the transplantations, and lasted for the whole length of the experiment. Bone volume/tissue volume (BV/TV) (A), bone volume (BV), (B) total volume (TV) (C), and connectivity density (D). (E) Representative reconstruction (each consisting of 262 sections, n = 10 per group) of trabecular bone use for the calculations. Scale: 100μm. (F-H) Cortical bone volume (F) and width (G) measured in midshaft of tibias from mice as in (A). (H) representative cortical section (from 62 sections per bone of each mouse of n = 10 per group), scale: 0.5mm. (I-M) Biomechanical analysis of tibias from mice as in (A) showing elastic energy (I), energy to fracture (J), yield point (K), ultimate stress (L) and Young’s modulus (M), all normalized to their body weights. Data are shown as mean ±SD (n = 10 per group). Significance is calculated using Mann-Whitney t-test *P < 0.05; **P < 0.01; ***P < 0.001.
Figure 5
Figure 5. Warmth and Warm–Microbiota Transplantation Ameliorate Ovariectomy–Induced Transcriptional Deregulation
(A) Mean-difference plot (MD-plot) of the log fold change gene expression between tibias of 24 weeks old female mice that were ovariectomized or sham-operated at 16 weeks of age, and then kept at RT for two months (OvaRT vs ShamRT, respectively) shown as average count per million (CPM). Red dots show the increased and blue show the decreased genes selected for FDR<0.05. (B) MD-plot of the log fold change of gene expression between tibias of 24 weeks old female mice that were ovariectomized at 16 weeks of age and then kept at 34°C for two months (Ova34), versus ShamRT, shown as average count per million (CPM). Red dots show increased and blue show decreased genes selected for FDR<0.05. (C) Comparison between the log fold change of genes deregulated by ovariectomy at RT shown in red (|log2FC| > 1; OVART vs ShamRT) and the same genes when exposing the ovariectomized-mice at 34°C shown in blue (|log2FC| > 1; Ova34°C vs ShamRT). (D) Top 10 most deregulated Reactome pathways between tibias of Ova RT and Ova34°C mice. (E) Volcano-plot comparing the p-value and the log fold change of gene expression between tibias of 21 weeks old ovariectomized, microbiota recipient female mice (OvaTransp34°C, or OvaTranspRT) as in Figure 4A-E. Green dots: (|log2FC| > 1; blue dots: P < 0.01; red dots: P <0.01 and (|log2FC| > 1. (F and G) Expression analysis of the ovariectomy-altered genes ((|log2FC| > 1) at RT (OvaRT vs shamRT)) in tibia from OvaTransp34°C mice compared to the OvaTranspRT controls (OvaTransp34°C vs. OvaTranspRT). In (F) blue and red show genes (up- or downregulated, respectively) unaltered by microbiota transplantation. Green show genes with reduced or reverted expression when mice are transplanted with warm-microbiota. (G) Comparison between the log fold changes of genes (|log2FC| > 1) as in (C) using the groups of mice from (F): OvaRT vs ShamRT (red) and OvaTransp34°C vs. OvaTranspRT (blue). (H) Top 10 most deregulated reactome pathways between tibias from OvaTransp34°C and OvaTranspRT mice. (I) Top 10 most deregulated reactome pathways between tibias from 34°C and RT mice.
Figure 6
Figure 6. Warmth and Warm–Microbiota Transplantation Increase Periosteal Bone Formation
(A-C) Periosteal (A) and endocortical (B) mineralized surface after calcein injection in 24 weeks old female mice that were ovariectomized at 16 weeks of age and exposed for 2 months to 34°C, or kept at RT. (C) Representative images (of n = 6) of fluorescent calcein in femur midshaft used for the quantifications. (D) Osteocalcin levels in plasma of mice as in (A). (E-I) Periosteal mineralized surface (E), periosteal mineral apposition rate (MAR) (F), endocortical mineralized surface (G), and endocortical MAR (H) in tibias of 21 weeks old ovariectomized, microbiota recipient female mice (OvaTransp34°C, or OvaTranspRT) as in Figure 4A-E (I) Representative images (of n = 6) of fluorescent calcein in femur midshaft used for the quantifications. Scale: 0.5mm. (J-L) Tartrate-resistant acid phosphatase (TRAP) staining quantification of osteoclast number in femur trabeculae of mice as in (A) shown in panel (J), and of mice as in (E) shown in panel (K). (L) Representative images (of n = 6) of the quantifications shown in (J) and (K). Arrowheads correspond to the TRAP signal. Scale: 50μm. (M) CTX-1 levels in plasma of mice as in (J) and (K). Data are shown as mean ± SD (n = 6 per group). Significance (p-value) is calculated using Mann-Whitney t-test: *P < 0.05; **P < 0.01; ***P < 0.001.
Figure 7
Figure 7. Microbial Production of Polyamines Mediate the Warmth Effects on the Bone.
(A) Bar chart representing metagenomics analysis of the bacterial polyamine biosynthetic and degradation pathways in feces and cecum samples from 24 weeks old female mice that were exposed to 34°C for 2 months, or kept at RT. Significance shows false discovery rate (FDR): *P < 0.05; **P < 0.01; ***P < 0.001. (B) Graphical representation of the polyamine biosynthetic pathway where numbers (enzymes from keg nomenclature) represent the level of respective genes present in the gut microbiota from fecal samples of mice as in (A). Green–coloured circles show increase, red–coloured show decrease, and black–coloured indicate unchanged concentrations after warm exposure. 3.5.3.11: agmatinase, 4.1.1.7: benzoylformate decarboxylase, 2.3.1.57: putrescine acetyltransferase / spermine-spermidine N1-acetyltransferase, 4.1.1.50: adenosylmethionine decarboxylase, 2.5.1.16: spermidine synthase, 4.1.1.96: carboxynorspermidine decarboxylase. (C and D) Heatmap (C), or heatmap associated with absolute polyamine levels (D), showing fold change of polyamines measured using hydrophilic interaction liquid chromatography coupled to tandem mass spectrometry (HILIC - MS/MS) in feces or cecum samples from 24 weeks old female mice that were exposed to 34°C for 2 months versus RT controls (34°C vs. RT; Feces 34°C and Cecum 34°C); or cecum of 21 weeks old ovariectomized, microbiota recipient female mice (Cecum Ova transpl34°C). (E and F) Relative mRNA expression levels in cultured primary osteoclasts subjected to different spermine (E) or spermidine (F) concentrations, measured by qPCR. (G) Quantification of the polynucleated and TRAP+ differentiated osteoclasts normalized to the total number of cells in presence of spermine or spermidine. (Below) Representative images (from 6 wells per condition) from TRAP staining of osteoclasts differentiated in presence of spermine or spermidine. Scale: 200 μm. (H and I) Relative mRNA expression levels in cultured primary osteoblasts subjected to different spermine (H) or spermidine (I) concentrations, measured by qPCR. (J and K) Relative alkaline phosphatase (ALP) activity in osteoblast culture after spermine (J) or spermidine (K) supplementation at different concentrations. Significance (p-value) in all panels except (A and L-P) is calculated using Mann-Whitney t-test: *P < 0.05; **P < 0.01; ***P < 0.001. (L-P) Biomechanical analysis using 3–point bending test of femur from 23 weeks old female mice that were either RT kept (RT); warm exposed (34°C); supplemented with freshly prepared polyamine mix and RT kept (RT-Polyamines); or provided with 50μm Diaminazene Acetureate (DA) and kept at 34°C (34°C-DA), starting at 16 weeks of age until sacrifice. Polyamines and DA were supplemented in drinking water every second day. The panels show yield point (L), elastic energy (M), energy to fracture (N), ultimate force (O), and Young’s modulus (O) that are normalized to their bodyweight values at sacrifice. Data are shown as mean ±SD (n = 8 per group). Significance is calculated based on One-Way ANOVA: *P < 0.05; **P < 0.01; ***P < 0.001.

Comment in

  • Warmth prevents bone loss.
    Starling S. Starling S. Nat Rev Endocrinol. 2020 Dec;16(12):679. doi: 10.1038/s41574-020-00424-7. Nat Rev Endocrinol. 2020. PMID: 32963341 No abstract available.
  • Getting Warmer: Following One's Gut to Build Bone.
    Iqbal J, Yuen T, Zaidi M. Iqbal J, et al. Cell Metab. 2020 Oct 6;32(4):504-506. doi: 10.1016/j.cmet.2020.09.010. Cell Metab. 2020. PMID: 33027670 Free PMC article.

References

    1. Alhilli F, Wright EA. The Effects of Changes in the Environmental-Temperature on the Growth of Tail Bones in the Mouse. Brit J Exp Pathol. 1983;64:34–42. - PMC - PubMed
    1. Allen J. The influence of Physical conditions in the genesis of species. Radical Review. 1877;1:108–140.
    1. Aramaki T, Blanc-Mathieu R, Endo H, Ohkubo K, Kanehisa M, Goto S, Ogata H. KofamKOALA: KEGG ortholog assignment based on profile HMM and adaptive score threshold. Bioinformatics. 2019 - PMC - PubMed
    1. Ashoub MA. Effect of two extreme temperatures on growth and tail-length of mice. Nature. 1958;181:284. - PubMed
    1. Balk EM, Adam GP, Langberg VN, Earley A, Clark P, Ebeling PR, Mithal A, Rizzoli R, Zerbini CAF, Pierroz DD, et al. Global dietary calcium intake among adults: a systematic review. Osteoporos Int. 2017;28:3315–3324. - PMC - PubMed

Publication types