. 2020 Oct 13;15(4):955-967.
doi: 10.1016/j.stemcr.2020.08.005. Epub 2020 Sep 10.

FGFR3 in Periosteal Cells Drives Cartilage-to-Bone Transformation in Bone Repair

Affiliations

FGFR3 in Periosteal Cells Drives Cartilage-to-Bone Transformation in Bone Repair

Anais Julien et al. Stem Cell Reports. .

Abstract

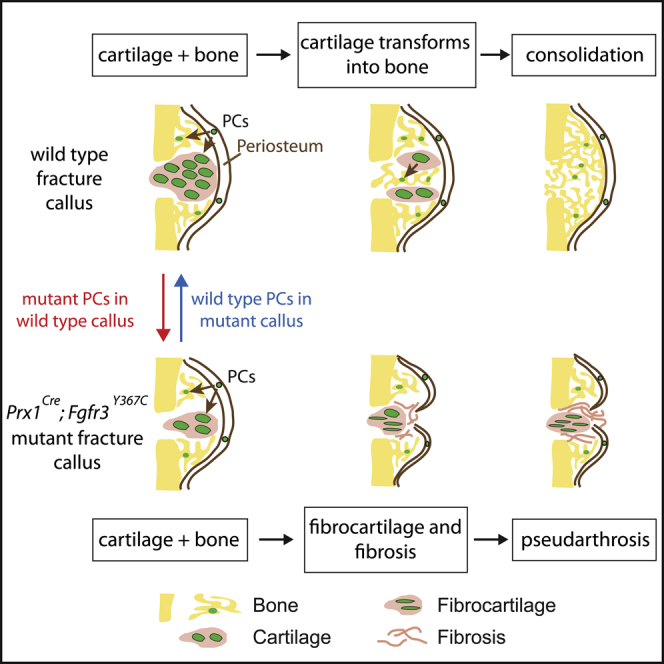
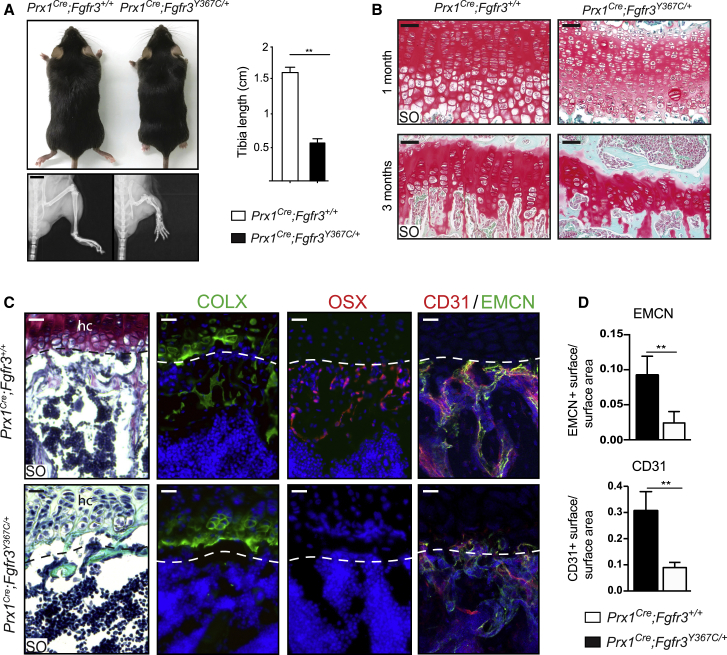
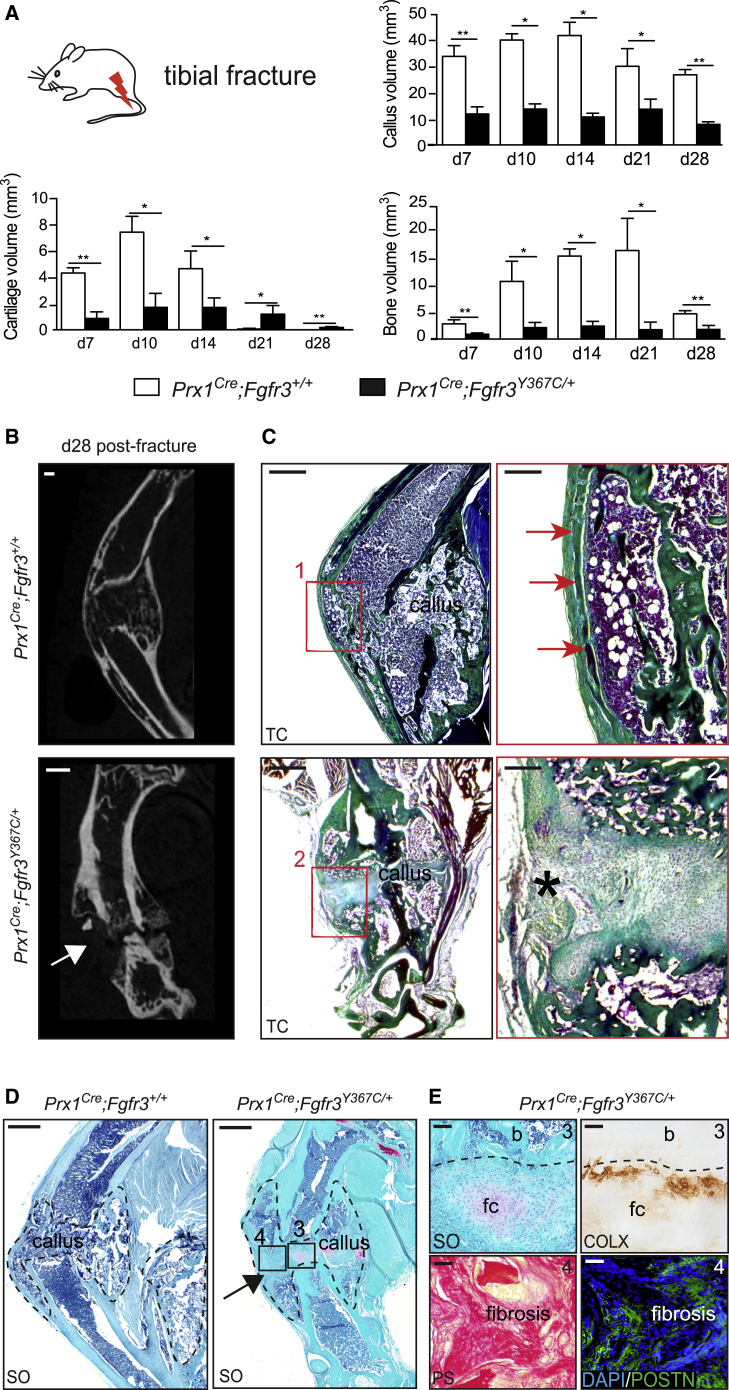
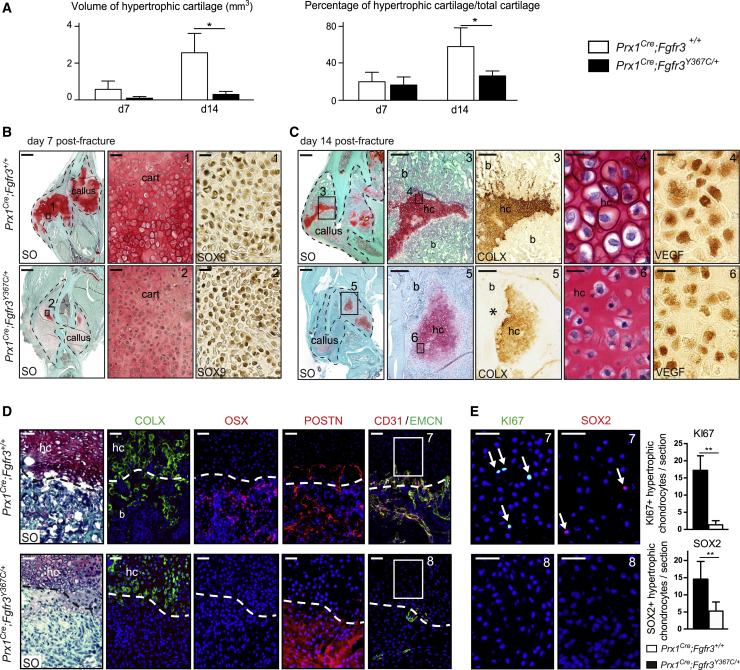
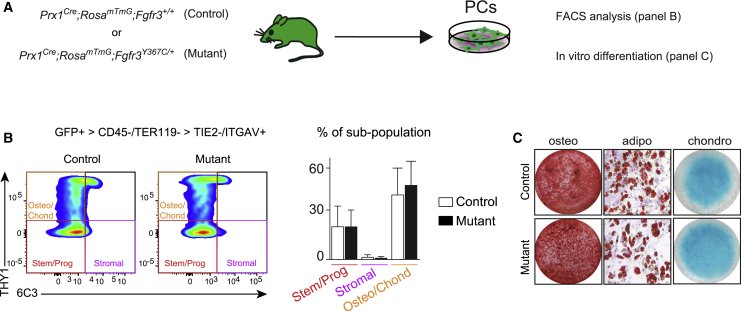
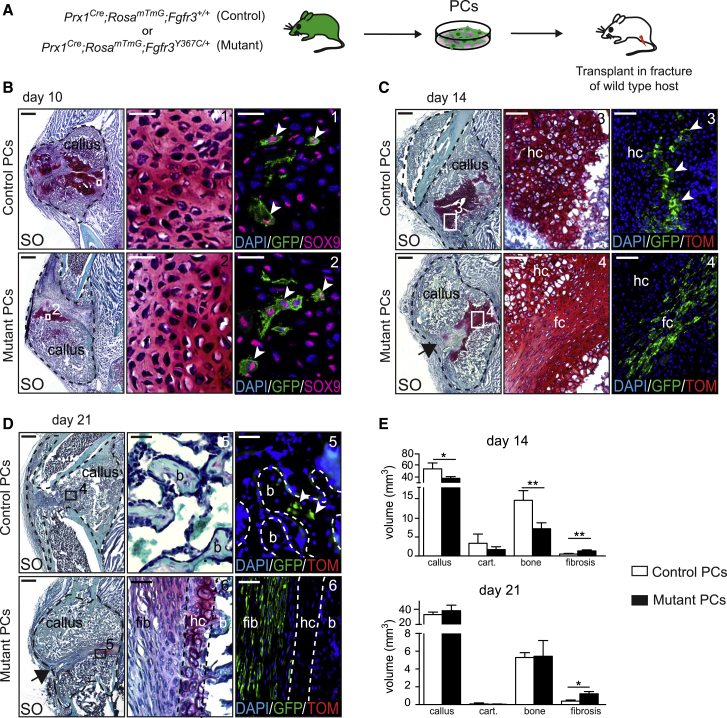
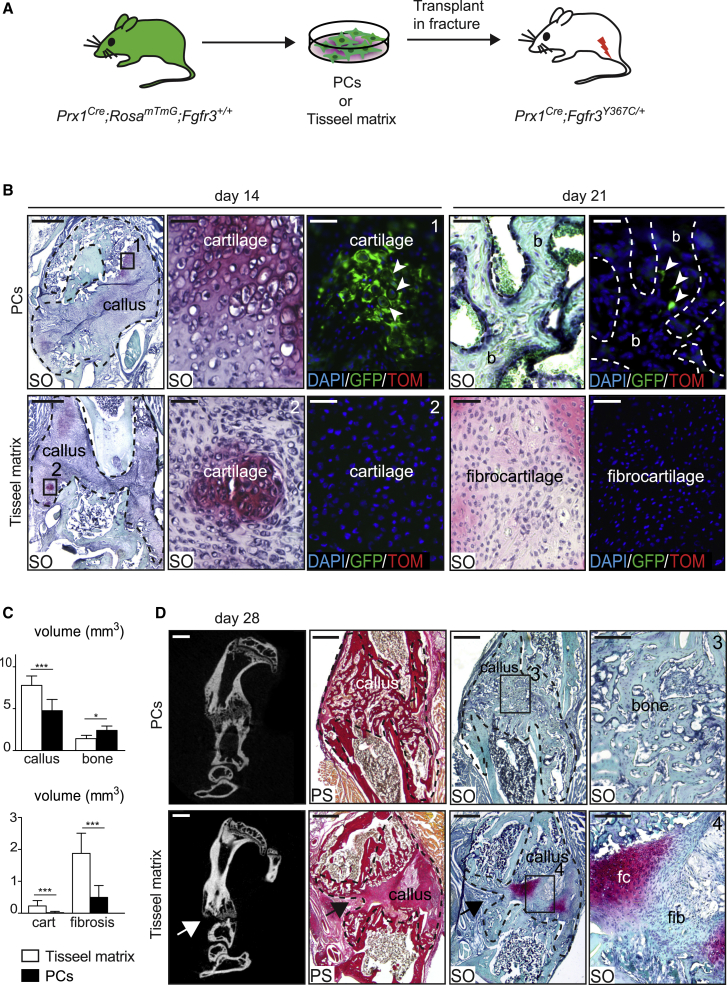
Most organs and tissues in the body, including bone, can repair after an injury due to the activation of endogenous adult stem/progenitor cells to replace the damaged tissue. Inherent dysfunctions of the endogenous stem/progenitor cells in skeletal repair disorders are still poorly understood. Here, we report that Fgfr3Y637C/+ over-activating mutation in Prx1-derived skeletal stem/progenitor cells leads to failure of fracture consolidation. We show that periosteal cells (PCs) carrying the Fgfr3Y637C/+ mutation can engage in osteogenic and chondrogenic lineages, but following transplantation do not undergo terminal chondrocyte hypertrophy and transformation into bone causing pseudarthrosis. Instead, Prx1Cre;Fgfr3Y637C/+ PCs give rise to fibrocartilage and fibrosis. Conversely, wild-type PCs transplanted at the fracture site of Prx1Cre;Fgfr3Y637C/+ mice allow hypertrophic cartilage transition to bone and permit fracture consolidation. The results thus highlight cartilage-to-bone transformation as a necessary step for bone repair and FGFR3 signaling within PCs as a key regulator of this transformation.

Keywords: FGFR3; bone repair; endochondral ossification; periosteum; pseudarthrosis; skeletal stem/progenitor cell.


Figures

None
Graphical abstract
Figure 1
Figure 1
Reduced Tibia Length and Abnormal Tibial Epiphyseal Cartilage Organization in Prx1Cre;Fgfr3Y367C/+ Mice (A) Three-month-old Prx1Cre;Fgfr3Y367C/+ and Prx1Cre;Fgfr3+/+ mice (top), radiographs of hindlimbs (bottom), and quantification of tibia length (right) (n = 5 per group). Scale bar, 0.5 cm. (B) Representative Safranin O (SO) staining of epiphyseal cartilage of uninjured tibia from 1- to 3 month-old Prx1Cre;Fgfr3+/+ and Prx1Cre;Fgfr3Y367C/+ mice. Scale bar, 50 μm. (C) Immunofluorescence of Collagen X (COLX), Osterix (OSX), and CD31/Endomucin (EMCN) at the transition zone between the epiphyseal hypertrophic cartilage (hc) and the metaphysis in uninjured tibia from 3 months old Prx1Cre;Fgfr3+/+ and Prx1Cre;Fgfr3Y367C/+ mice (n = 3). Scale bar, 50 μm. (D) Quantification of CD31 and EMCN immunofluorescence at the transition zone between the epiphyseal cartilage and the metaphysis from Prx1Cre;Fgfr3+/+ and Prx1Cre;Fgfr3Y367C/+ mice (n = 6). Values represent mean ± SD. ∗∗p < 0.01 using Mann-Whitney test.
Figure 2
Figure 2
Altered Bone Regeneration and Pseudarthrosis in Prx1Cre;Fgfr3Y367C/+ Mice (A) Histomorphometric analyses of callus, cartilage, and bone volumes at days 7, 10, 14, 21, and 28 post-fracture in Prx1Cre;Fgfr3+/+ and Prx1Cre;Fgfr3Y367C/+ mice (n = 4 or 5 per group). (B) Representative micro-CT images of Prx1Cre;Fgfr3+/+ and Prx1Cre;Fgfr3Y367C/+ calluses at 28 days post-fracture. White arrow points to the absence of bone bridging in Prx1Cre;Fgfr3Y367C/+ callus (n = 4–5 per group). Scale bar, 1 mm. (C) Longitudinal sections stained with Masson's trichrome (TC) of Prx1Cre;Fgfr3+/+ and Prx1Cre;Fgfr3Y367C/+ calluses 28 days post-fracture. High magnification showing continuity of the newly formed cortex in Prx1Cre;Fgfr3+/+ callus (box 1, red arrows) and absence of new bone in the center of Prx1Cre;Fgfr3Y367C/+ callus (box 2, asterisk). Scale bars, 1 mm (left) and 300 μm (right). (D) Longitudinal sections stained with SO of Prx1Cre;Fgfr3+/+ and Prx1Cre;Fgfr3Y367C/+ calluses 28 days post-fracture (callus delimited with a black dotted line). Scale bar, 1 mm. (E) High magnification of fibrocartilage (fc) stained with SO and COLX immunostaining showing few COLX+ cells adjacent to fibrocartilage and bone (b) in Prx1Cre;Fgfr3Y367C/+ callus (box 3, top). High magnification of fibrosis stained with Picrosirius (PS) and Periostin (POSTN) immunostaining in Prx1Cre;Fgfr3Y367C/+ callus (box 4, bottom). Scale bar, 100 μm. Values represent mean ± SD. p < 0.05, ∗∗p < 0.01 using Mann-Whitney test.
Figure 3
Figure 3
Impaired Cartilage Differentiation and Cartilage-to-Bone Transition in Prx1Cre;Fgfr3Y367C/+ Fracture Callus (A) Histomorphometric quantification of hypertrophic cartilage volume and percentage of hypertrophic cartilage volume in total cartilage volume at days 7 and 14 post tibial fracture in Prx1Cre;Fgfr3+/+ and Prx1Cre;Fgfr3Y367C/+ mice (n = 4 or 5 per group). (B) Longitudinal sections of Prx1Cre;Fgfr3+/+ (control) and Prx1Cre;Fgfr3Y367C/+ (mutant) calluses (delimited with a black dotted line) at day 7 post-fracture stained with SO. High magnification of cartilage area (box 1, 2) and SOX9 immunostaining showing the presence of chondrogenic cells in the callus of control and mutant mice. Scale bars, 1 mm and 50 μm (boxes 1 and 2). (C) Longitudinal sections of Prx1Cre;Fgfr3+/+ and Prx1Cre;Fgfr3Y367C/+ calluses at day 14 post-fracture stained with SO. High magnification of hypertrophic cartilage (hc) area (box 3, 5) and COLX immunostaining on adjacent sections showing positive staining in control and mutant hc, and within new bone trabeculae (b) in control but not in mutant (asterisk). High magnification of hypertrophic chondrocytes (box 4, 6) and VEGF immunostaining showing abnormal cellular size and shape in mutant. Scale bars, 1 mm, 300 μm (boxes 3 and 5), and 25 μm (boxes 4 and 6). (D) Immunostaining for COLX, OSX, Periostin (POSTN), and CD31/EMCN at the cartilage-to-bone transition zone in Prx1Cre;Fgfr3+/+ and Prx1Cre;Fgfr3Y367C/+ calluses 14 days post-fracture (n = 5 per group). Scale bar, 50 μm. (E) High magnification of cartilage area next to bone and immunostaining for KI67 and SOX2 (box 7 and 8). Quantification of KI67+ and SOX2+ hypertrophic chondrocytes in day 14 post-fracture calluses from Prx1Cre;Fgfr3+/+ and Prx1Cre;Fgfr3Y367C/+ mice (n = 5 per group) Scale bar, 25 μm. Values represent the mean ± SD. ∗∗p < 0.01 using Mann-Whitney test.
Figure 4
Figure 4
In Vitro Characterization of Prx1Cre;Fgfr3Y367C/+ Periosteal Cells (A) Experimental design of Prx1Cre;RosamTmG;Fgfr3+/+ (control) and Prx1Cre;RosamTmG;Fgfr3Y367C/+ (mutant) PC analyses via flow cytometry and in vitro differentiation. (B) Representative fluorescence-activated cell sorting plots of GFP+ (Prx1-derived) PCs negative for hematopoietic and endothelial markers, and positive for ITGAV marker (left). Percentage of stem/progenitor (THY1/6C3 cells), stromal (THY1/6C3+ cells), and osteo/chondroprogenitor (THY1+/6C3 cells) sub-populations in GFP+ PCs as defined (Chan et al., 2015) (right) (n = 3 from 3 independent experiments per group). Values represent the mean ± SD. (C) Osteogenic (alizarin red staining), adipogenic (oil red O staining), and chondrogenic (Alcian blue staining) in vitro differentiation of control and mutant PCs (n = 3 from 3 independent experiments per group). Values represent the mean ± SD.
Figure 5
Figure 5
Transplantation of Prx1Cre;Fgfr3Y367C/+ Periosteal Cells Impairs Bone Healing (A) Experimental design of Prx1Cre;RosamTmG;Fgfr3+/+ (control) and Prx1Cre;RosamTmG;Fgfr3Y367C/+ (mutant) PC isolation and transplantation at the fracture site of wild-type host. (B) Lineage tracing of GFP+ control and mutant PCs at 10 days post-fracture. SO staining and SOX9 immunofluorescence on longitudinal sections of host calluses showing SOX9/GFP double-positive cells from control and mutant donor in the cartilage (box 1 and 2). Scale bars, 1 mm and 25 μm (high magnification). (C and D) Lineage tracing of GFP+ control and mutant PCs at days 14 (C) and 21 (D) post-transplantation. SO staining and DAPI/GFP/Tomato fluorescence on longitudinal sections of host calluses (black dotted line). (C) Control PCs differentiate into hypertrophic chondrocytes (hc) (box 3, white arrowhead) but mutant PCs form elongated fibrocartilage cells by day 14 (fc, box 4). (D) Control PCs give rise to osteocytes within new bone trabeculae (b, box 5, white arrowhead) in the center of the callus, whereas mutant PCs form fibrotic (fib, box 6) cells by day 21 leading to pseudarthrosis (black arrow) (n = 5 per group). Scale bars: 1 mm, 100 μm (C, high magnification), and 25 μm (D, high magnification). (E) Histomorphometric quantification of callus, cartilage, bone, and fibrosis volumes at days 14 and 21 post-fracture and PCs transplantation (n = 5 per group). Values represent mean ± SD. p < 0.05, ∗∗p < 0.01 using Mann-Whitney test.
Figure 6
Figure 6
Transplantation of PCs Corrects the Prx1Cre;Fgfr3Y367C/+ Pseudarthrosis Phenotype (A) Experimental design of transplantation of Tisseel matrix or Prx1Cre;RosamTmG;Fgfr3+/+ PCs at the fracture site of Prx1Cre;Fgfr3Y367C/+ hosts. (B) SO staining and DAPI/GFP/Tomato fluorescence on longitudinal sections of Prx1Cre;Fgfr3Y367C/+ calluses (delimited by a black dotted line) at days 14 and 21 post-fracture. GFP+ PCs form hypertrophic chondrocytes (box 1, white arrowheads) by day 14 and osteocytes (white arrow) within new bone (b, dotted line) by day 21 post-transplantation. By days 14 and 21, the center of mutant calluses transplanted with Tisseel matrix is composed of fibrocartilage (box 2, n = 4 or 5 per group). Scale bars, 1 mm, 100 μm (for d14, high magnification), and 25 μm (for d21, high magnification). (C) Histomorphometric quantification of callus, cartilage, bone, and fibrosis volumes at day 28 post-fracture (n = 9 or 11 per group). (D) Representative micro-CT images of Prx1Cre;Fgfr3Y367C/+ calluses by day 28 post-fracture showing bone bridging after PCs transplantation and absence of bone bridging (white arrow) after transplantation with Tisseel matrix. SO and PS staining on callus sections after transplantation of PCs showing complete ossification and absence of fibrocartilage and fibrous tissue accumulation (box 3, n = 7 cases out of 11). Representative callus sections confirm the presence of pseudarthrosis (black arrows) and at high magnification of fibrocartilage (fc) and fibrous tissue (fib) in mice transplanted with Tisseel matrix (box 4, n = 9 cases out of 9). Scale bars, 1 mm and 100 μm (high magnification). Values represent mean ± SD. ∗∗p < 0.01, ∗∗∗p < 0.005 using Mann-Whitney test.

References

    1. Abou-Khalil R., Yang F., Lieu S., Julien A., Perry J., Pereira C., Relaix F., Miclau T., Marcucio R., Colnot C. Role of muscle stem cells during skeletal regeneration. Stem Cells. 2015;33:1501–1511. - PubMed
    1. Abou-Khalil R., Yang F., Mortreux M., Lieu S., Yu Y.Y., Wurmser M., Pereira C., Relaix F., Miclau T., Marcucio R.S., Colnot C. Delayed bone regeneration is linked to chronic inflammation in murine muscular dystrophy. J. Bone Miner Res. 2014;29:304–315. - PMC - PubMed
    1. Bonaventure J., Rousseau F., Legeai-Mallet L., le Merrer M., Munnich A., Maroteaux P. Common mutations in the fibroblast growth factor receptor 3 (FGFR 3) gene account for achondroplasia, hypochondroplasia, and thanatophoric dwarfism. Am. J. Med. Genet. 1996;63:148–154. - PubMed
    1. Chan C.K., Seo E.Y., Chen J.Y., Lo D., Mcardle A., Sinha R., Tevlin R., Seita J., Vincent-Tompkins J., Wearda T. Identification and specification of the mouse skeletal stem cell. Cell. 2015;160:285–298. - PMC - PubMed
    1. Chen H., Sun X., Yin L., Chen S., Zhu Y., Huang J., Jiang W., Chen B., Zhang R., Chen L. PTH 1-34 ameliorates the osteopenia and delayed healing of stabilized tibia fracture in mice with achondroplasia resulting from gain-of-function mutation of FGFR3. Int. J. Biol. Sci. 2017;13:1254–1265. - PMC - PubMed

Publication types

LinkOut - more resources