. 2020 Sep 17;182(6):1460-1473.e17.
doi: 10.1016/j.cell.2020.08.007. Epub 2020 Sep 10.

Longitudinal Multi-omics Reveals Subset-Specific Mechanisms Underlying Irritable Bowel Syndrome

Affiliations

Longitudinal Multi-omics Reveals Subset-Specific Mechanisms Underlying Irritable Bowel Syndrome

Ruben A T Mars et al. Cell. .

Erratum in

  • Longitudinal Multi-omics Reveals Subset-Specific Mechanisms Underlying Irritable Bowel Syndrome.
    Mars RAT, Yang Y, Ward T, Houtti M, Priya S, Lekatz HR, Tang X, Sun Z, Kalari KR, Korem T, Bhattarai Y, Zheng T, Bar N, Frost G, Johnson AJ, van Treuren W, Han S, Ordog T, Grover M, Sonnenburg J, D'Amato M, Camilleri M, Elinav E, Segal E, Blekhman R, Farrugia G, Swann JR, Knights D, Kashyap PC. Mars RAT, et al. Cell. 2020 Nov 12;183(4):1137-1140. doi: 10.1016/j.cell.2020.10.040. Cell. 2020. PMID: 33186523 No abstract available.

Abstract

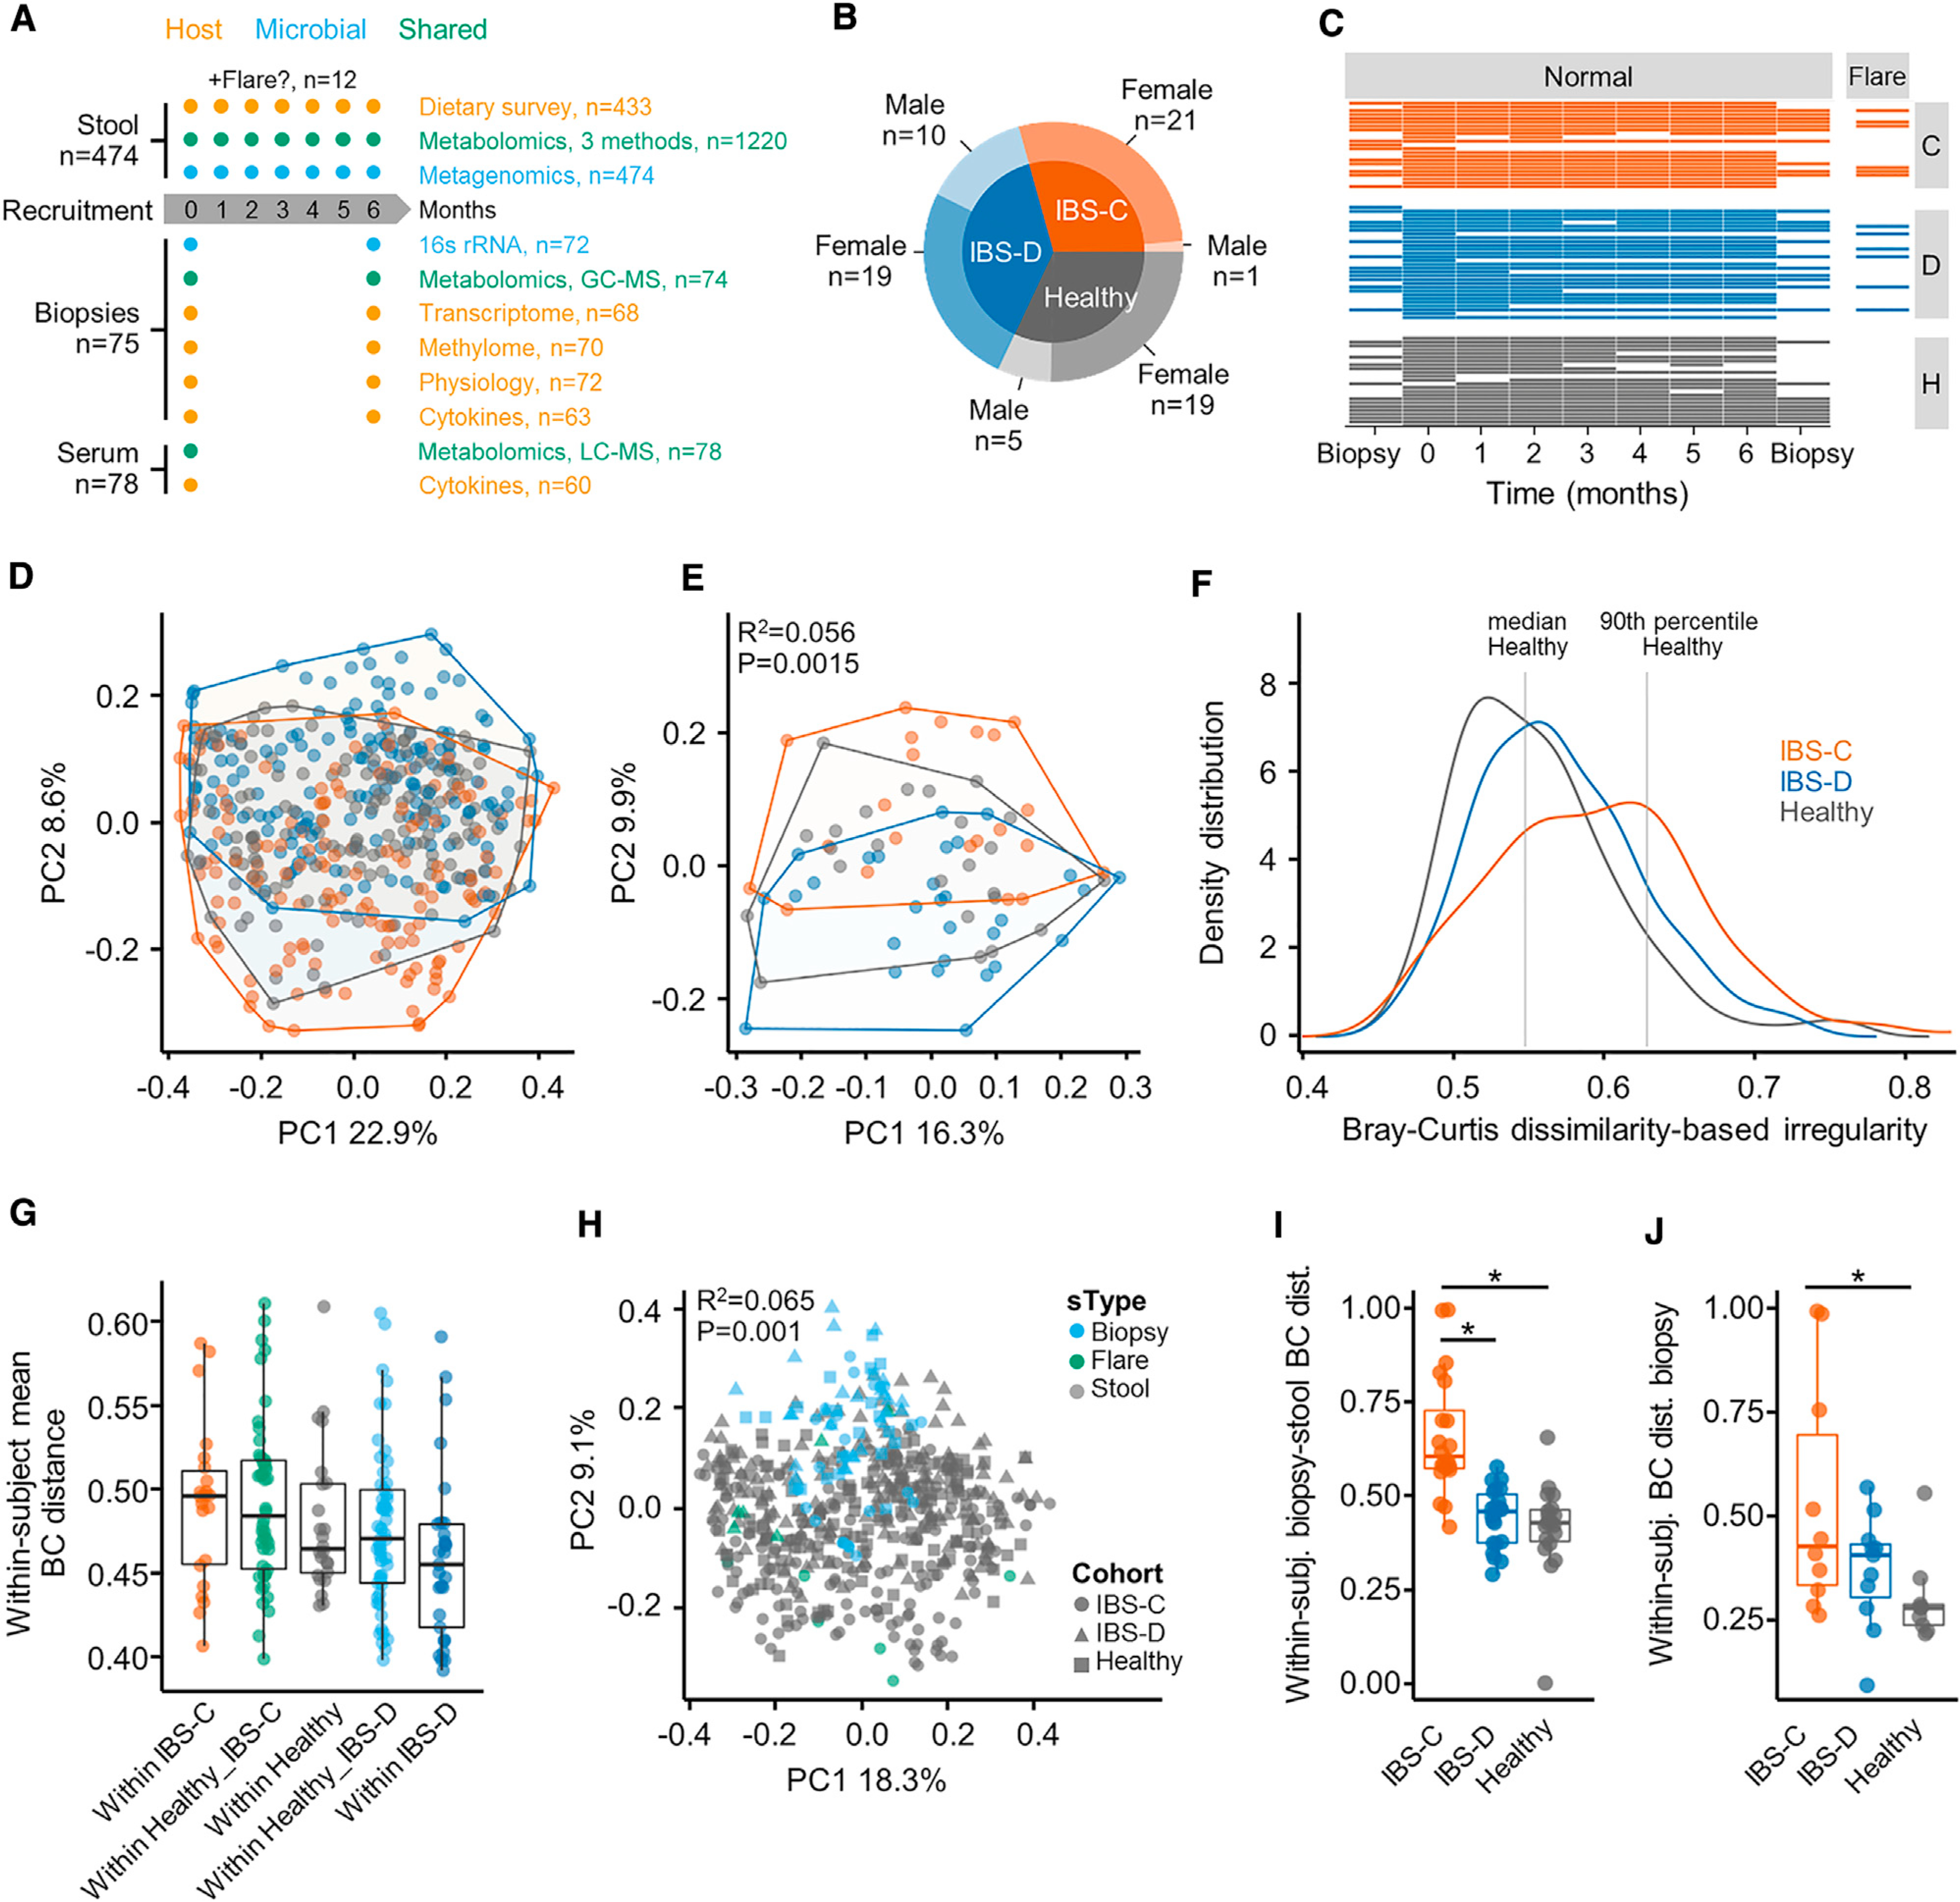
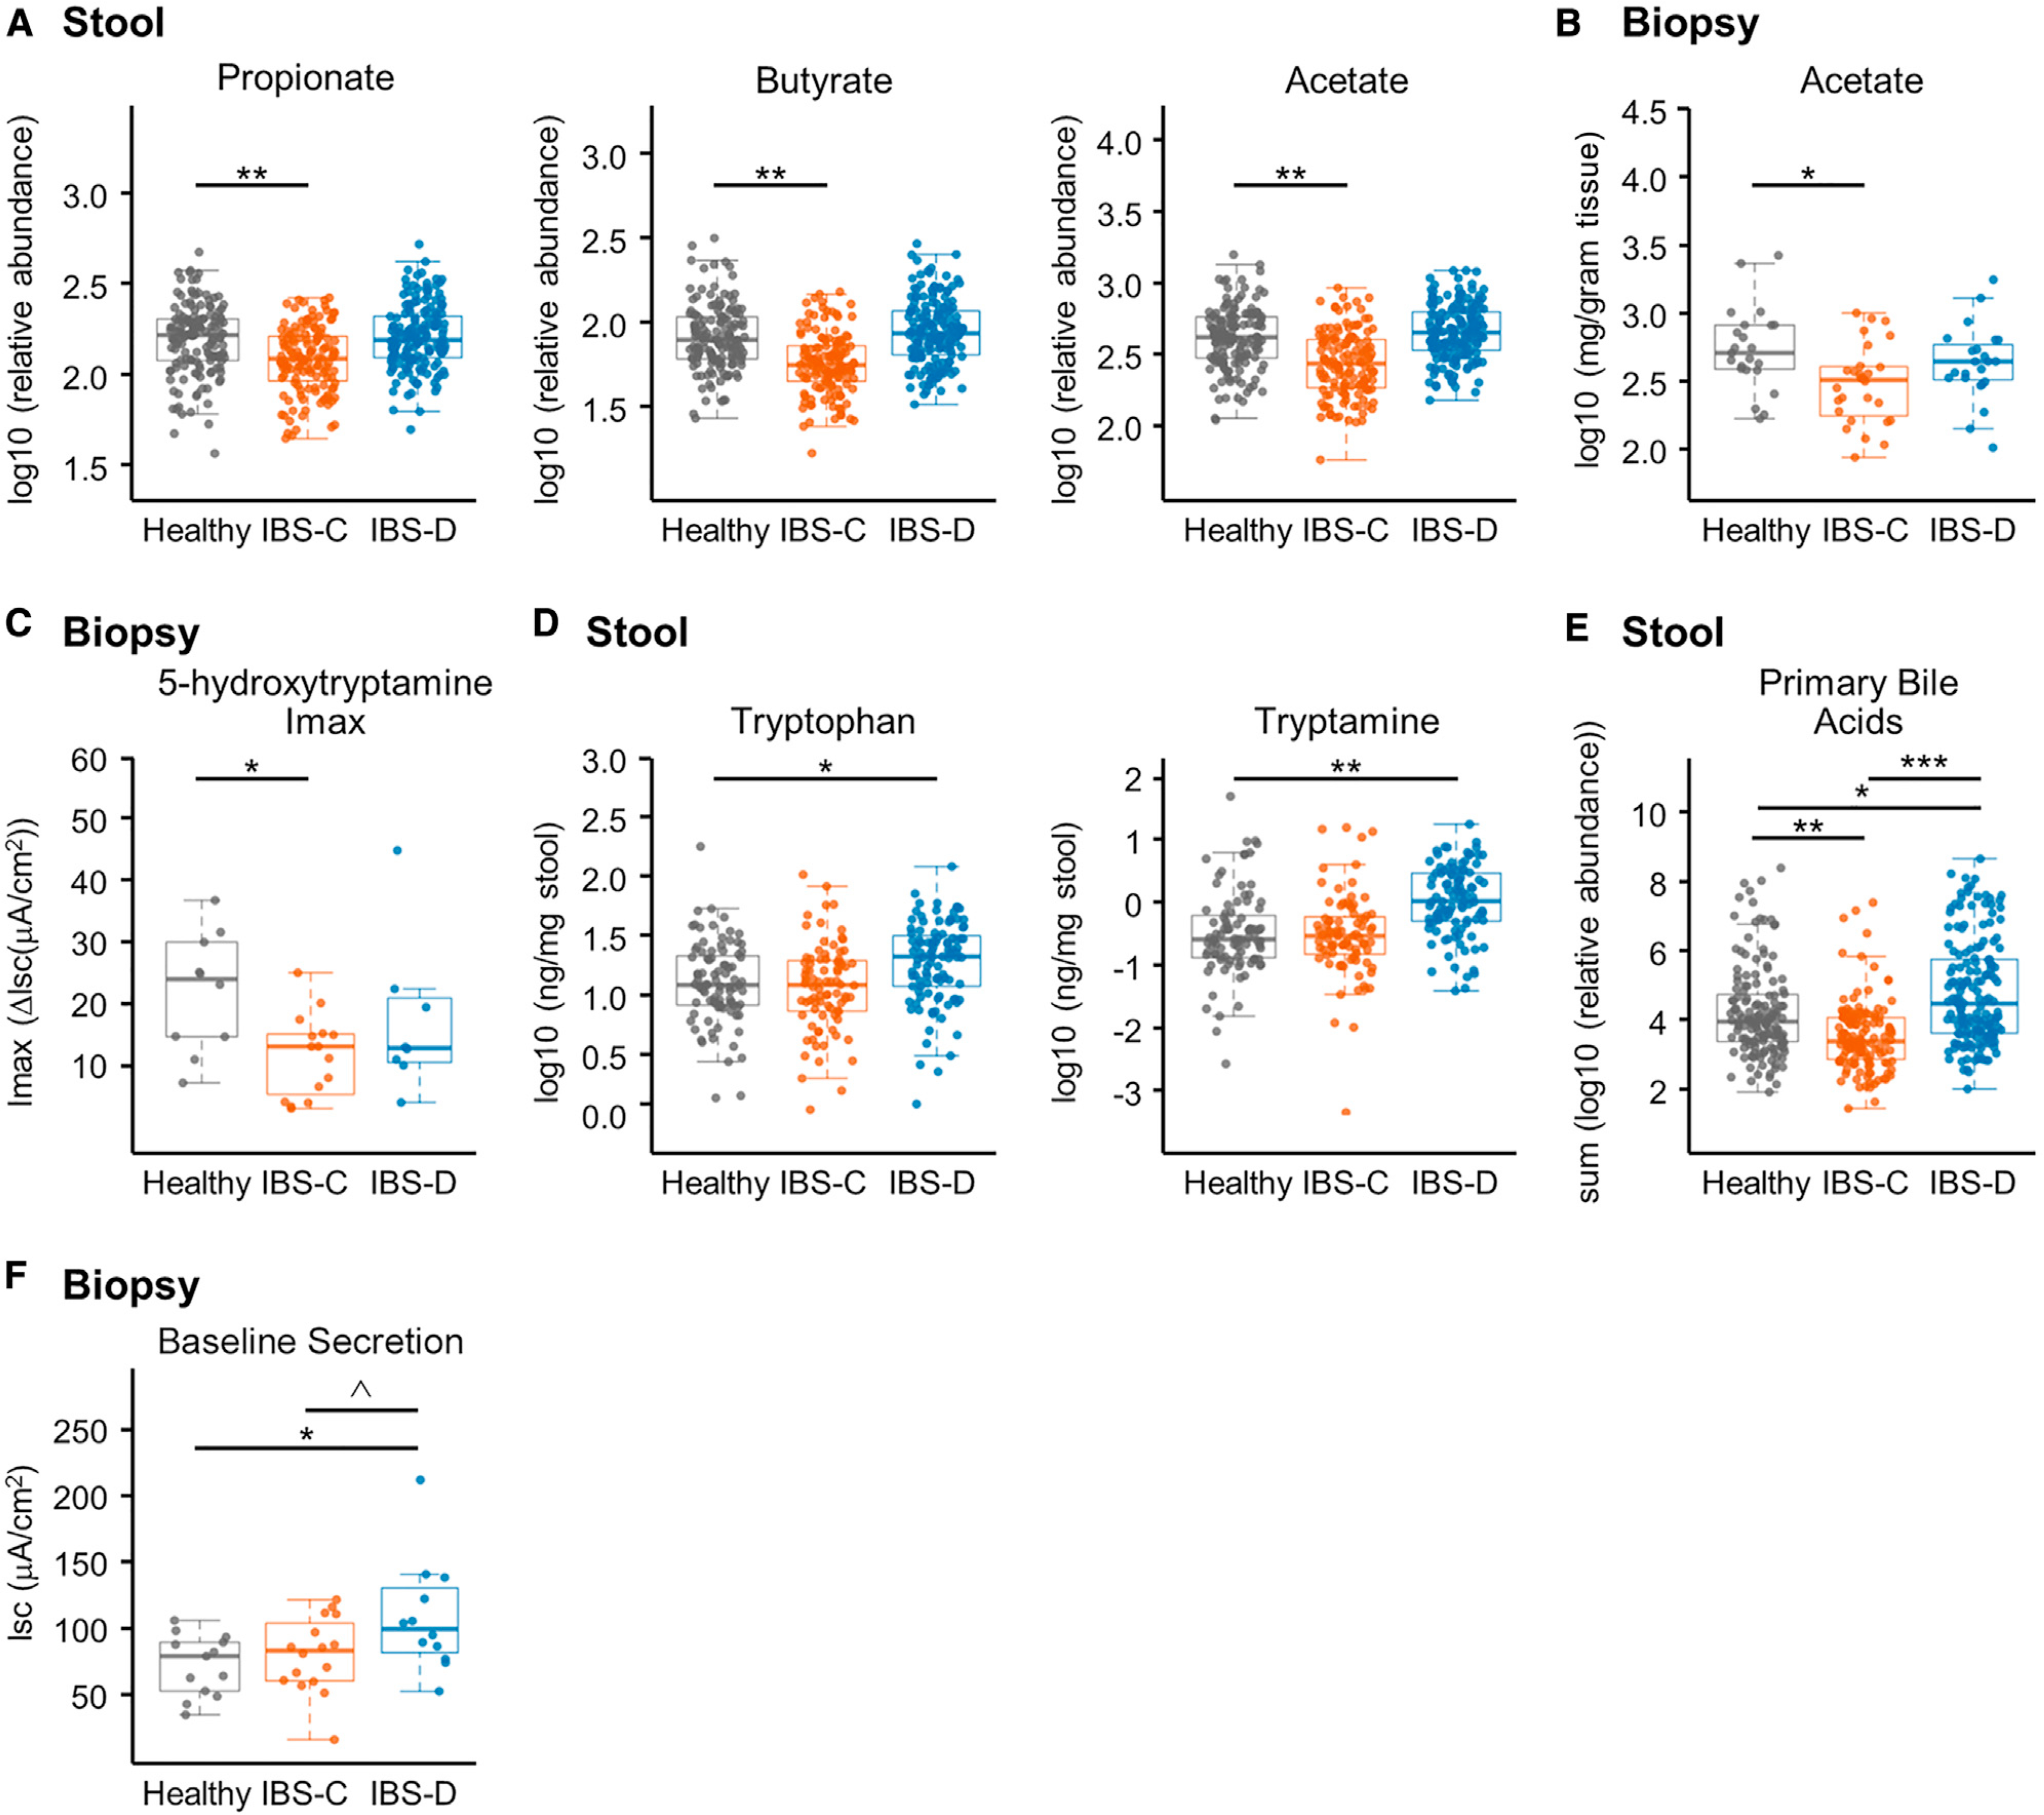
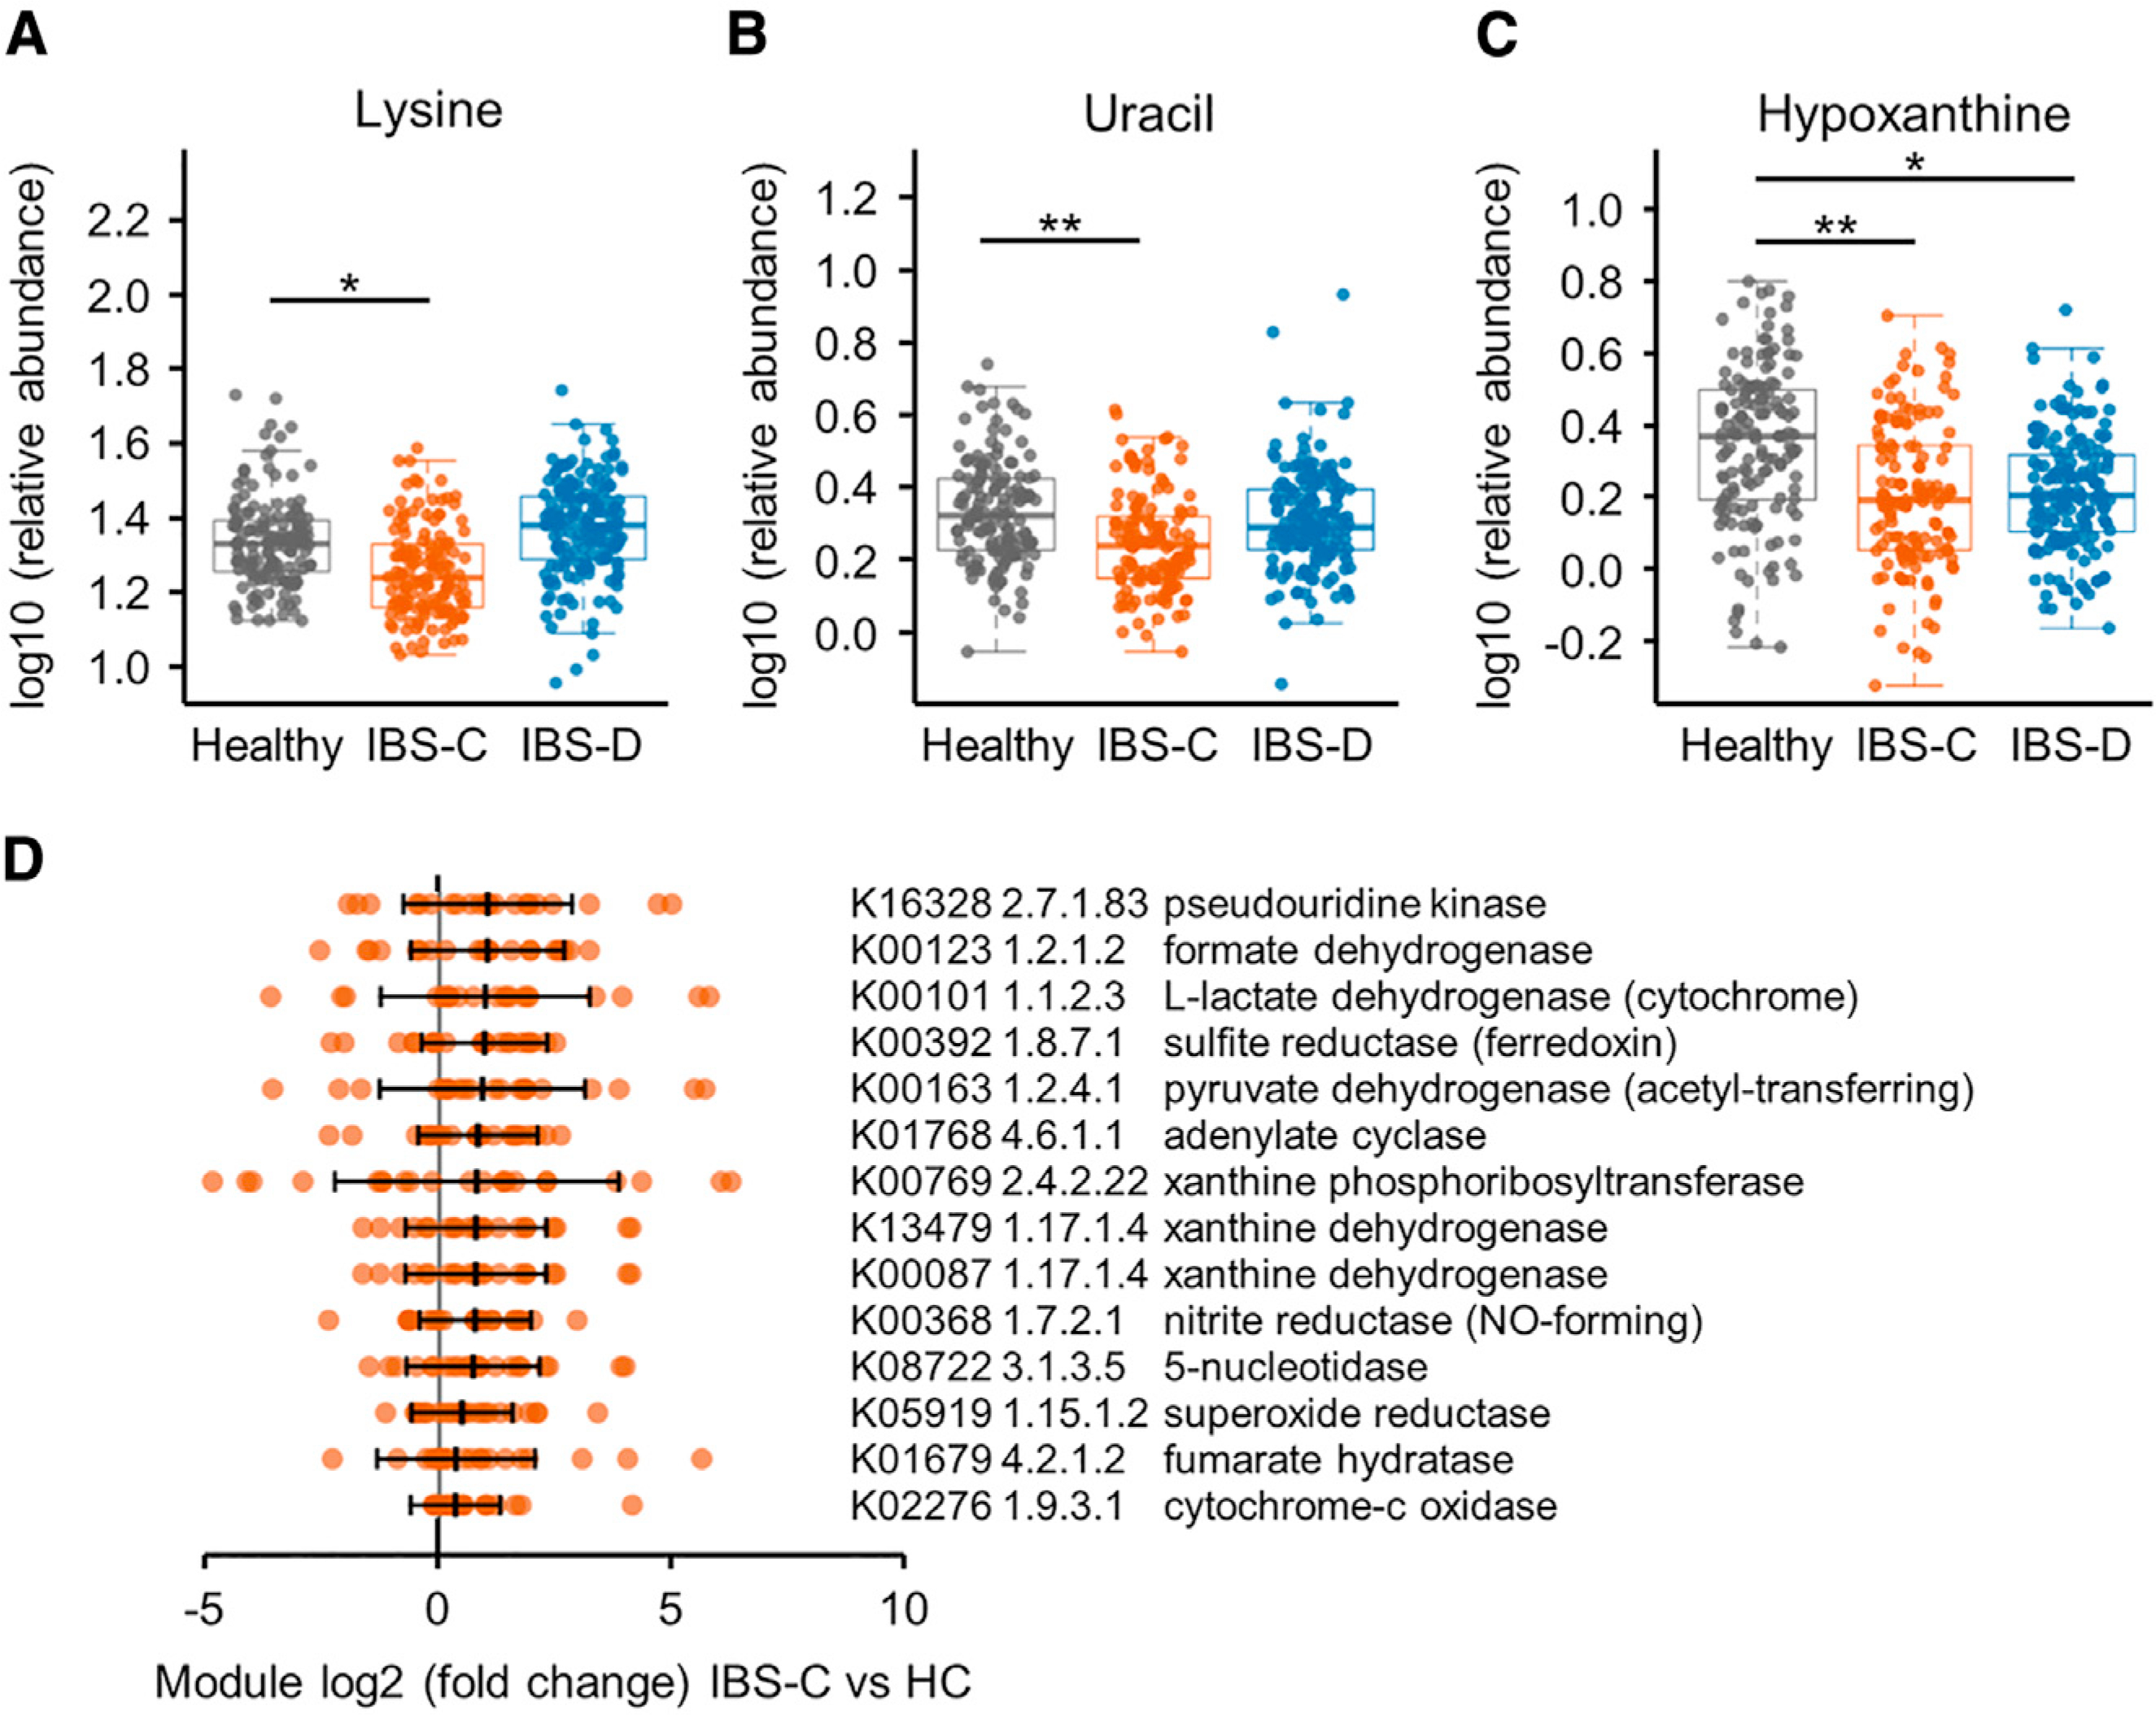
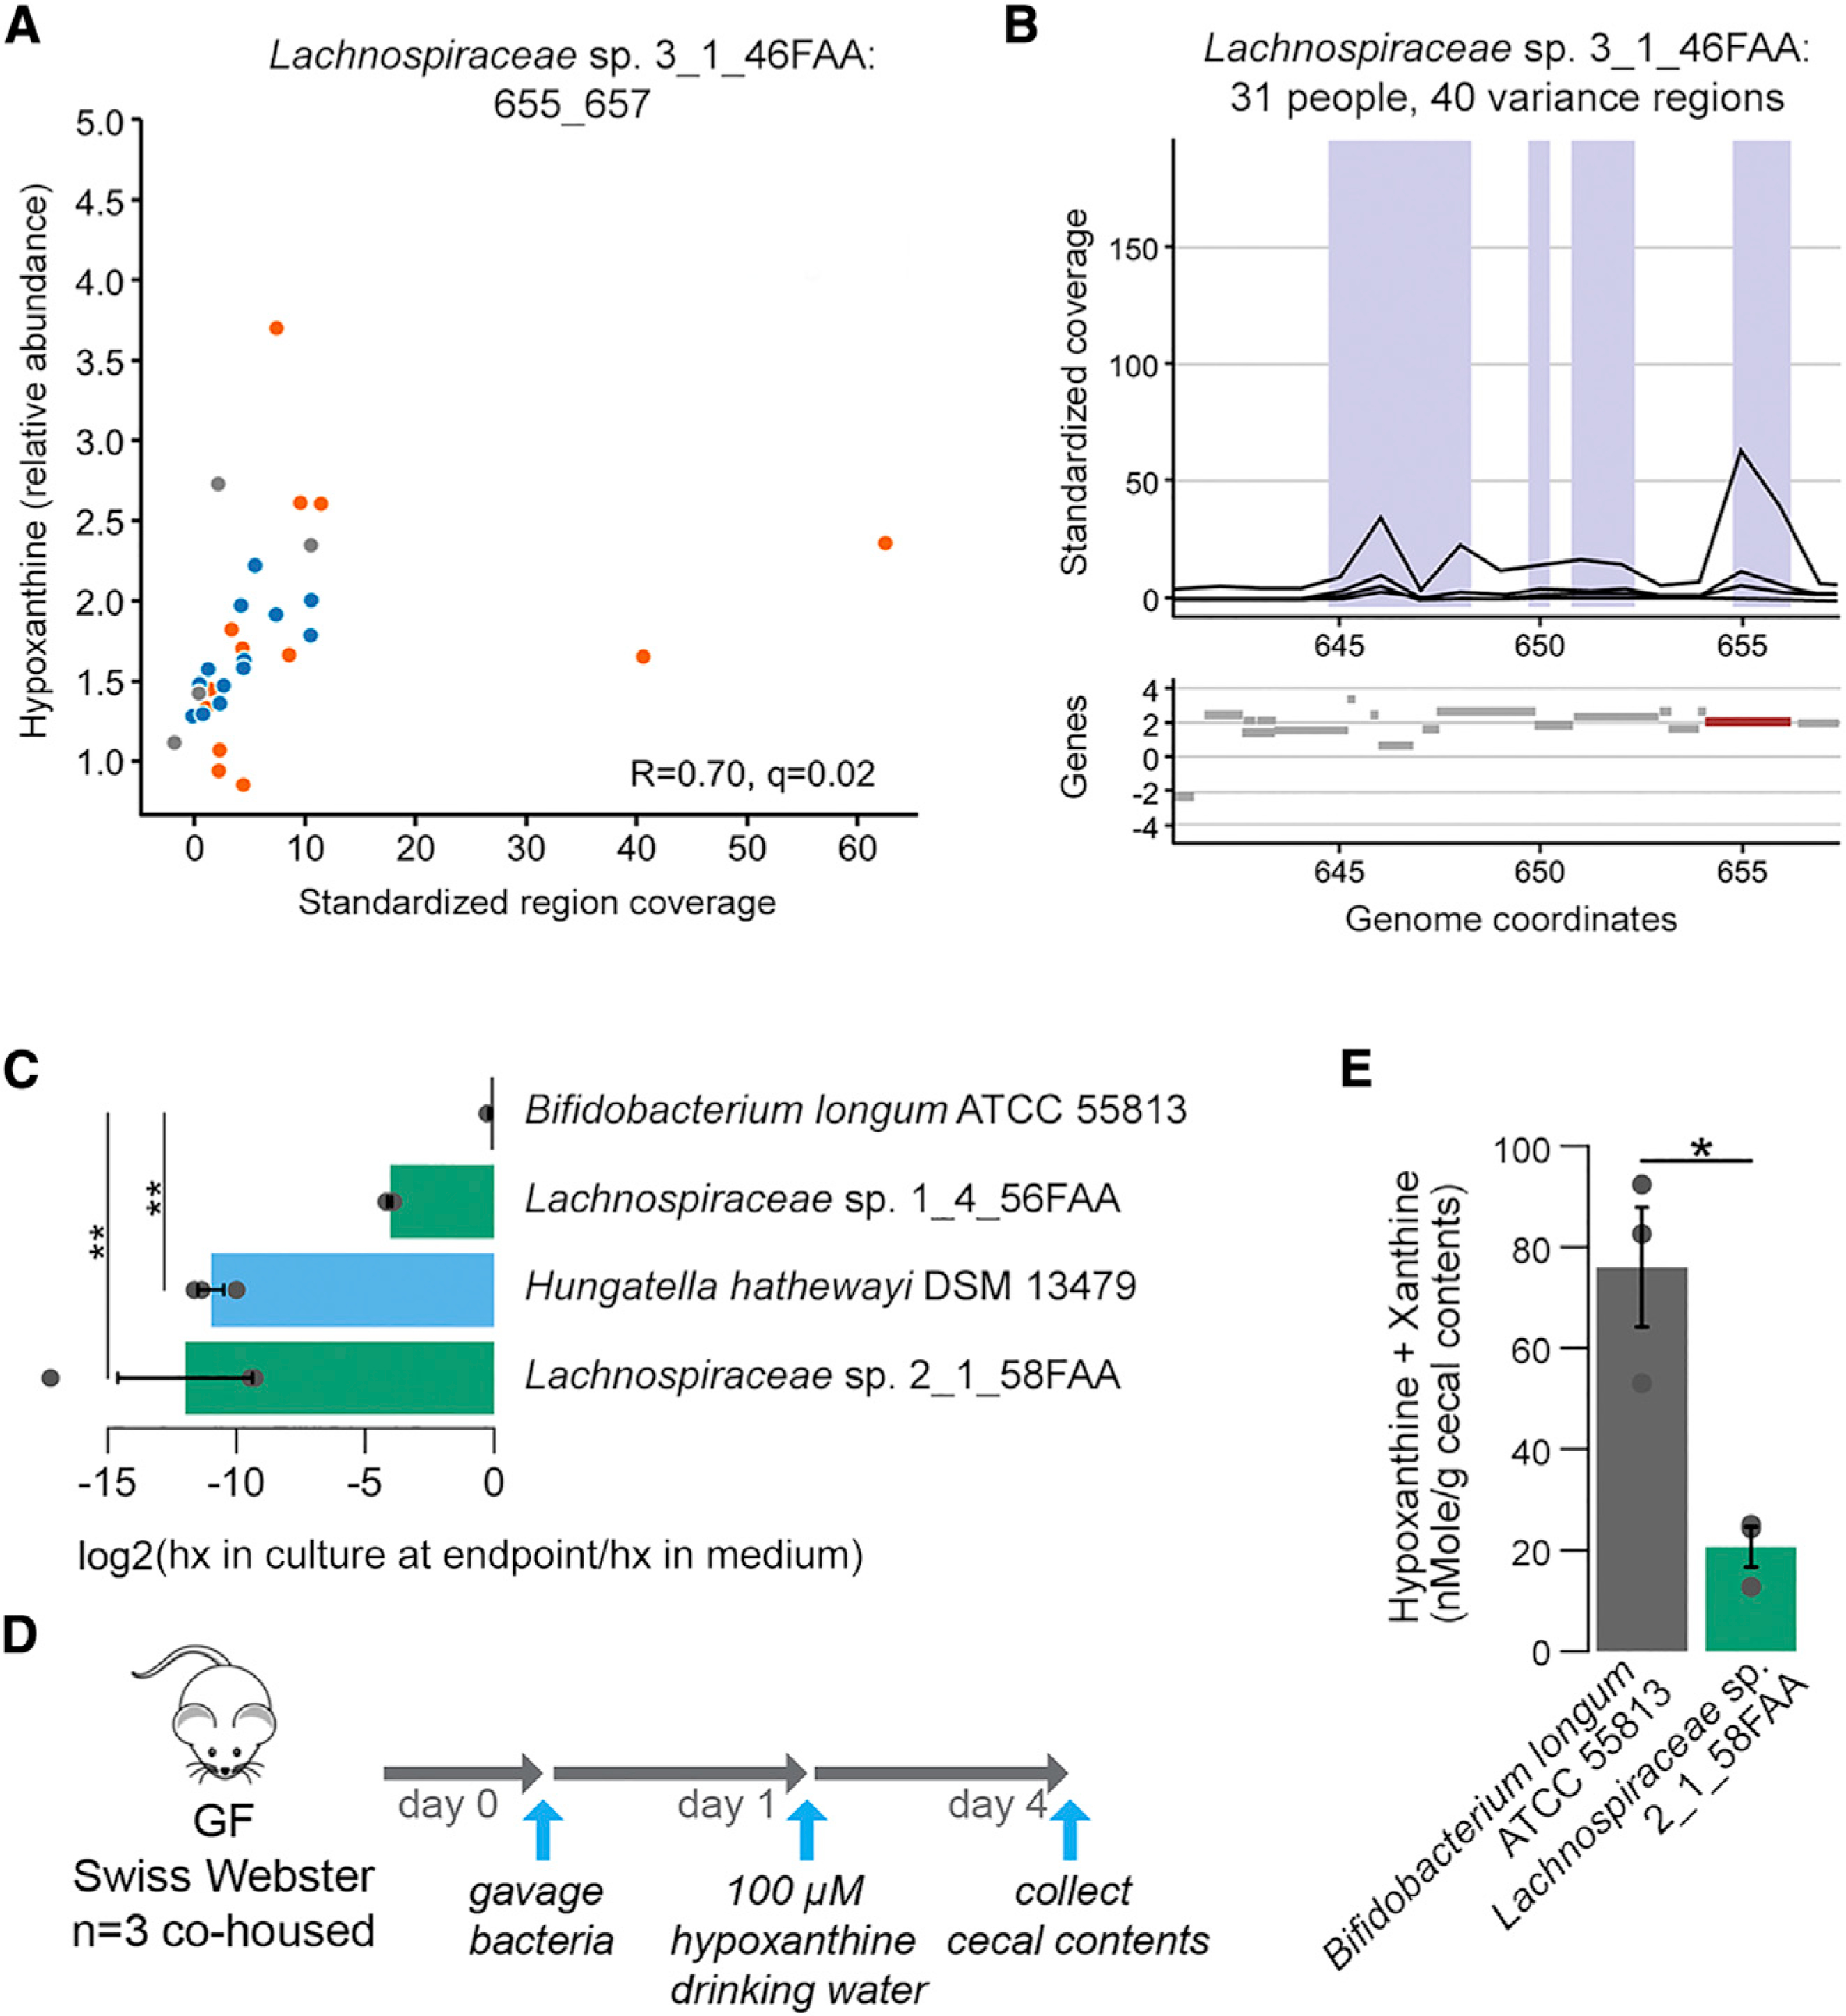
The gut microbiome has been implicated in multiple human chronic gastrointestinal (GI) disorders. Determining its mechanistic role in disease has been difficult due to apparent disconnects between animal and human studies and lack of an integrated multi-omics view of disease-specific physiological changes. We integrated longitudinal multi-omics data from the gut microbiome, metabolome, host epigenome, and transcriptome in the context of irritable bowel syndrome (IBS) host physiology. We identified IBS subtype-specific and symptom-related variation in microbial composition and function. A subset of identified changes in microbial metabolites correspond to host physiological mechanisms that are relevant to IBS. By integrating multiple data layers, we identified purine metabolism as a novel host-microbial metabolic pathway in IBS with translational potential. Our study highlights the importance of longitudinal sampling and integrating complementary multi-omics data to identify functional mechanisms that can serve as therapeutic targets in a comprehensive treatment strategy for chronic GI diseases. VIDEO ABSTRACT.

Keywords: bile acids; diet; functional bowel disorders; nucleosides; physiology; secretion; short chain fatti acids; symptom severity.


Conflict of interest statement

Declaration of Interests P.C.K. is on the Advisory Board of Novome Biotechnologies and is an ad hoc consultant for Pendulum Therapeutics, IP group, and Otsuka Pharmaceuticals. P.C.K. holds patent US20170042860A1 for use of tryptamine producing bacteria (“Methods and materials for using Ruminococcus gnavus or Clostridium sporogenes to treat gastrointestinal disorders”), and P.C.K. and Mayo Clinic have a financial interest related to this research. These interests have been reviewed and managed in accordance with Mayo Clinic Conflict-of-Interest policies. D.B.K. serves as CEO of CoreBiome, a company involved in the commercialization of microbiome analysis and a wholly owned subsidiary of OraSure Technologies. These interests have been reviewed and managed by the University of Minnesota in accordance with its Conflict-of-Interest policies.

Figures

Figure 1.
Figure 1.. Gut Microbiota Composition of IBS-C Patients Is More Distinct and Variable
(A) Outline of sample collection. (B) Number of subjects and distribution of biological sex by cohort. (C) Total number of samples per subject collected longitudinally. (D) Bray Curtis β-diversity ordination of samples from IBS-C, IBS-D, and HC considering all samples from all subjects (n = 474 stool samples, no. of samples per subject 1–7). (E) Same as (D) considering by-subject averaged data (statistics in inset from PERMANOVA on group membership). IBS-C and IBS-D versus HC, p = < 0.05, IBS-C versus IBS-D, p value = 0.001, dispersion around centroids via pairwise PERMANOVA (n = 22, 29, and 24 averaged gut microbiome profiles for IBS-C, IBS-D, and HC, respectively). (F) Bray-Curtis dissimilarity (BCD)-based irregularity (BCDI) showing distribution of the three groups linear mixed-effect model correcting for subject HC versus IBS-C p = < 0.011 (n = 142, 170, and 143 stool samples for IBS-C, IBS-D, and HC, respectively). (G) Community variability determined by the mean within-subject Bray Curtis distance (within-IBS-D versus within-IBS-C, p = < 0.005, ANOVA Tukey, n = 22, 46, 24, 53, and 29, Bray-Curtis distances between stool samples of the same subject for within-IBS-C, Healthy versus IBS-C, within-Healthy, Healthy versus IBS-D, and within-IBS-D, respectively). (H) Bray Curtis β-diversity ordination of biopsy and stool samples (statistics in inset from PERMANOVA on group membership. n = 72, 12, and 462 stool samples for biopsy, flare, stool, respectively). (I) Difference in mucosa associated and luminal microbiota composition based on Bray-Curtis distance (HC versus IBS-C, IBS-D versus IBS-C p = < 0.001, ANOVA Tukey HSD; n = 20, 22, and 19 paired mucosal-stool microbiome samples for IBS-C, IBS-D, and HC, respectively). (J) Community variability within each group based on mean Bray Curtis Distance (HC versus IBS-C, p value = 0.02, ANOVA Tukey HSD, n = 10, 11, and 9 mucosal microbiome samples for IBS-C, IBS-D, and HC, respectively). Boxplot center represents median and box interquartile range (IQR). Whiskers extend to most extreme data point <1.5 × IQR. C: IBS-C, D: IBS-D, H: HC. Symbols indicate significance (*p = < 0.05). See also Figures S1 and S2 and Tables S1 and S2.
Figure 2.
Figure 2.. Metabolomics Integrated with Physiologic Measurements Provides Mechanistic Insight into the Effect of Gut Microbiota Metabolism on Gastrointestinal Function
(A) Relative abundance of propionate, butyrate, and acetate in stool samples determined with 1H NMR (linear mixed-effect models on log10-transformed data correcting for subject, FDR corrected, n = 136, 170, and 146 metabolite profiles for IBS-C, IBS-D, and HC, respectively). (B) Absolute abundance of acetate in colonic biopsies determined with GC-MS (linear mixed-effect models on log10-transformed abundance correcting for subject, FDR corrected, n = 28, 23, and 23 averaged metabolomes for IBS-C, IBS-D, and HC, respectively). (C) Maximal ΔIsc (Imax) following application of increasing concentrations of serotonin (5-HT) basolaterally in colonic biopsies from time-point 1 (ANOVA Tukey HSD, n = 13, 12, and 10 colonic biopsies for IBS-C, IBS-D, and HC, respectively). (D) Absolute abundance of tryptophan and tryptamine in a subset of the stool samples determined with LC-MS/MS (ng/mg stool) (linear mixed-effect models on log10-transformed data correcting for subject, FDR adjusted, n = 84, 91, and 103 metabolite profiles for IBS-C, IBS-D, and HC, respectively). (E) Relative abundance of primary unconjugated bile acids in stool samples determined with LC-MS/MS. Data shown are the sum of cholic acid and chenodeoxycholic acid relative abundances (linear mixed-effect models on log10-transformed data correcting for subject, n = 136, 170, and 146 metabolite profiles for IBS-C, IBS-D, and HC, respectively). (F) Baseline Isc (ANOVA Tukey HSD, n = 16, 12, and 13 colonic biopsies for IBS-C, IBS-D, and HC, respectively). Boxplot center represents median and box IQR. Whiskers extend to most extreme data point <1.5 × IQR. Symbols indicate significance (***p = < 0.001, **p = < 0.01, *p = < 0.05, ^p = < 0.10).
Figure 3.
Figure 3.. Integrated Microbiome-Metabolome Analysis Identifies a Novel Microbial Metabolic Pathway in IBS
(A–C) Relative abundance of (A) lysine, (B) uracil, and (C) hypoxanthine in stool samples determined with 1H NMR (linear mixed-effect models on log10-transformed data correcting for subject, FDR adjusted, n = 136, 170, and 146 metabolite profiles for IBS-C, IBS-D, and HC, respectively). Boxplot center represents median and box IQR. Whiskers extend to most extreme data point <1.5 × IQR. Symbols indicate significance (***p = < 0.001, **p = < 0.01, *p = < 0.05). (D) Selected hypoxanthine-related gut metagenome KO term abundance in stools from IBS-C subjects compared to the median abundance of the healthy control (HC) subjects. By-subject averaged data (FDR <0.1, Mann-Whitney test; except for K00769, which had q value 0.12). The maximal log2(FC) of the either of the xanthine dehydrogenase (XDH)/oxidase modules is 0.73, p = < 0.005, q value 0.09 for IBS-C, and log2(FC) 0.49, p = < 0.07 for IBS-D. Error bars show SD and middle line indicates median (IBS-C n = 22 averaged microbiome compositions). All KO term associations can be found in Table S3. See also Figures S3 and S4 and Table S3.
Figure 4.
Figure 4.. Hypoxanthine Consumption by Specific Gut Microbiome Members as Suggested by Microbial Gene Region Associations
(A) Scatterplot of metabolite intensities and standardized region coverage for SV association result for Lachnospiraceae sp. 3_1_46FAA genomic region positively correlated to hypoxanthine (Spearman correlation inset, n = 13, 13, and 5 averaged microbiome abundances with Lachnospiraceae bacterium 3–146FAA present above threshold for IBS-C, IBS-D, and HC, respectively). (B) Genomic context of region from (A) with relevant gene highlighted in red. (C) 3 Clostridiales strains and B. longum were grown in Mega medium. Hypoxanthine levels in the culture supernatant after overnight growth were determined with LC-MS (ANOVA Tukey HSD on log2(FC), n = 3 cultures per strain). hx: hypoxanthine (D) Outline of monocolonization mouse experiment verifying in vivo hypoxanthine consumption. 3 female GF Swiss Webster mice were oral gavaged with ~2*106 colony-forming units (CFUs) of either B. longum or Lachnospiraceae sp. 2_1_58FAA and co-housed for the duration of the experiment. Hypoxanthine was supplied in drinking water to mimic exogenous production by the microbiome. On day 4 after, gavage mice were sacrificed and cecal contents were collected. (E) Hypoxanthine and xanthine pool size was determined in cecal contents using enzyme assays. Samples were corrected for baseline levels of H2O2 in the sample based on parallel reactions without XO enzyme (Welch t test on averaged duplicate samples, n = 3 cecal contents from 3 mice per colonization status). Error bars indicate standard error of the mean (SEM). Symbols indicate significance (**p = < 0.01, *p = < 0.05). See also Figure S4 and Table S4.
Figure 5.
Figure 5.. Alteration in Gut Microbiome and Microbial Metabolites Underlie Flares in IBS Patients
(A) BCDI showing distribution of IBS flare and all non-flare IBS samples (linear mixed-effect model correcting for subject, IBS non-flare versus IBS flare p = < 0.01, n = 312, 12 gut microbiome profiles for IBS non-flare, IBS flare, respectively). (B) Within-disease comparisons of BCDI score (p values from linear mixed-effect model correcting for subject, n = 142, 6, 170, and 6 gut microbiome profiles for IBS-C non-flare, IBS-C flare, IBS-D non-flare, and IBS-D flare, respectively). (C) Within-disease comparisons of α-diversity in flare samples compared to by-subject averaged baseline data (Shannon diversity at species level, p values from Mann-Whitney U test, n = 22, 6, 29, and 6 averaged gut microbiome profiles for IBS-C non-flare, IBS-C flare, IBS-D non-flare, and IBS-D flare, respectively). (D) Relative abundance of Halobiforma nitratireducens in flare and non-flare IBS samples (q < 0.001, Mann-Whitney U test, n = 51, 12 averaged gut microbiome profiles for IBS non-flare, IBS flare, respectively). (E) Relative abundance of cholic acid in stool samples determined with LC-MS/MS (linear mixed-effect models on log10-transformed data correcting for subject, FDR adjusted, n = 136, 6, 170, and 6 metabolite profiles for IBS-C non-flare, IBS-C flare, IBS-D non-flare, and IBS-D flare, respectively). (F) Same as in (E) for chenodeoxycholic acid. Boxplot center represents median and box IQR. Whiskers extend to most extreme data point <1.5 × IQR. Symbols indicate significance (***p = < 0.001, **p = < 0.01, *p = < 0.05). See also Figure S5 and Table S5.
Figure 6.
Figure 6.. Multi-omics Integration Results from Lasso Penalized Regression
(A) Network representing significant and stability-selected correlations of host genes (gray nodes) with fecal microbial taxa (blue nodes) and fecal metabolites (yellow nodes) at FDR <0.25. Purple edges indicate positive correlation and red edges indicate negative correlation, and edge width indicates the strength of correlation (Lasso regression using 25 IBS patients and 13 matched HC datasets). (B) Lasso correlation plots between acetate with PGLYPR1 (FDR <0.001) and acetate (FDR <0.05) from network shown in A). Orange and blue points represent IBS-C and IBS-D subjects, respectively. (C) Same as (B) for KIFC3. See also Figure S7 and Table S7.
Figure 7.
Figure 7.. An Integrated Multi-omics View of IBS Points to Microbiome-Host Interactions in the Purine Salvage Pathway
(A) Purine nucleoside phosphorylase (PNP) expression in colonic biopsy tissue (for A and B, ANOVA Tukey HSD, n = 15, 8, and 8 time-point-averaged female biopsy transcriptomes for IBS-C, IBS-D, and HC, respectively). For full statistical results split by time point, see Table S6 (p = < 0.001 for IBS-C and IBS-D versus HC for biopsies from first time point (IBS-D versus HC FDR 0.018), from generalized binomial test). (B) Gene expression of human XDH in colonic biopsy tissue. For full statistical results split by time point, see Table S6 (p value 0.022 for IBS-C and 0.101 for IBS-D in time point 1 and <0.005 for time point 2 (with IBS-C versus HC FDR <0.05), from generalized binomial test). (C) Simplified human-microbiome purine nucleotides degradation pathway with identified IBS-relevant changes indicated. Black arrows indicate metabolic steps, and yellow and blue up arrows indicate elevated expression or abundance in IBS. (D) Lasso correlation plot between hypoxanthine and PNP (FDR <0.001). Orange and blue points represent IBS-C and IBS-D subjects, respectively. (E) Metagenomic xanthine oxidase module abundance for all groups (also shown in Figure 3D for IBS-C; IBS-C versus HC FDR <0.1, Mann-Whitney U test. n = 22, 29, and 24 averaged gut microbiome profiles for IBS-C, IBS-D, and HC, respectively). Boxplot center represents median and box IQR. Whiskers extend to most extreme data point <1.5 × IQR. Symbols indicate significance (*p = < 0.05, ^p = < 0.1, ^p = < 0.2). See also Figure S6 and Table S6.

References

    1. Al-Ghalith GA, Hillmann B, Ang K, Shields-Cutler R, and Knights D (2018). SHI7 Is a Self-Learning Pipeline for Multipurpose Short-Read DNA Quality Control. mSystems 3. Published online April 2018. 10.1128/mSystems.00202-17. - DOI - PMC - PubMed
    1. Becker MA, Schumacher HR, MacDonald PA, Lloyd E, and Lademacher C (2009). Clinical efficacy and safety of successful longterm urate lowering with febuxostat or allopurinol in subjects with gout. J. Rheumatol 36, 1273–1282. - PubMed
    1. Bhattarai Y, Muniz Pedrogo DA, and Kashyap PC (2017a). Irritable bowel syndrome: a gut microbiota-related disorder? Am. J. Physiol. Gastrointest. Liver Physiol 312, G52–G62. - PMC - PubMed
    1. Bhattarai Y, Schmidt BA, Linden DR, Larson ED, Grover M, Beyder A, Farrugia G, and Kashyap PC (2017b). Human-derived gut microbiota modulates colonic secretion in mice by regulating 5-HT3 receptor expression via acetate production. Am. J. Physiol. Gastrointest. Liver Physiol 313, G80–G87. - PMC - PubMed
    1. Bhattarai Y, Williams BB, Battaglioli EJ, Whitaker WR, Till L, Grover M, Linden DR, Akiba Y, Kandimalla KK, Zachos NC, et al. (2018). Gut Microbiota-Produced Tryptamine Activates an Epithelial G-Protein-Coupled Receptor to Increase Colonic Secretion. Cell Host Microbe 23, 775–785. - PMC - PubMed

Publication types

MeSH terms