. 2020 Oct 1;183(1):269-283.e19.
doi: 10.1016/j.cell.2020.08.036. Epub 2020 Sep 10.

A Quantitative Proteome Map of the Human Body

Collaborators, Affiliations

A Quantitative Proteome Map of the Human Body

Lihua Jiang et al. Cell. .

Abstract

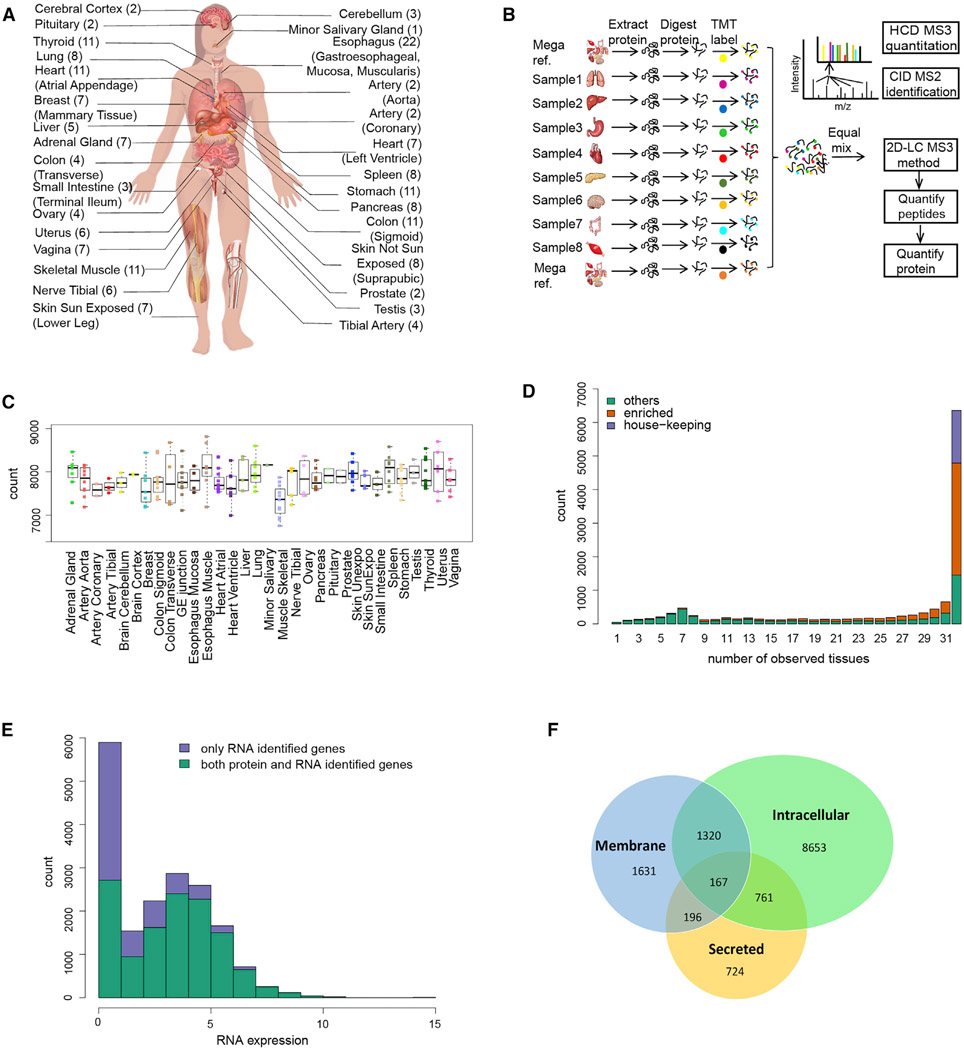
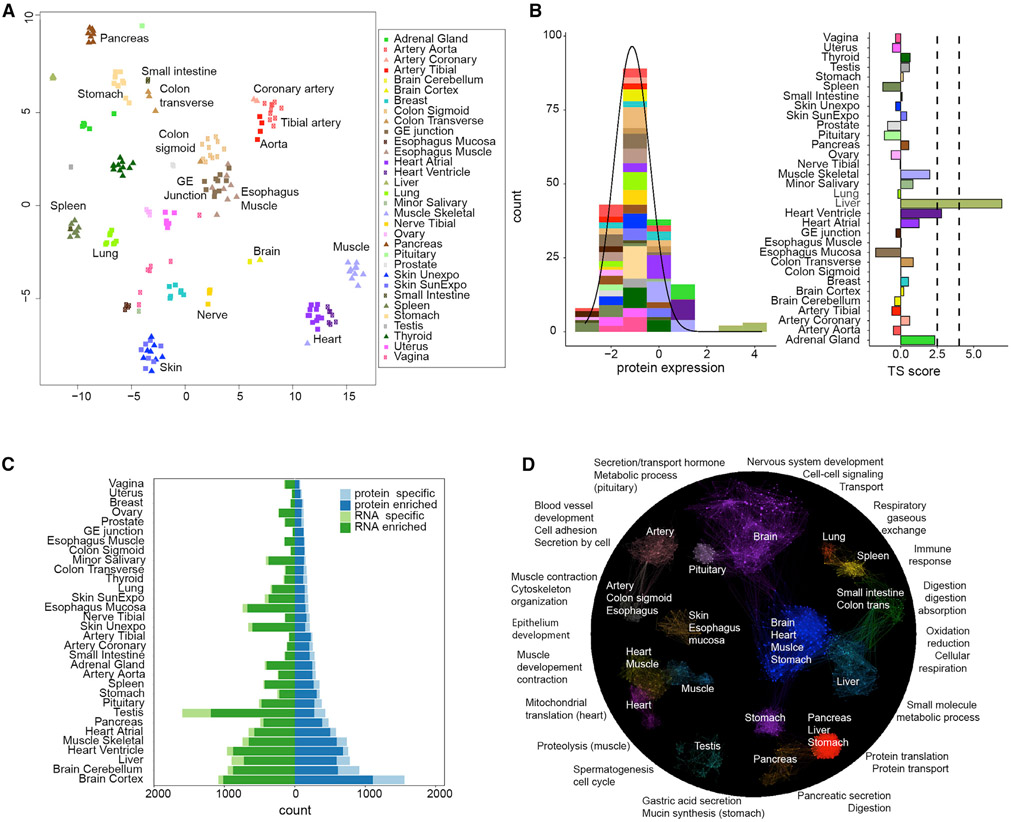
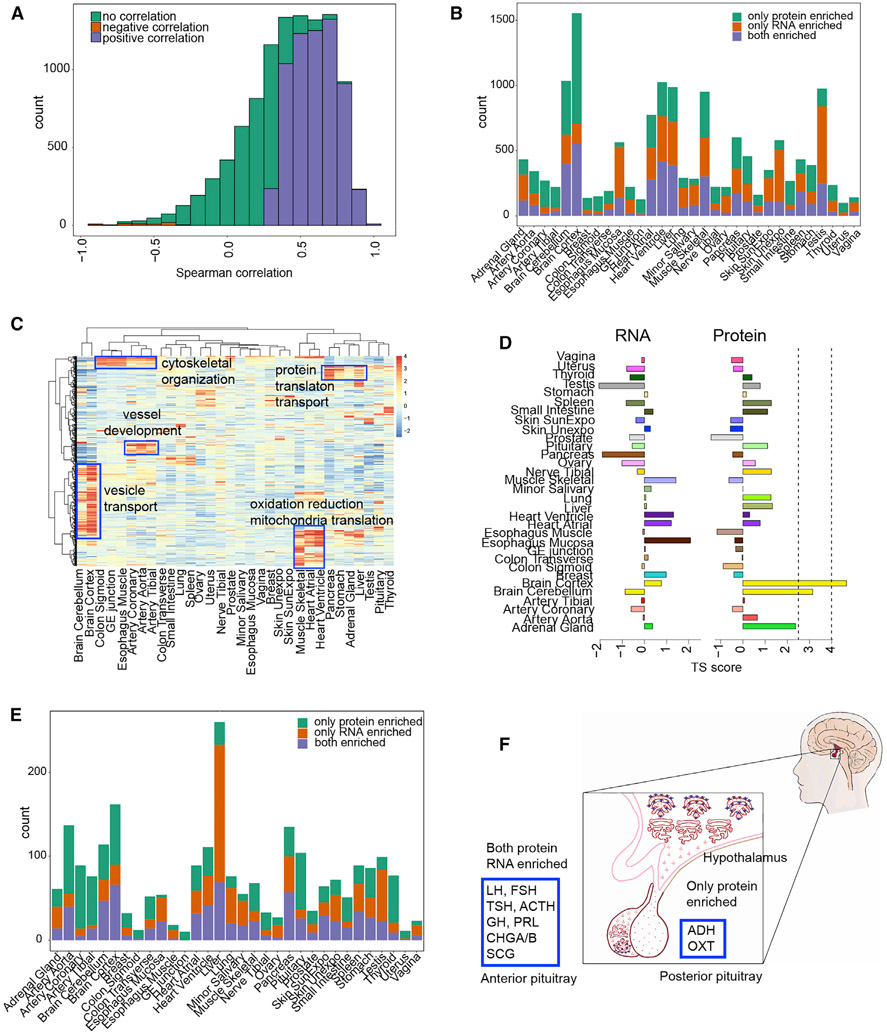
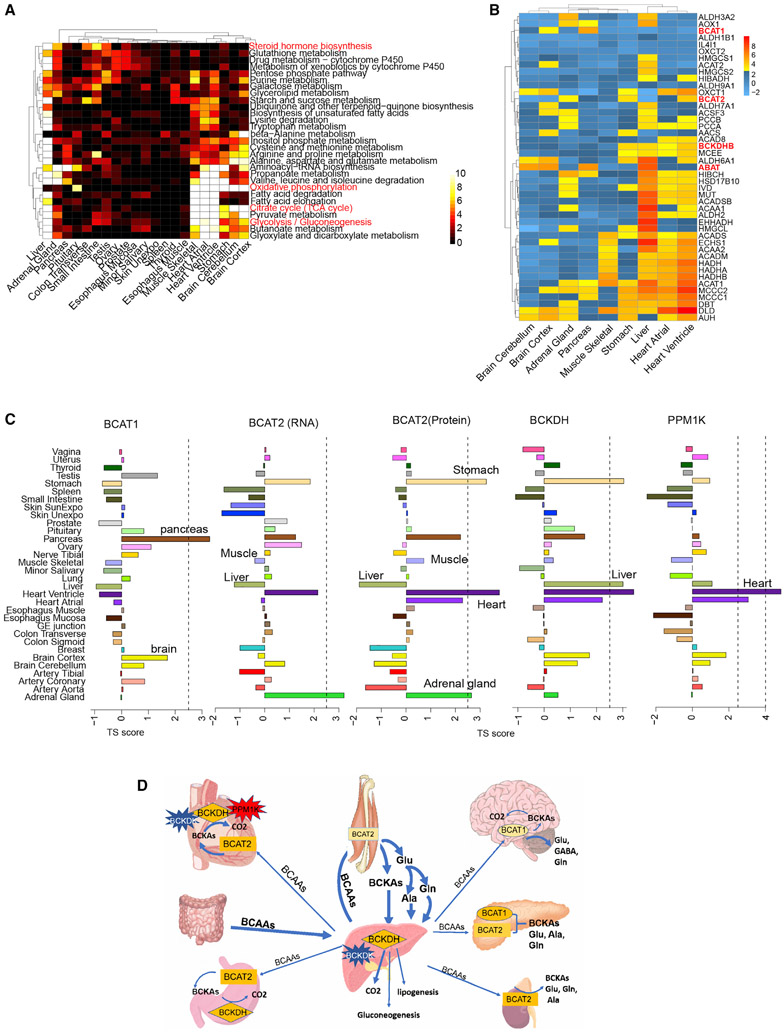
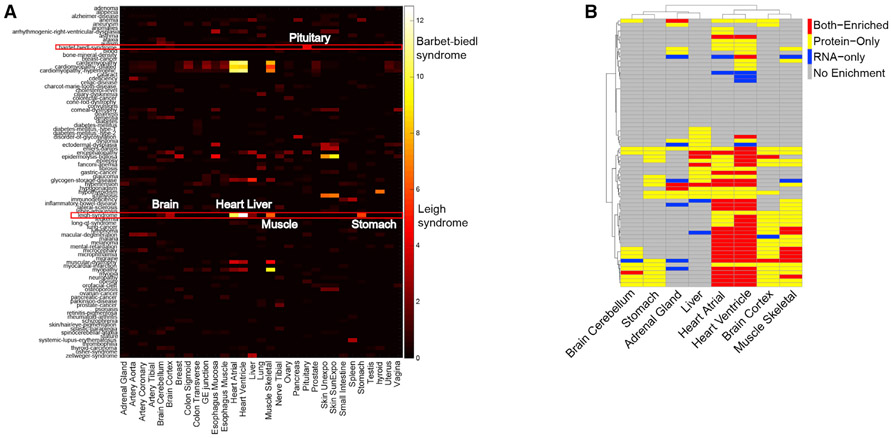
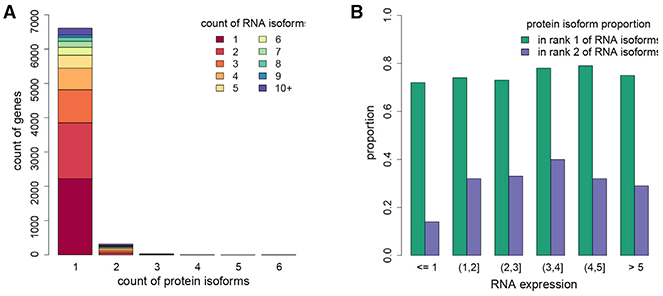
Determining protein levels in each tissue and how they compare with RNA levels is important for understanding human biology and disease as well as regulatory processes that control protein levels. We quantified the relative protein levels from over 12,000 genes across 32 normal human tissues. Tissue-specific or tissue-enriched proteins were identified and compared to transcriptome data. Many ubiquitous transcripts are found to encode tissue-specific proteins. Discordance of RNA and protein enrichment revealed potential sites of synthesis and action of secreted proteins. The tissue-specific distribution of proteins also provides an in-depth view of complex biological events that require the interplay of multiple tissues. Most importantly, our study demonstrated that protein tissue-enrichment information can explain phenotypes of genetic diseases, which cannot be obtained by transcript information alone. Overall, our results demonstrate how understanding protein levels can provide insights into regulation, secretome, metabolism, and human diseases.

Keywords: BBS syndrome; Leigh syndrome; TMT; branched-chain amino acid metabolism; mass spectrometry; protein and RNA correlation; quantitative proteomics; secretion; tissue-enriched or -specific proteins.


Conflict of interest statement

Declaration of Interests M.P.S. is a cofounder and is on the scientific advisory board of Personalis, Filtircine, SensOmics, Qbio, January, Mirvie, Oralome, and Proteus. He is also on the scientific advisory board (SAB) of Genapsys and Jupiter. The other authors declare no competing interests.

Figures

Figure 1.
Figure 1.. Overview of Tissue Proteome Experimental Workflow and Results
(A) Type of tissues and biological replicates analyzed in this study. (B) TMT 10plex- and MS3-based mass spectrometry quantitative proteomics workflow. (C) Number of proteins quantitated in each tissue (Table S2). Each dot represents data from one person. (D) Distribution of the number of proteins quantified across different numbers of tissues. There are 6,357 proteins present in all 32 tissue types. Among them, 1,565 proteins were classified as HK proteins. See Table S2 for details. (E) Distribution of RNA expression in log2TPM for both the identified and unidentified proteins. RNAs with log2TPM <1 were collapsed to 1. (F) Number of proteins identified in each protein class. The predicted protein classes are based on the results from HPA study (Uhlén et al., 2015). See also Tables S1, S2, and S3.
Figure 2.
Figure 2.. Quantitative Proteome Analysis across Tissues
(A) Clustering of proteome data across tissues using t-SNE. As shown, samples are separated by tissue types not by individuals. (B) Method for defining TS scores. As an example, for gene PHYH, the left panel shows the distribution of its TS scores across tissues fitted using AdaTiSS. The right panel shows its TS scores in each tissue. (C) The numbers of enriched and specific protein/RNA across tissues. Enrichment categories are defined in STAR Methods. (D) Protein enrichment across tissues and their biological functions. The enriched proteins represent tissue-specific/shared functions. The gene ontology (GO) term functional enrichment results are summarized in Table S5. See also Figures S1, S2, S3, and S4 and Tables S4 and S5.
Figure 3.
Figure 3.. Protein and RNA Correlation and Concordance Analysis across and within Tissues
(A) Spearman Correlation of protein and RNA across 32 tissues. The significance is based on permutation test from 200 permutations (BH-adjusted p value < 0.1). (B) The number of concordantly or discordantly enriched proteins and RNAs in each tissue. (C) The enrichment of housekeeping RNAs at the protein level across tissues. (D) TS-score of RAB7A across tissues for the proteome and transcriptome. (E) Secreted proteins and their concordance to corresponding RNAs in each tissue. (F) Concordance analysis of pituitary secreted proteins. All the peptide hormones in the anterior part of pituitary are concordantly enriched at the protein and RNA levels. Hormones in the posterior part of the pituitary are secreted from hypothalamus and stored in the pituitary. See also Table S4.
Figure 4.
Figure 4.. Analysis of Tissue-Specific Metabolism
(A) Enrichment of a subset of metabolic pathways across different tissues. The heatmap shows the significance of the -log(p values) from the pathway enrichment test. The plot only includes the tissues having at least one significantly enriched pathway under threshold of 0.001 for the p value from Fisher’s exact test. (B) The enrichment map of key enzymes in BCAA metabolism. (C) Tissue enrichment of the first-step enzyme BCAT1/2 and the second-step enzyme BCKDH and its activator PPM1K. (D) Interactive map of BCAA shuttling among tissues and the enriched enzymes. See also Figure S5 and Tables S4 and S5.
Figure 5.
Figure 5.. Association of Tissue-Enriched Proteins with Genetic Diseases
(A) Heatmap of the enrichment of genetic diseases across tissues. Some genetic diseases are significantly enriched in specific tissues such as Bardet-Biedl syndrome and Leigh syndrome. The disease terms are from the OMIM database. (B) Protein and RNA concordance heatmap for genes involved in Leigh syndrome. See also Tables S4 and S6.
Figure 6.
Figure 6.. Protein Isoform Analysis
(A) Total number of genes which have different numbers of isoforms identified at the protein level. Different colors represent the number of RNA isoforms for each gene. We identified one isoform for nearly 7,000 genes, although we observe several RNA isoforms for each gene. (B) The proportion of the rank 1 and 2 RNA isoforms identified at the protein level across RNA abundance intervals. See also Table S7.

Similar articles

Cited by

References

    1. Amberger JS, Bocchini CA, Schiettecatte F, Scott AF, and Hamosh A (2015). OMIM.org: Online Mendelian Inheritance in Man (OMIM®), an online catalog of human genes and genetic disorders. Nucleic Acids Res. 43, D789–D798. - PMC - PubMed
    1. Angione C (2019). Human Systems Biology and Metabolic Modelling: A Review-From Disease Metabolism to Precision Medicine. BioMed Res. Int 2079, 8304260. - PMC - PubMed
    1. Arany Z, and Neinast M (2018). Branched Chain Amino Acids in Metabolic Disease. Curr. Diab. Rep 18, 76. - PubMed
    1. Baker MS, Ahn SB, Mohamedali A, Islam MT, Cantor D, Verhaert PD, Fanayan S, Sharma S, Nice EC, Connor M, and Ranganathan S (2017). Accelerating the search for the missing proteins in the human proteome. Nat. Commun 8, 14271. - PMC - PubMed
    1. Beck M, Schmidt A, Malmstroem J, Claassen M, Ori A, Szymborska A, Herzog F, Rinner O, Ellenberg J, and Aebersold R (2011). The quantitative proteome of a human cell line. Mol. Syst. Biol 7, 549. - PMC - PubMed

Publication types