. 2020 Dec 1:169:112572.
doi: 10.1016/j.bios.2020.112572. Epub 2020 Sep 3.

Rapid and quantitative detection of SARS-CoV-2 specific IgG for convalescent serum evaluation

Affiliations

Rapid and quantitative detection of SARS-CoV-2 specific IgG for convalescent serum evaluation

Xiaotian Tan et al. Biosens Bioelectron. .

Abstract

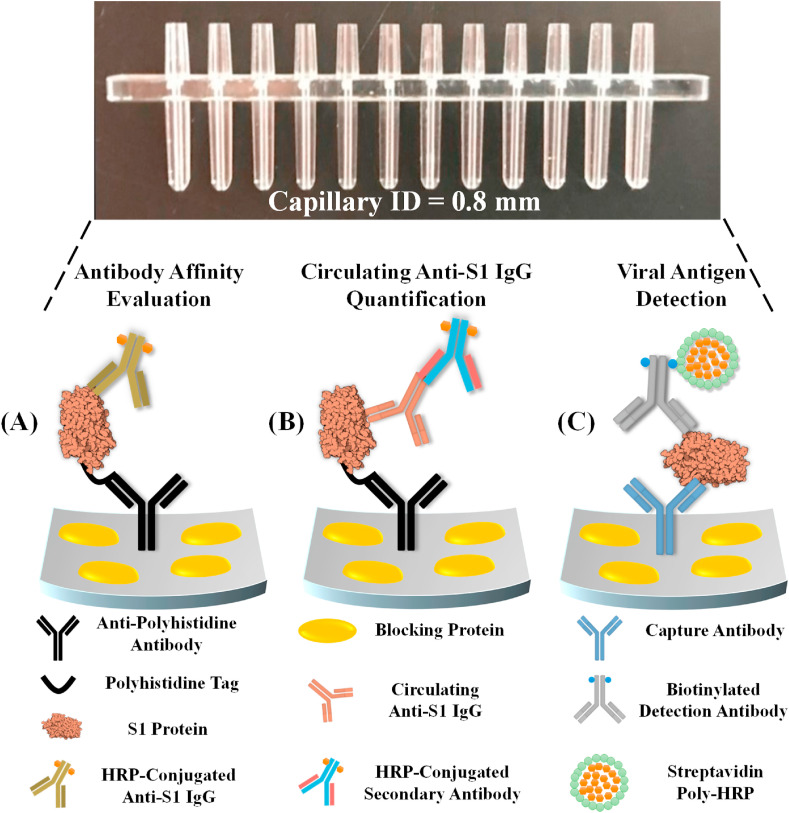
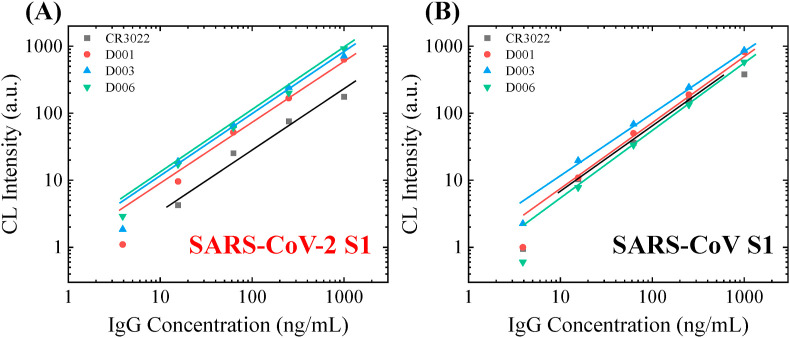
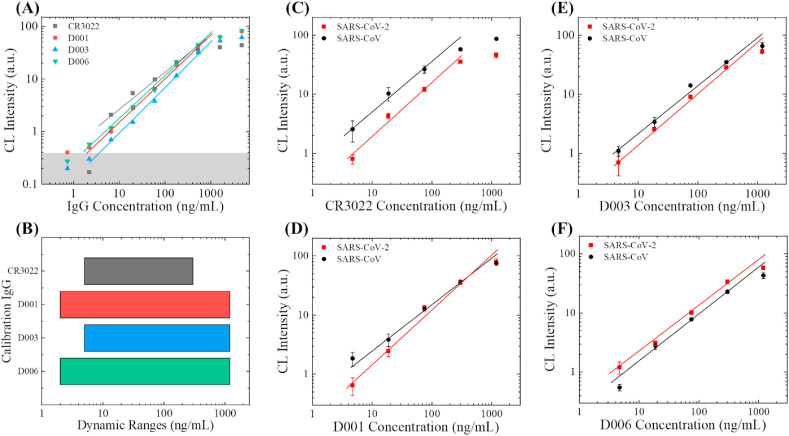
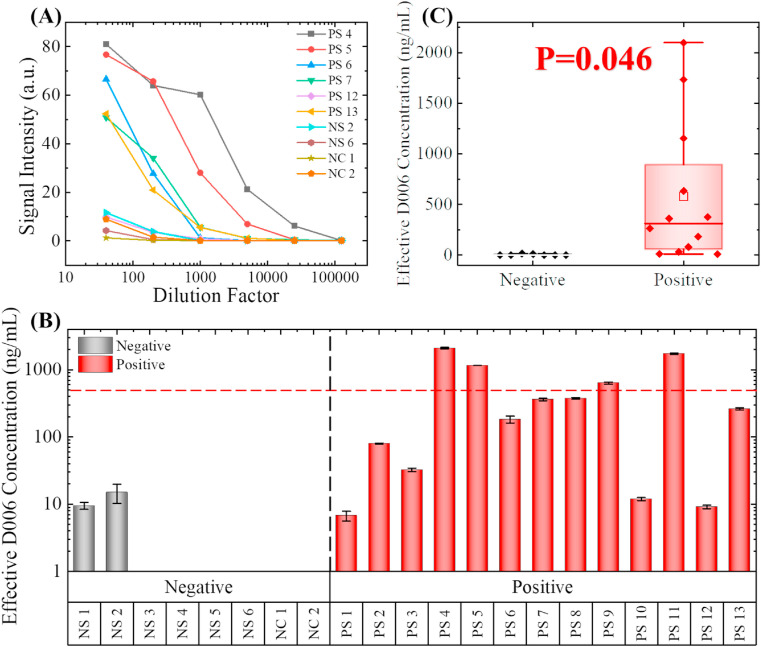
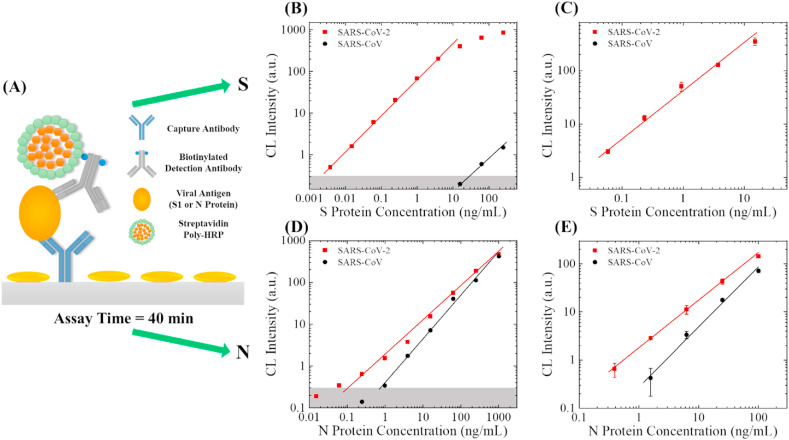
Convalescent serum with a high abundance of neutralization IgG is a promising therapeutic agent for rescuing COVID-19 patients in the critical stage. Knowing the concentration of SARS-CoV-2 S1-specific IgG is crucial in selecting appropriate convalescent serum donors. Here, we present a portable microfluidic ELISA technology for rapid (15 min), quantitative, and sensitive detection of anti-SARS-CoV-2 S1 IgG in human serum with only 8 μL sample volume. We first identified a humanized monoclonal IgG that has a high binding affinity and a relatively high specificity towards SARS-CoV-2 S1 protein, which can subsequently serve as the calibration standard of anti-SARS-CoV-2 S1 IgG in serological analyses. We then measured the abundance of anti-SARS-CoV-2 S1 IgG in 16 convalescent COVID-19 patients. Due to the availability of the calibration standard and the large dynamic range of our assay, we were able to identify "qualified donors" for convalescent serum therapy with only one fixed dilution factor (200 ×). Finally, we demonstrated that our technology can sensitively detect SARS-CoV-2 antigens (S1 and N proteins) with pg/mL level sensitivities in 40 min. Overall, our technology can greatly facilitate rapid, sensitive, and quantitative analysis of COVID-19 related markers for therapeutic, diagnostic, epidemiologic, and prognostic purposes.

Keywords: Antibody detection; COVID-19; Immunoassay; Microfluidics.


Conflict of interest statement

The authors declare the following financial interests/personal relationships which may be considered as potential competing interests: The authors declare the following competing financial interest): M. K. K. O. and X. F. are co-founders of and have an equity interest in Optofluidic Bioassay, LLC.

Figures

Fig. 1
Fig. 1
Graphical illustrations of the COVID-19 related immunoassays that were performed with our microfluidic chemiluminescent ELISA platform, including (A) affinity evaluation of calibration antibodies, (B) detection of circulating anti-SARS-CoV-2 S1 IgG in serum samples, and (C) detection of SARS-CoV-2 antigens such as S1 and N protein.
Fig. 2
Fig. 2
Affinity screening of the calibration antibodies. (A) Calibration curves of 4 different monoclonal humanized S1 specific IgG against the S1 protein from SARS-CoV-2. (B) Calibration curves of 4 different monoclonal humanized S1 specific IgG against the S1 protein from SARS-CoV (B). The solid lines are the linear fit of the data in the log-log scale. D006 is the only antibody that has a high affinity and high specificity towards SARS-CoV-2 S1. Illustration of the assay mechanism, which uses a single-step ELISA format, is shown in Fig. 1(A). The sample-to-answer time of this assay is 8 min.
Fig. 3
Fig. 3
Evaluation of anti-S1 calibration antibodies. (A) Entire dynamic ranges for the detection of the four humanized monoclonal antibodies (against SARS-CoV-2 S1). The concentrations were prepared from 3 times of serial dilution (starting from 4800 ng/mL). The averaged background is subtracted from all data points. The solid lines are the linear fit of the data in the log-log scale. The grey shaded area marks 3 × standard deviation of the background. (B) Comparison of the linear dynamic ranges. (C)–(F) Detection of the calibration antibodies in 50 times diluted serum, against the S1 protein from SARS-CoV-2 (red squares) and SARS-CoV (black circles). The calibration curves are generated with three different monoclonal humanized antibodies (CR3022 in (C), D001 in (D), D003 in (E), and D006 in (D)). The solid lines are the linear fit for the data in the log-log scale. Error bars are generated from duplicate measurements. (For interpretation of the references to colour in this figure legend, the reader is referred to the Web version of this article.)
Fig. 4
Fig. 4
Detection of anti-S1 IgG in recovered COVID-19 patients' serum. (A) Serial dilution tests with 10 representative samples, including six positive samples (PS), two negative samples (NS), and two commercially available negative controls (NC). Note that the positive/negative was determined with traditional plate-based ELISA. 200 X dilution in 2.5% BSA was determined to be the optimum dilution factor for differentiating the strong positive samples from the weak positive and negative samples. (B). Effective D006 concentrations for all nineteen samples and the two negative controls. The concentrations are marked as 0 ng/mL if the calculated concentration was below 2 ng/mL (too close to LLOD). The error bars are generated from duplicate measurements. Only four samples have effective D006 concentrations higher than 500 ng/mL after 200 times of dilution. (Note that PS4 and PS11 exceeded the upper limit of detection). (C). Statistical comparison between the negative samples and the positive samples. Since p < 0.05, the difference between these two groups is statistically significant.
Fig. 5
Fig. 5
SARS-CoV-2 antigen detection. (A) Illustration of the assay mechanism. The sample-to-answer time of this assay is 40 min. (B) Entire dynamic ranges of SARS-CoV-2 S1 protein (red squares) and SARS-CoV S1 protein (black circles) in 10 times diluted human serum. The averaged background is subtracted from all data points. The solid lines are the linear fit of the data in the log-log scale. The grey shaded area marks 3 × standard deviation of the background. The lower limit of detection (LLOD) for SARS-CoV-2 S1 protein is 0.004 ng/mL <0.01% cross reactivity was observed with SARS-CoV S1 protein. (C) Calibration curves for S1 proteins between 0.06 and 15 ng/mL. The error bars are generated from duplicate measurements. (D) Entire dynamic ranges of SARS-CoV-2 N protein (red squares) and SARS-CoV N protein (black circles) in 10 times diluted human serum. The averaged background is subtracted from all data points. The solid lines are the linear fit of the data in the log-log scale. The grey shaded area marks 3 × standard deviation of the background. The lower limit of detection (LLOD) for SARS-CoV-2 N protein and SARS-CoV S1 are 0.06 ng/mL and 1 ng/mL, respectively. (E) Calibration curves for N proteins between 0.39 and 100 ng/mL. The error bars are generated from duplicate measurements. (For interpretation of the references to colour in this figure legend, the reader is referred to the Web version of this article.)

References

    1. Amanat F., Stadlbauer D., Strohmeier S., Nguyen T.H., Chromikova V., McMahon M., Jiang K., Arunkumar G.A., Jurczyszak D., Polanco J. Nat. Med. 2020;26:1033–1036. - PMC - PubMed
    1. Arnold S., Ramjit R., Keng D., Kolchenko V., Teraoka I. Faraday Discuss. 2008;137:65–83. - PubMed
    1. Bloch E.M., Shoham S., Casadevall A., Sachais B.S., Shaz B., Winters J.L., van Buskirk C., Grossman B.J., Joyner M., Henderson J.P. J. Clin. Invest. 2020;130(6):2757–2765. - PMC - PubMed
    1. Brouwer P.J.M., Caniels T.G., van der Straten K., Snitselaar J.L., Aldon Y., Bangaru S., Torres J.L., Okba N.M.A., Claireaux M., Kerster G., Bentlage A.E.H., van Haaren M.M., Guerra D., Burger J.A., Schermer E.E., Verheul K.D., van der Velde N., van der Kooi A., van Schooten J., van Breemen M.J., Bijl T.P.L., Sliepen K., Aartse A., Derking R., Bontjer I., Kootstra N.A., Wiersinga W.J., Vidarsson G., Haagmans B.L., Ward A.B., de Bree G.J., Sanders R.W., van Gils M.J. Science. 2020;369(6504):643–650. - PMC - PubMed
    1. Cao Y., Su B., Guo X., Sun W., Deng Y., Bao L., Zhu Q., Zhang X., Zheng Y., Geng C. Cell. 2020;182(1):73–84. - PMC - PubMed

Publication types

MeSH terms