

A Ship Trajectory Prediction Framework Based on a Recurrent Neural Network
- PMID: 32916845
- PMCID: PMC7570964
- DOI: 10.3390/s20185133
A Ship Trajectory Prediction Framework Based on a Recurrent Neural Network
Abstract
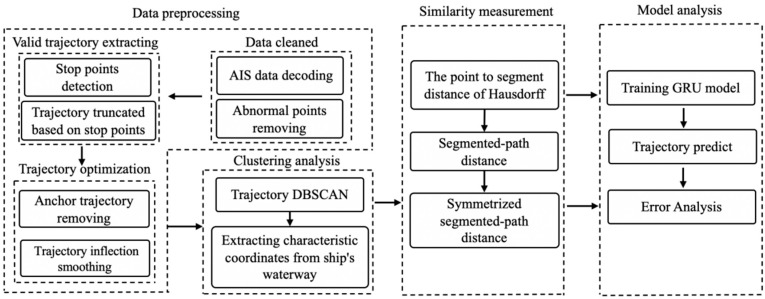
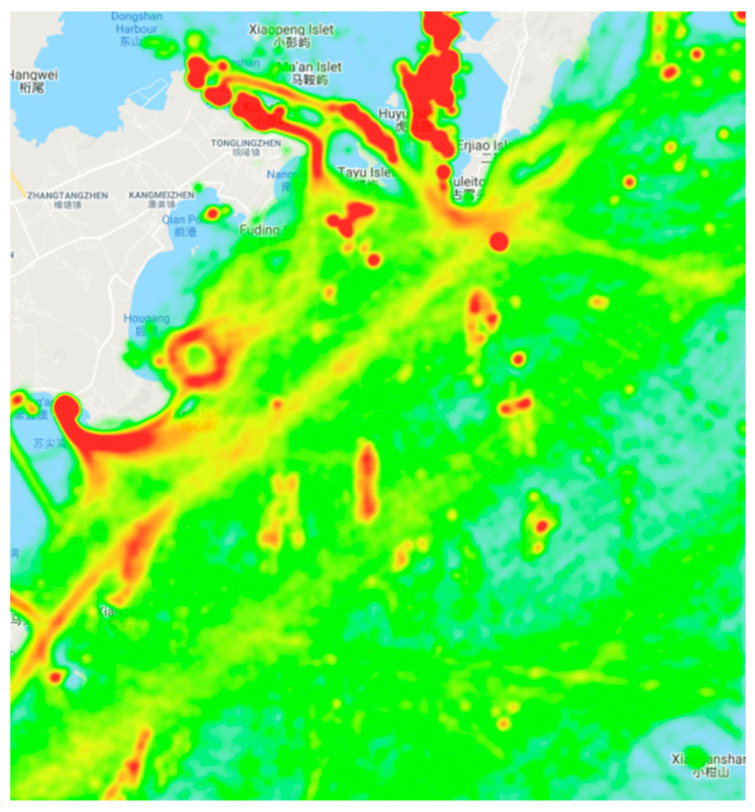
Ship trajectory prediction is a key requisite for maritime navigation early warning and safety, but accuracy and computation efficiency are major issues still to be resolved. The research presented in this paper introduces a deep learning framework and a Gate Recurrent Unit (GRU) model to predict vessel trajectories. First, series of trajectories are extracted from Automatic Identification System (AIS) ship data (i.e., longitude, latitude, speed, and course). Secondly, main trajectories are derived by applying the Density-Based Spatial Clustering of Applications with Noise (DBSCAN) algorithm. Next, a trajectory information correction algorithm is applied based on a symmetric segmented-path distance to eliminate the influence of a large number of redundant data and to optimize incoming trajectories. A recurrent neural network is applied to predict real-time ship trajectories and is successively trained. Ground truth data from AIS raw data in the port of Zhangzhou, China were used to train and verify the validity of the proposed model. Further comparison was made with the Long Short-Term Memory (LSTM) network. The experiments showed that the ship's trajectory prediction method can improve computational time efficiency even though the prediction accuracy is similar to that of LSTM.
Keywords: DBSCAN; GRU; LSTM; deep learning; redundant data; trajectory prediction.
Conflict of interest statement
The authors declare no conflict of interest. The funders had no role in the design of the study; in the collection, analyses, or interpretation of data; in the writing of the manuscript, or in the decision to publish the results.
Figures


References
-
- Perera L.P., Oliveira P., Soares C.G. Maritime traffic monitoring based on vessel detection, tracking, state estimation, and trajectory prediction. IEEE Trans. Intell. Transp. Syst. 2012;13:1188–1200. doi: 10.1109/TITS.2012.2187282. - DOI
-
- Praetorius G. Ph.D. Thesis. Chalmers University of Technology; Göteborg, Sweden: 2014. Vessel Traffic Service (VTS): A Maritime Information Service or Traffic Control System? Understanding Everyday Performance and Resilience in a Socio-technical System Under Change.
-
- Guo S., Liu C., Guo Z., Feng Y., Hong F., Huang H. Trajectory prediction for ocean vessels base on K-order multivariate Markov chain; Proceedings of the International Conference on Wireless Algorithms; Tianjin, China. 20–22 June 2018; pp. 140–150.
-
- Hexeberg S., Flåten A.L., Eriksen B.H., Brekke E. AIS-based vessel trajectory prediction; Proceedings of the 2017 20th International Conference on Information Fusion (Fusion); Xi’an, China. 10–13 July 2017; pp. 1–8.
-
- Anderson S., Barfoot T.D., Tong C.H., Särkkä S. Batch nonlinear continuous-time trajectory estimation as exactly sparse Gaussian process regression. Auton. Robot. 2015;39:221–238. doi: 10.1007/s10514-015-9455-y. - DOI
Grants and funding
LinkOut - more resources
Full Text Sources
