. 2020 Sep 9;12(9):2745.
doi: 10.3390/nu12092745.

Towards Win-Win Policies for Healthy and Sustainable Diets in Switzerland

Affiliations

Towards Win-Win Policies for Healthy and Sustainable Diets in Switzerland

Alexi Ernstoff et al. Nutrients. .

Abstract

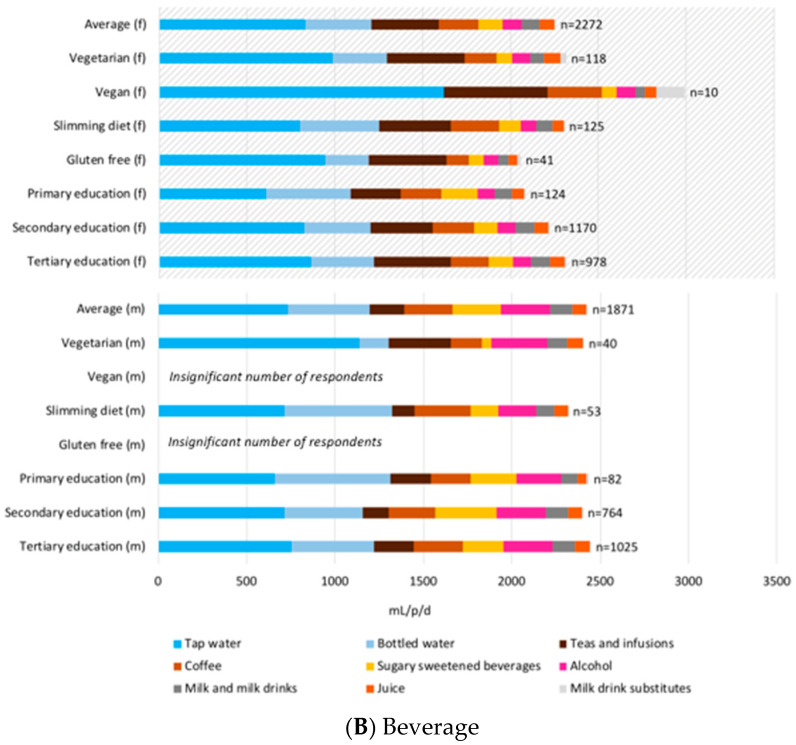
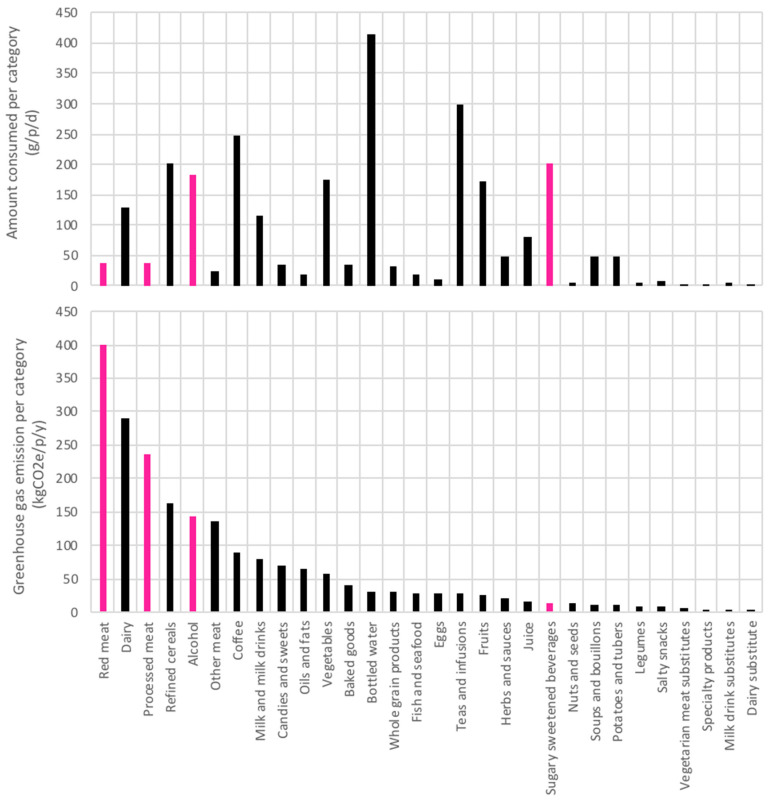
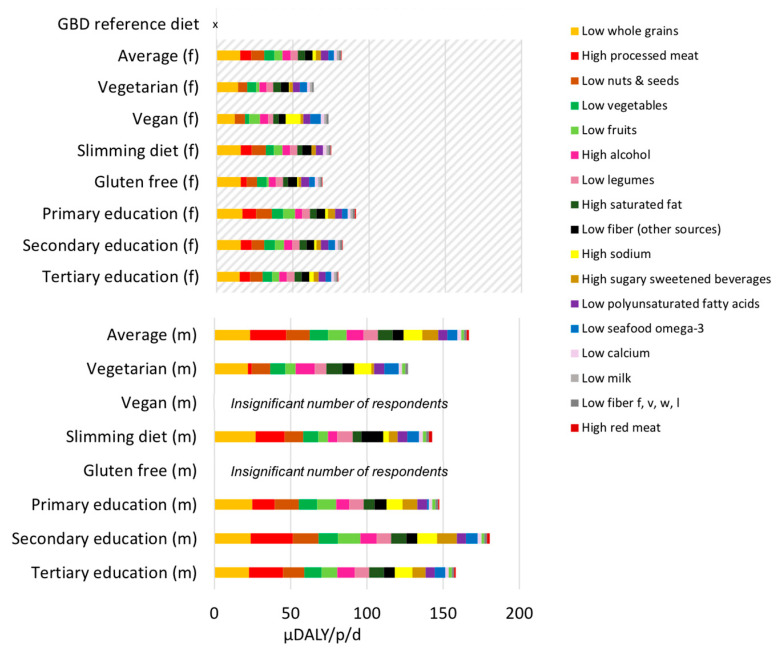
The first Swiss national dietary survey (MenuCH) was used to screen disease burdens and greenhouse gas emissions (GHG) of Swiss diets (vegan, vegetarian, gluten-free, slimming), with a focus on gender and education level. The Health Nutritional Index (HENI), a novel disease burden-based nutritional index built on the Global Burden of Disease studies, was used to indicate healthiness using comparable, relative disease burden scores. Low whole grain consumption and high processed meat consumption are priority risk factors. Non-processed red meat and dairy make a nearly negligible contribution to disease burden scores, yet are key drivers of diet-related GHGs. Swiss diets, including vegetarian, ranged between 1.1-2.6 tons of CO2e/person/year, above the Swiss federal recommendation 0.6 ton CO2e/person/year for all consumption categories. This suggests that only changing food consumption practices will not suffice towards achieving carbon reduction targets: Systemic changes to food provisioning processes are also necessary. Finally, men with higher education had the highest dietary GHG emissions per gram of food, and the highest disease burden scores. Win-win policies to improve health and sustainability of Swiss diets would increase whole grain consumption for all, and decrease alcohol and processed meat consumption especially for men of higher education levels.

Keywords: climate; diet survey; disease burden; gender; sustainability; vegan; vegetarian.


Conflict of interest statement

While there is no direct conflict of interest and this research was carried out independently of any influence, Quantis international and University of Michigan have developed databases and performed other analyses in interaction with multiple public and private actors of the food sector.

Figures

Figure 1
Figure 1
Swiss dietary consumptions for (A) food and (B) beverage categories; series (food categories) are ordered from most to the least consumed in the average diet; upper charts with diagonal shading are results for women (female, f), and lower charts results for men (m). The number of survey responses (“n =”) for each diet-gender combination is demonstrated on the graph. Results for male vegans and gluten free diets had less than 10 survey respondents and therefore statistically weak and not shown for comparison. Results for female vegans should be interpreted with caution due to the low respondent amount of n = 10. Source: Office federal de la sécurité alimentaire et des affaire vétérinaires: enquête national sur l’alimentation menuCH 2014/2015.
Figure 1
Figure 1
Swiss dietary consumptions for (A) food and (B) beverage categories; series (food categories) are ordered from most to the least consumed in the average diet; upper charts with diagonal shading are results for women (female, f), and lower charts results for men (m). The number of survey responses (“n =”) for each diet-gender combination is demonstrated on the graph. Results for male vegans and gluten free diets had less than 10 survey respondents and therefore statistically weak and not shown for comparison. Results for female vegans should be interpreted with caution due to the low respondent amount of n = 10. Source: Office federal de la sécurité alimentaire et des affaire vétérinaires: enquête national sur l’alimentation menuCH 2014/2015.
Figure 2
Figure 2
Total GHG emissions for Swiss diets for (A) food and (B) beverage categories; note the different scale between the figures; series are ordered from most consumed to the least consumed category in the average diet as shown in Figure 1A,B. Upper charts with diagonal shading are results for women (female, f), and lower charts results for men (m). Results for male vegans and gluten free diets had less than 10 survey respondents and therefore statistically weak and not shown for comparison. Results for female vegans should be interpreted with caution due to the low respondent amount of n = 10.
Figure 3
Figure 3
Total GHG per person per year per food category ranked from highest to lowest and associated quantity consumed as grams per person per day (g/p/d). Food categories in pink are also associated with a detrimental health impact score.
Figure 4
Figure 4
Disease burden scores in micro (μ) disability adjusted life years (DALY) per person per day (where 1 μDALY is about equal to 30 s of life lost). Risk factors are shown in color and ordered starting from the maximum contributor to disease burden (low whole grains) to minimum disease burden (high red meat) in the average diet (men and women). The demonstrated scores are in relation to the global burden of disease (GBD) reference diet which has a score of zero, to be interpreted that there is zero incurred disease risk when each risk factor is consumed at its theoretical minimum risk level (TMRL). The category “Fiber f, v, w, l” indicates fibers from fruits, vegetables, whole grains, and legumes, and “fibers (other sources)” from sources other than those. Note there were no data available on transfat consumption, so results are not shown. For risk factors listed as “high”, e.g., high processed meat, the interpretation is that disease risk is incurred due to consuming greater than the global burden of disease reference diet; for risk factors corresponding to diets “low” in an element e.g., “low whole grain”, the interpretation is that disease risk is incurred due to not consuming as much as the global burden of disease reference diet. Upper chart with diagonal shading presents results for women (female, f), and lower chart results for men (m).
Figure 5
Figure 5
The maximum theoretical reduction in disease burden (μDALY/p/d) in priority order (lower figure); corresponding dietary shift (g/p/d) as the difference between Swiss average consumption and theoretical minimum risk level (TMRL). The category “Fiber f, v, w, l” indicates fibers from fruits, vegetables, whole grains, and legumes, and “fibers (other sources)” from sources other than those. Note there were no data available on transfat consumption, so results are not shown. Red bars indicate foods where consumption needs to decrease, and blue bars were consumption needs to increase in order to reach the global burden of disease reference diet with zero risk, i.e., the TMRL. The seafood omega-3 dietary shift corresponds to increasing fish consumption by 50 g/p/d given the average fish consumption in Switzerland and its omega-3 content. The alcohol dietary shift corresponds to decreasing about 1 dL/p/d of wine at 12% alcohol, or 2 dL of beer at 6% alcohol.

References

    1. Springmann M., Wiebe K., Mason-D’Croz D., Sulser T.B., Rayner M., Scarborough P. Health and nutritional aspects of sustainable diet strategies and their association with environmental impacts: A global modelling analysis with country-level detail. Lancet Planet. Health. 2018;2:e451–e461. doi: 10.1016/S2542-5196(18)30206-7. - DOI - PMC - PubMed
    1. Willett W., Rockström J., Loken B., Springmann M., Lang T., Vermeulen S., Garnett T., Tilman D., Declerck F., Wood A., et al. Food in the Anthropocene: The EAT–Lancet Commission on healthy diets from sustainable food systems. Lancet. 2019;393:447–492. doi: 10.1016/S0140-6736(18)31788-4. - DOI - PubMed
    1. Moodie R., Stuckler D., Monteiro C., Sheron N., Neal B., Thamarangsi T., Lincoln P., Casswell S., Moodie R. Profits and pandemics: Prevention of harmful effects of tobacco, alcohol, and ultra-processed food and drink industries. Lancet. 2013;381:670–679. doi: 10.1016/S0140-6736(12)62089-3. - DOI - PubMed
    1. Stuckler D., Nestle M. Big Food, Food Systems, and Global Health. PLoS Med. 2012;9:e1001242. doi: 10.1371/journal.pmed.1001242. - DOI - PMC - PubMed
    1. Monteiro C.A., Levy R.B., Claro R.M., De Castro I.R.R., Cannon G. Increasing consumption of ultra-processed foods and likely impact on human health: Evidence from Brazil. Public Health Nutr. 2010;14:5–13. doi: 10.1017/S1368980010003241. - DOI - PubMed

Substances

LinkOut - more resources