

Genome-Wide Identification, Characterization and Expression Analysis of TCP Transcription Factors in Petunia
- PMID: 32916908
- PMCID: PMC7554992
- DOI: 10.3390/ijms21186594
Genome-Wide Identification, Characterization and Expression Analysis of TCP Transcription Factors in Petunia
Abstract
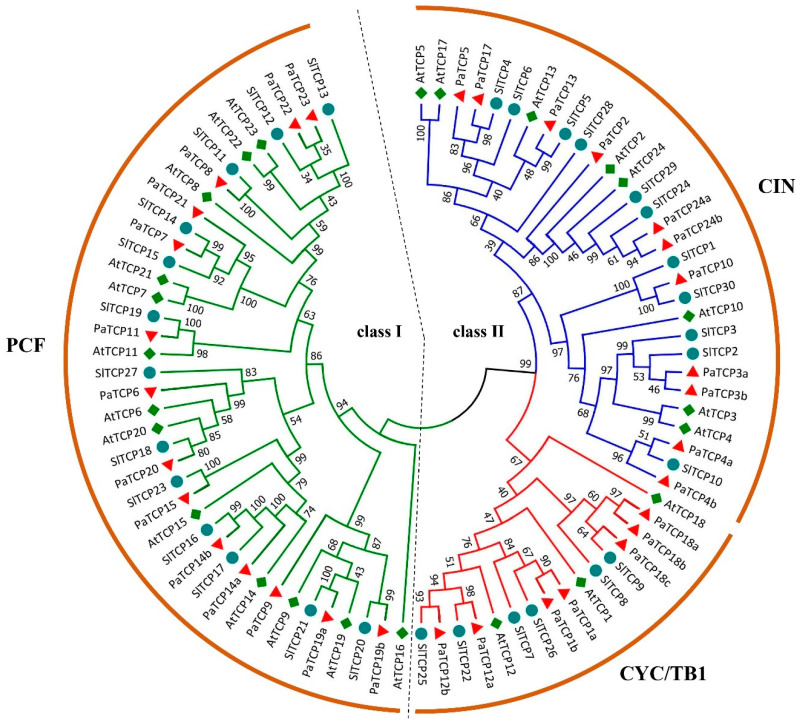
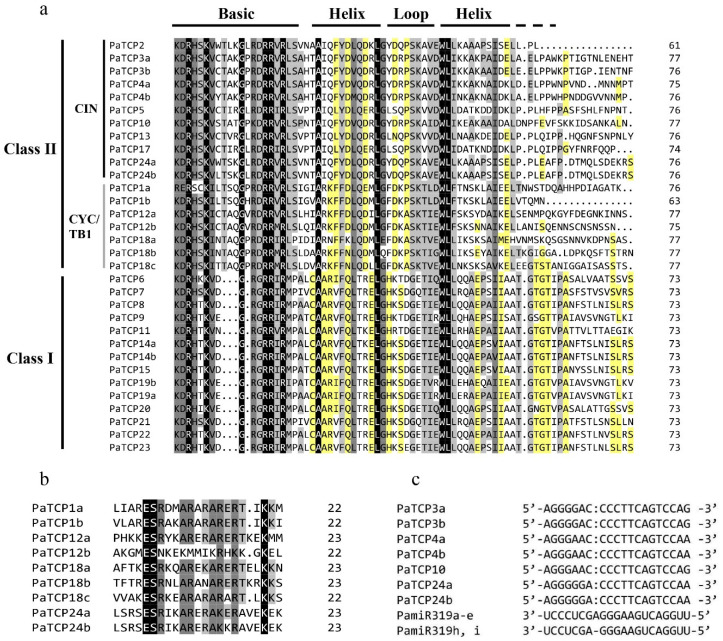
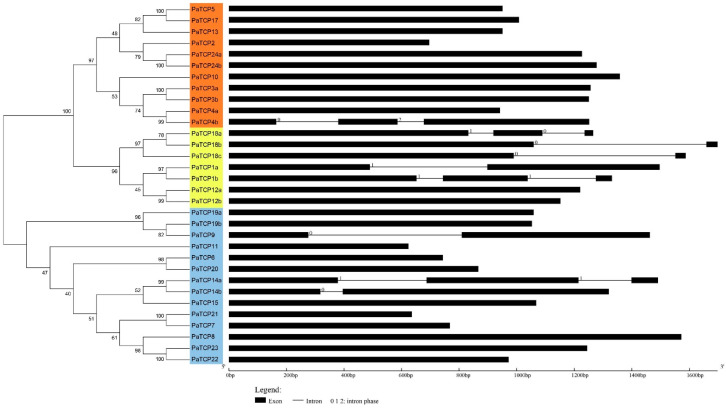
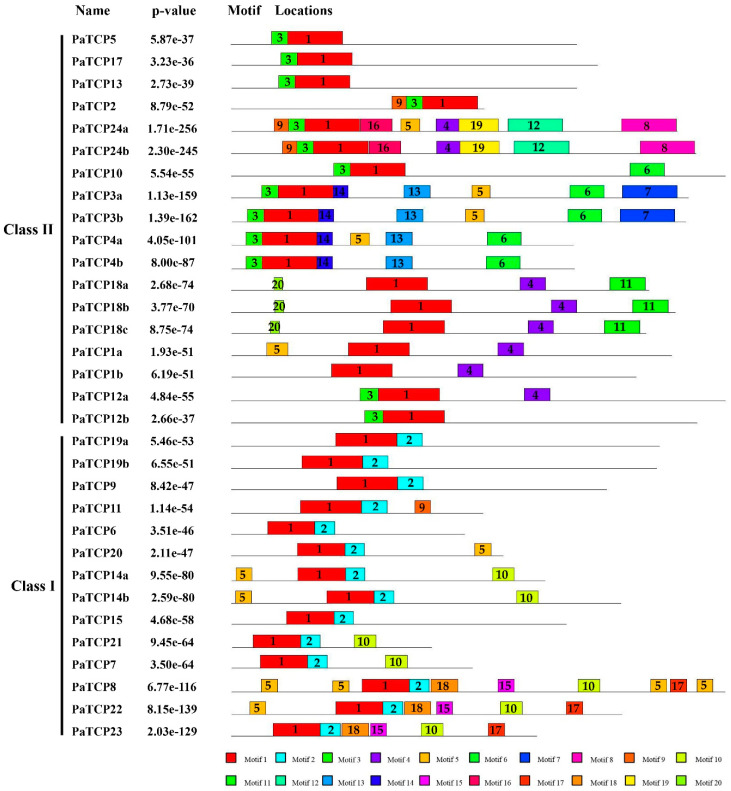
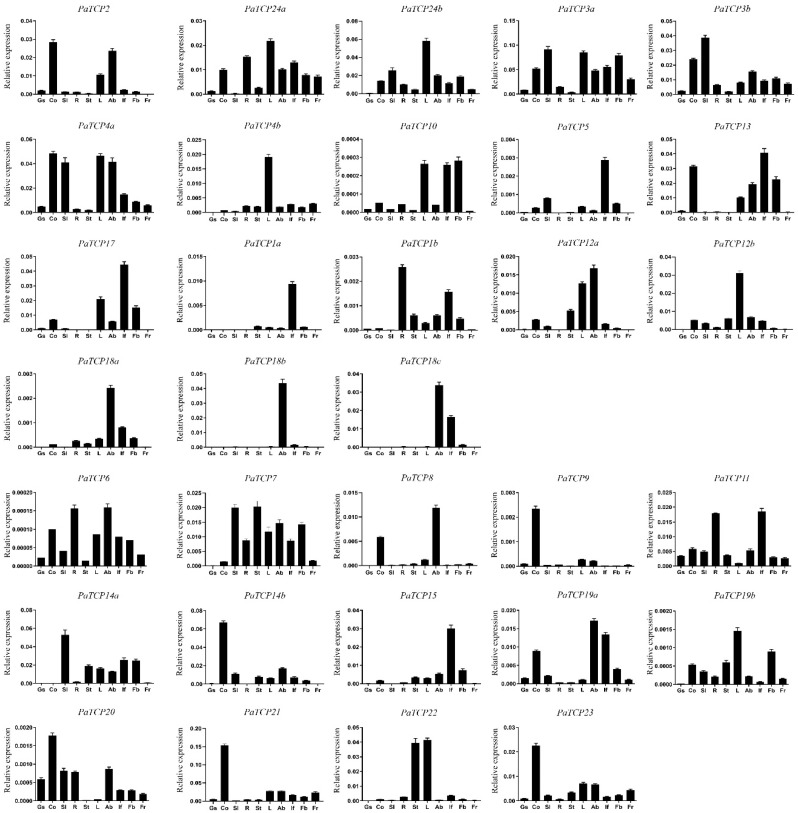
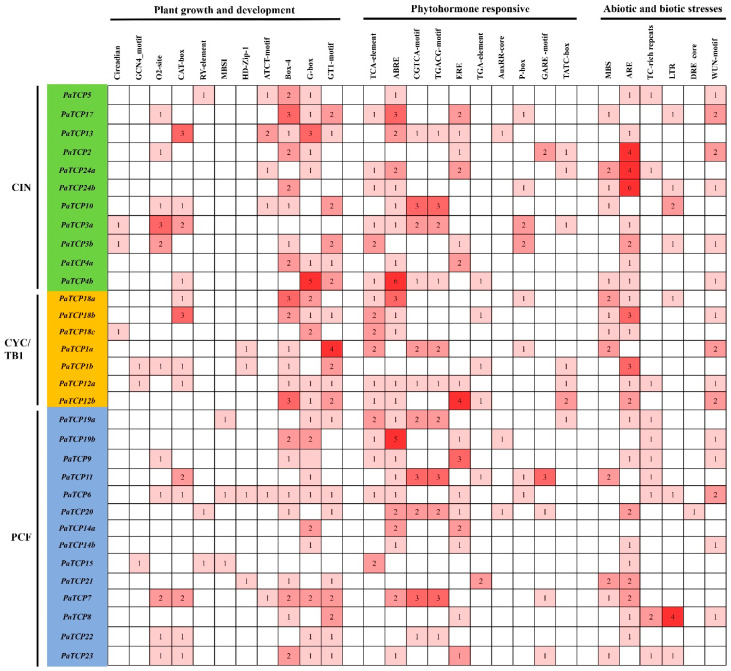
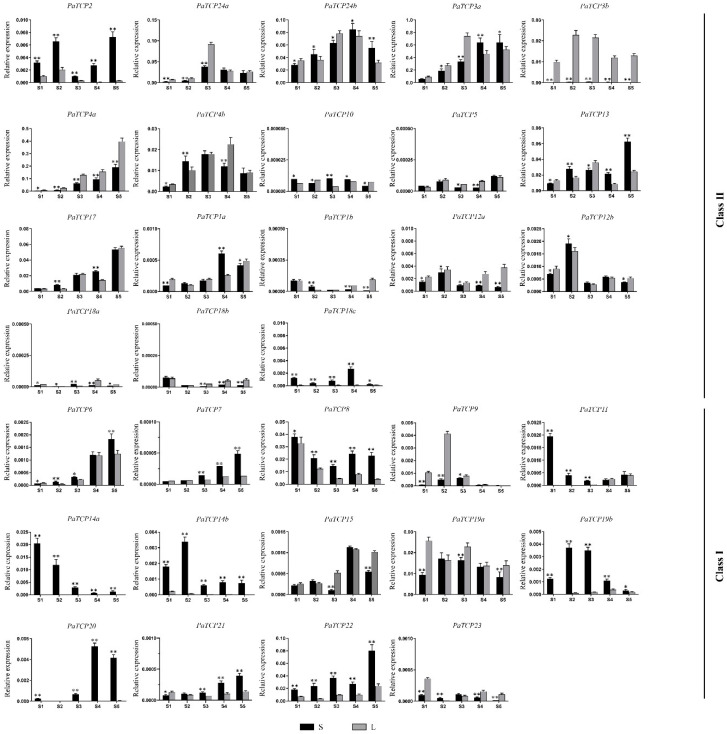
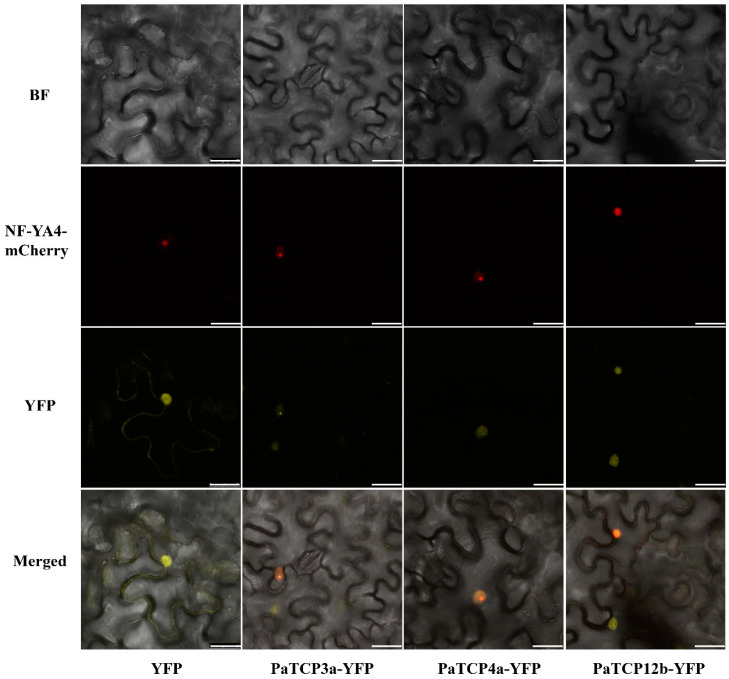
The plant-specific TCP transcription factors are well-characterized in both monocots and dicots, which have been implicated in multiple aspects of plant biological processes such as leaf morphogenesis and senescence, lateral branching, flower development and hormone crosstalk. However, no systematic analysis of the petunia TCP gene family has been described. In this work, a total of 66 petunia TCP genes (32 PaTCP genes in P. axillaris and 34 PiTCP genes in P. inflata) were identified. Subsequently, a systematic analysis of 32 PaTCP genes was performed. The phylogenetic analysis combined with structural analysis clearly distinguished the 32 PaTCP proteins into two classes-class Ι and class Ⅱ. Class Ⅱ was further divided into two subclades, namely, the CIN-TCP subclade and the CYC/TB1 subclade. Plenty of cis-acting elements responsible for plant growth and development, phytohormone and/or stress responses were identified in the promoter of PaTCPs. Distinct spatial expression patterns were determined among PaTCP genes, suggesting that these genes may have diverse regulatory roles in plant growth development. Furthermore, differential temporal expression patterns were observed between the large- and small-flowered petunia lines for most PaTCP genes, suggesting that these genes are likely to be related to petal development and/or petal size in petunia. The spatiotemporal expression profiles and promoter analysis of PaTCPs indicated that these genes play important roles in petunia diverse developmental processes that may work via multiple hormone pathways. Moreover, three PaTCP-YFP fusion proteins were detected in nuclei through subcellular localization analysis. This is the first comprehensive analysis of the petunia TCP gene family on a genome-wide scale, which provides the basis for further functional characterization of this gene family in petunia.
Keywords: TCP transcription factors; expression patterns; floral organ size; petal development; petunia.
Conflict of interest statement
The authors declare no conflict of interest. The funders had no role in the design and performance of the study nor in the writing of the manuscript.
Figures
Similar articles
-
Genome-wide identification and characterization of the SBP-box gene family in Petunia.BMC Genomics. 2018 Mar 12;19(1):193. doi: 10.1186/s12864-018-4537-9. BMC Genomics. 2018. PMID: 29703141 Free PMC article.
-
Genome-wide identification and characterization of the ALOG gene family in Petunia.BMC Plant Biol. 2019 Dec 30;19(1):600. doi: 10.1186/s12870-019-2127-x. BMC Plant Biol. 2019. PMID: 31888473 Free PMC article.
-
Genome-wide identification, genomic organization, and expression profiling of the CONSTANS-like (COL) gene family in petunia under multiple stresses.BMC Genomics. 2021 Oct 8;22(1):727. doi: 10.1186/s12864-021-08019-w. BMC Genomics. 2021. PMID: 34620088 Free PMC article.
-
TCP Transcription Factors in Plant Reproductive Development: Juggling Multiple Roles.Biomolecules. 2023 Apr 26;13(5):750. doi: 10.3390/biom13050750. Biomolecules. 2023. PMID: 37238620 Free PMC article. Review.
-
The Regulation of CIN-like TCP Transcription Factors.Int J Mol Sci. 2020 Jun 24;21(12):4498. doi: 10.3390/ijms21124498. Int J Mol Sci. 2020. PMID: 32599902 Free PMC article. Review.
Cited by
-
Genome-wide identification and characterization of TCP gene family in Dendrobium nobile and their role in perianth development.Front Plant Sci. 2024 Feb 5;15:1352119. doi: 10.3389/fpls.2024.1352119. eCollection 2024. Front Plant Sci. 2024. PMID: 38375086 Free PMC article.
-
Unraveling TEOSINTE BRANCHED1/CYCLOIDEA/PROLIFERATING CELL FACTOR Transcription Factors in Safflower: A Blueprint for Stress Resilience and Metabolic Regulation.Molecules. 2025 Jan 10;30(2):254. doi: 10.3390/molecules30020254. Molecules. 2025. PMID: 39860123 Free PMC article.
-
Systematic analysis and expression profiles of TCP gene family in Tartary buckwheat (Fagopyrum tataricum (L.) Gaertn.) revealed the potential function of FtTCP15 and FtTCP18 in response to abiotic stress.BMC Genomics. 2022 Jun 2;23(1):415. doi: 10.1186/s12864-022-08618-1. BMC Genomics. 2022. PMID: 35655134 Free PMC article.
-
Identification and Expression Analysis of TCP Transcription Factors Under Abiotic Stress in Phoebe bournei.Plants (Basel). 2024 Nov 3;13(21):3095. doi: 10.3390/plants13213095. Plants (Basel). 2024. PMID: 39520013 Free PMC article.
-
ECE-CYC1 Transcription Factor CmCYC1a May Interact with CmCYC2 in Regulating Flower Symmetry and Stamen Development in Chrysanthemum morifolium.Genes (Basel). 2025 Jan 26;16(2):152. doi: 10.3390/genes16020152. Genes (Basel). 2025. PMID: 40004481 Free PMC article.
References
MeSH terms
Substances
Grants and funding
LinkOut - more resources
Full Text Sources
