. 2020 Sep 9;20(18):5144.
doi: 10.3390/s20185144.

Experimental and Numerical Investigation on the Strain Response of Distributed Optical Fiber Sensors Bonded to Concrete: Influence of the Adhesive Stiffness on Crack Monitoring Performance

Affiliations

Experimental and Numerical Investigation on the Strain Response of Distributed Optical Fiber Sensors Bonded to Concrete: Influence of the Adhesive Stiffness on Crack Monitoring Performance

Ismail Alj et al. Sensors (Basel). .

Abstract

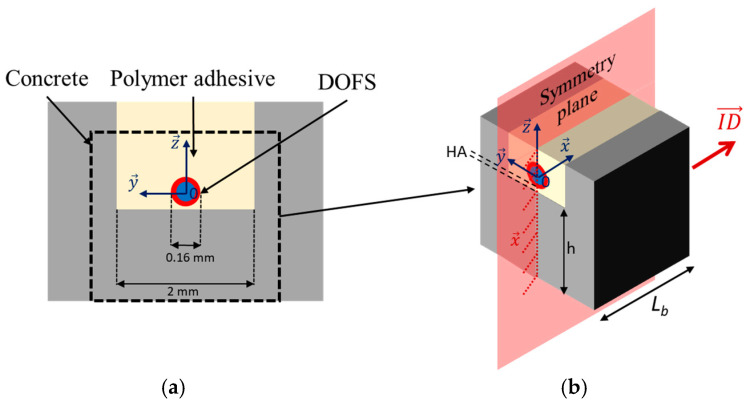
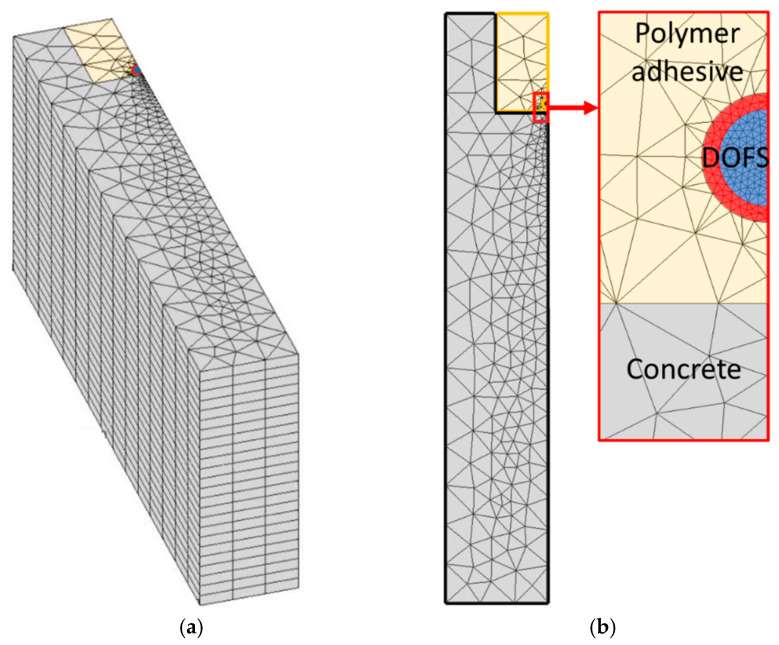
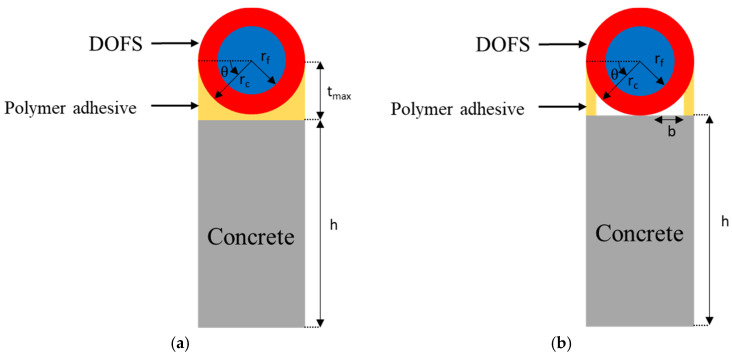
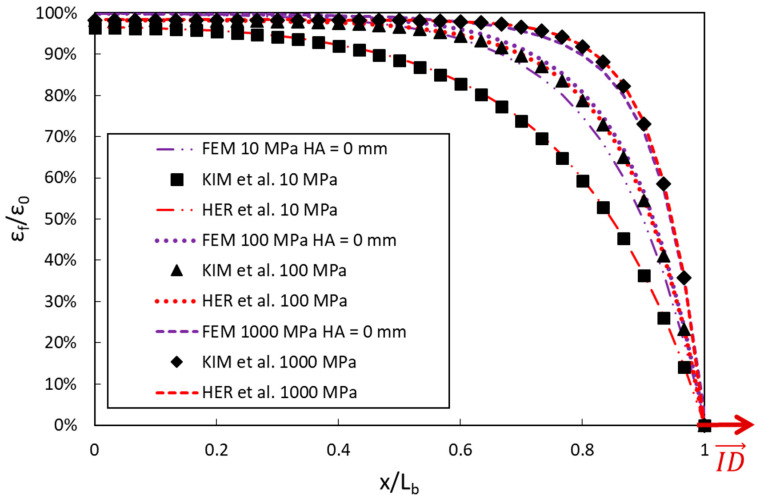
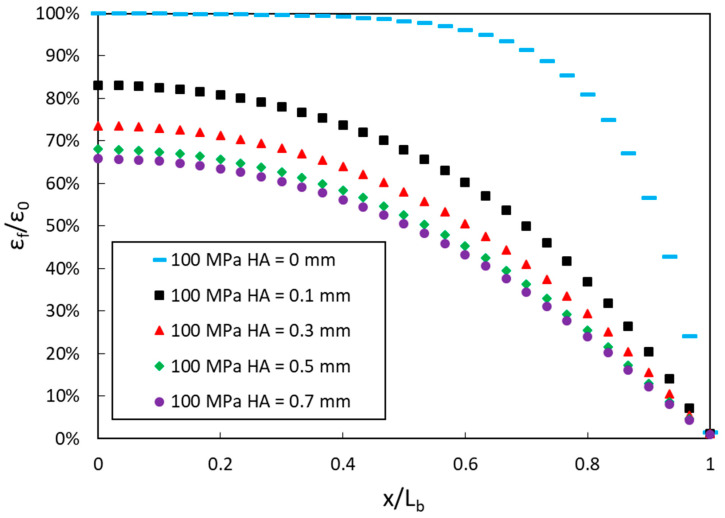
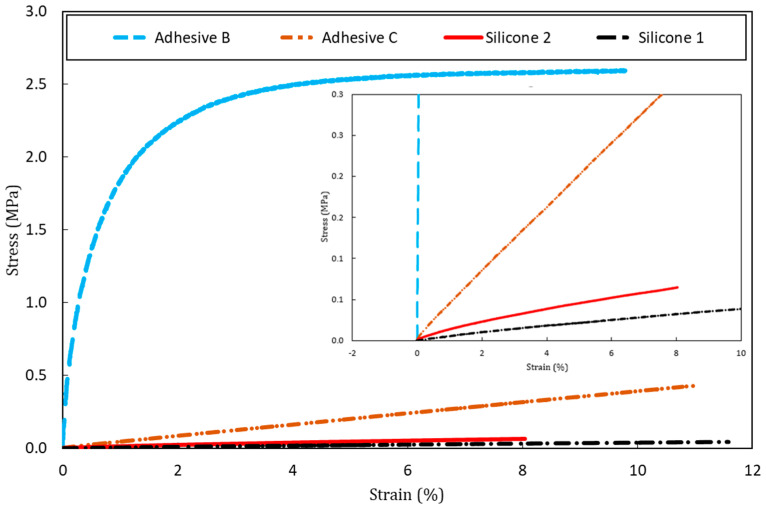
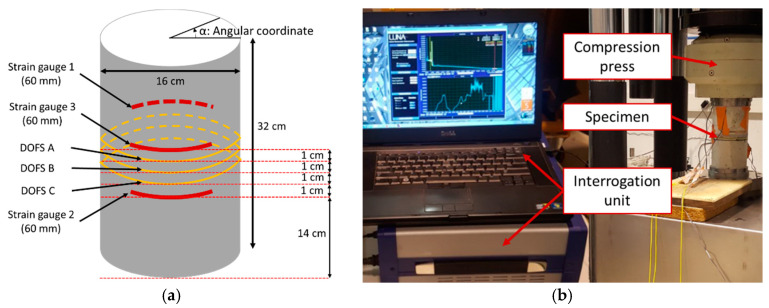
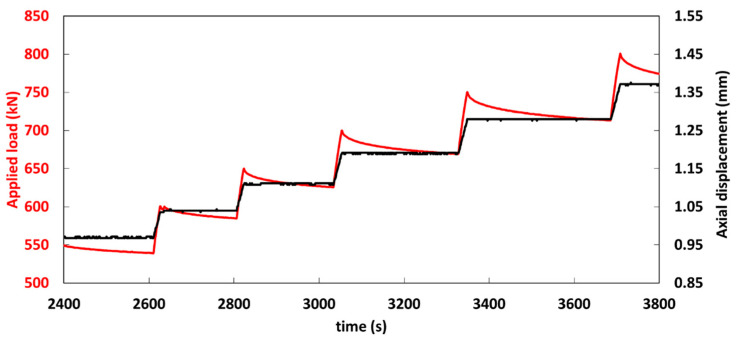
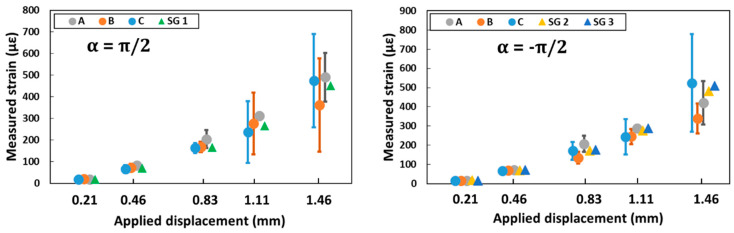
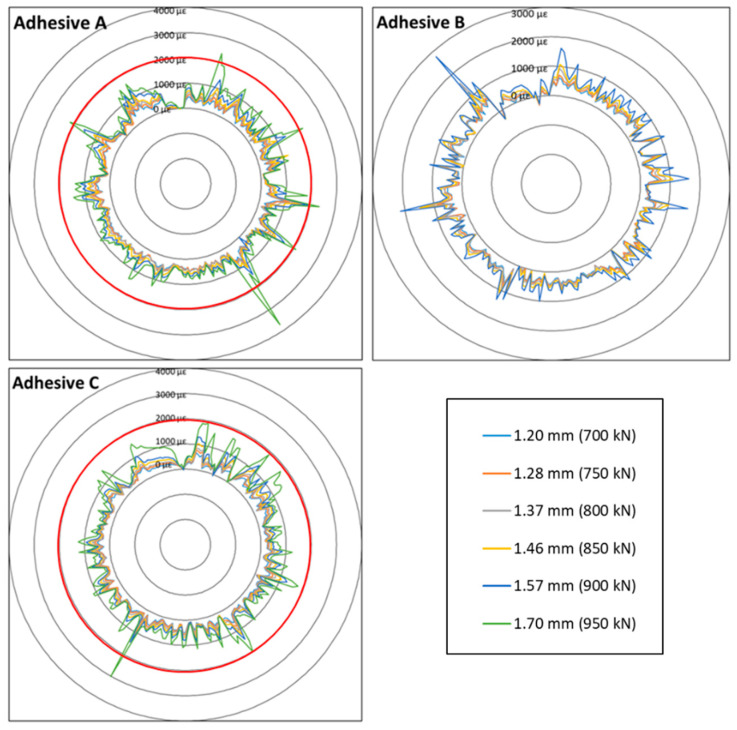
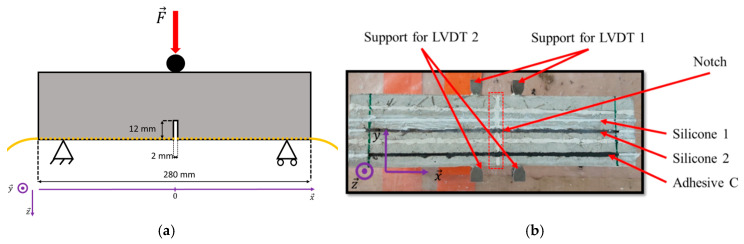
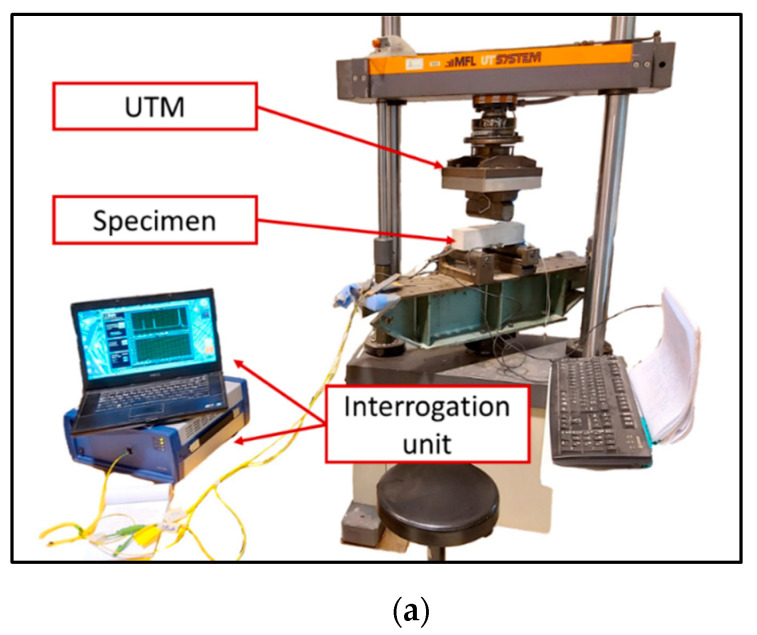
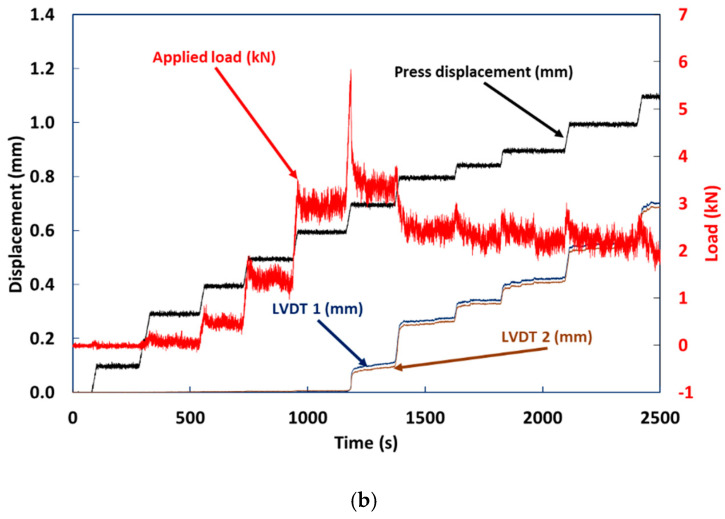
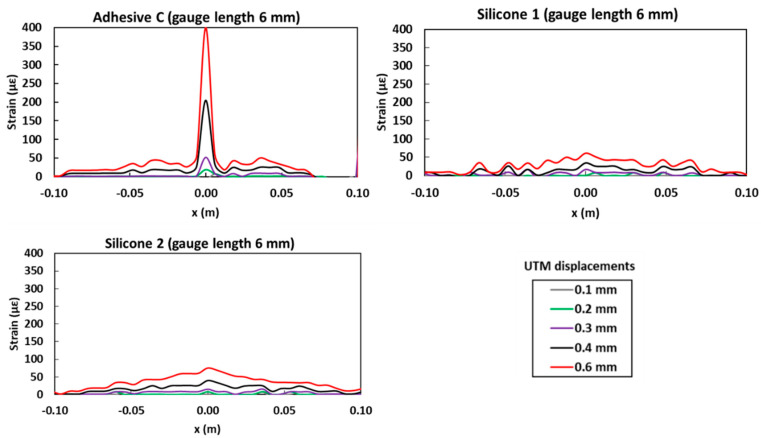
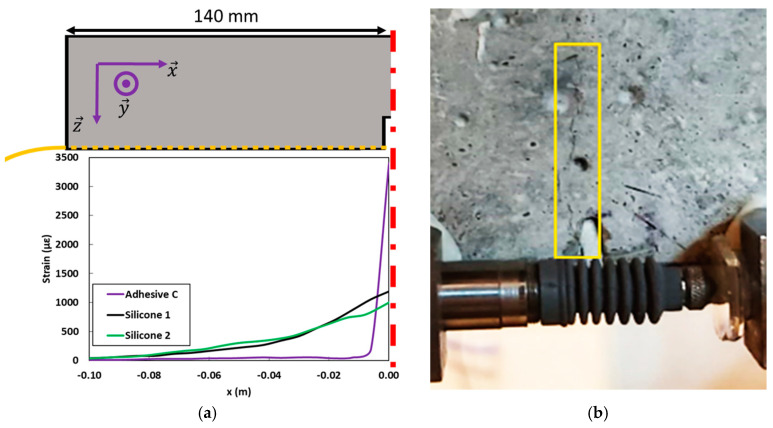
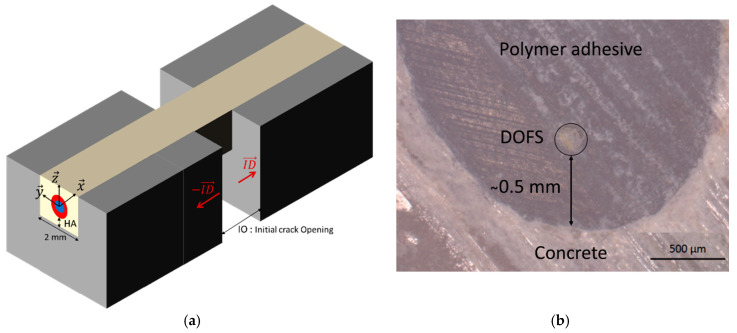
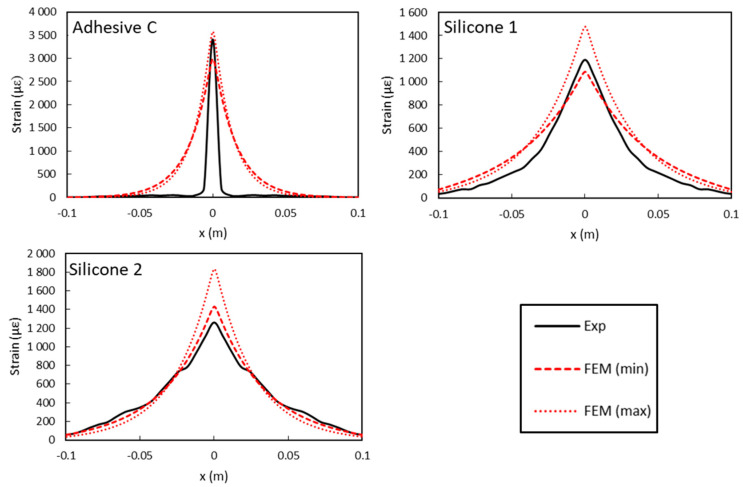
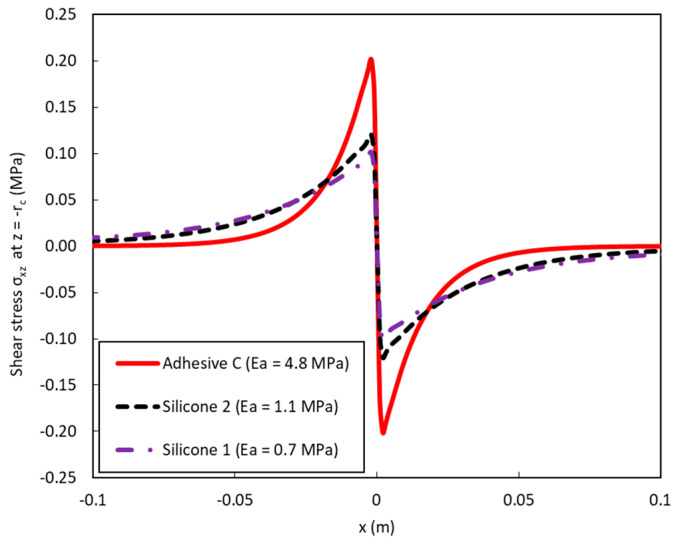
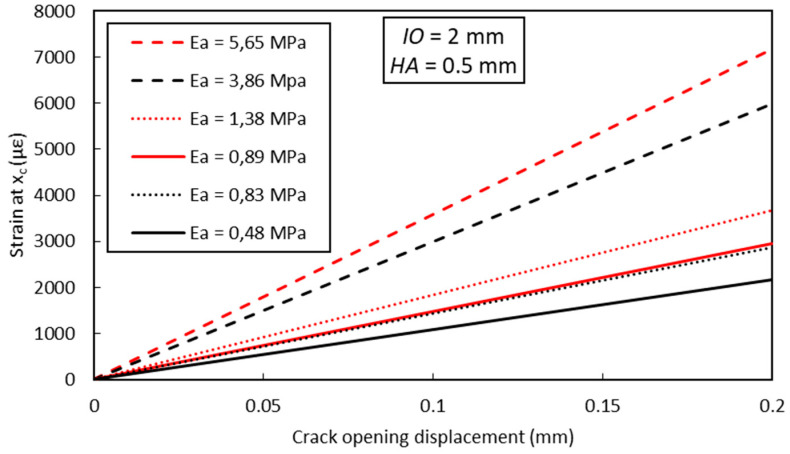
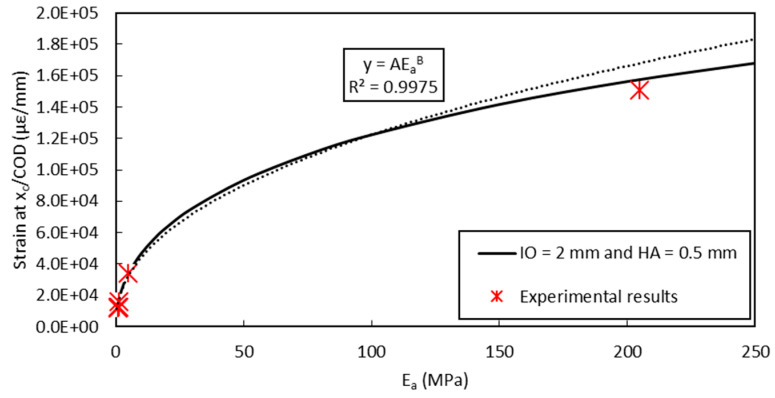
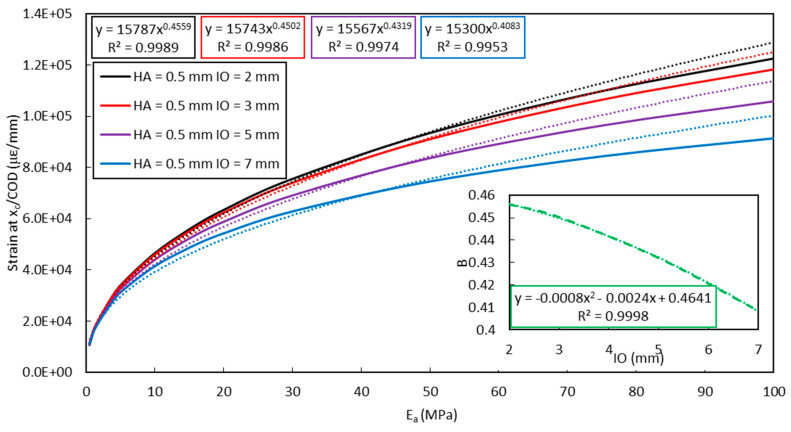
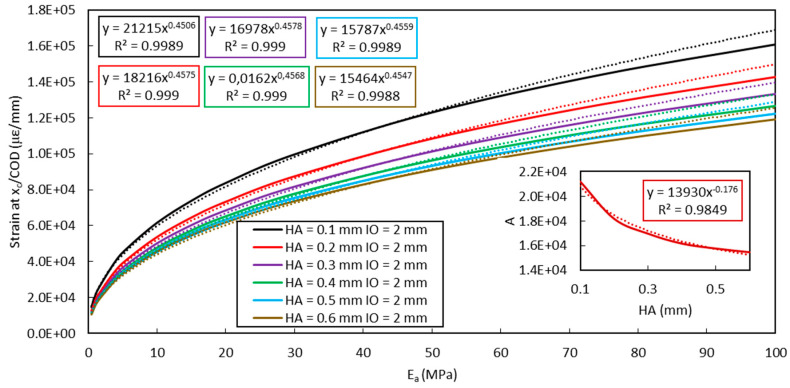
The present study investigated the strain response of a distributed optical fiber sensor (DOFS) sealed in a groove at the surface of a concrete structure using a polymer adhesive and aimed to identify optimal conditions for crack monitoring. A finite element model (FEM) was first proposed to describe the strain transfer process between the host structure and the DOFS core, highlighting the influence of the adhesive stiffness. In a second part, mechanical tests were conducted on concrete specimens instrumented with DOFS bonded/sealed using several adhesives exhibiting a broad stiffness range. Distributed strain profiles were then collected with an interrogation unit based on Rayleigh backscattering. These experiments showed that strain measurements provided by DOFS were consistent with those from conventional sensors and confirmed that bonding DOFS to the concrete structure using soft adhesives allowed to mitigate the amplitude of local strain peaks induced by crack openings, which may prevent the sensor from early breakage. Finally, the FEM was generalized to describe the strain response of bonded DOFS in the presence of crack and an analytical expression relating DOFS peak strain to the crack opening was proposed, which is valid in the domain of elastic behavior of materials and interfaces.

Keywords: Young’s modulus; crack opening; distributed optical fiber sensor (DOFS); finite element modelling; polymer adhesive; strain measurement.


Conflict of interest statement

The authors declare no conflicts of interest.

Figures

Figure 1
Figure 1
Simplified model used in the numerical simulation of the strain transfer process: (a) cross-sectional view of the system; (b) 3D model with boundary conditions.
Figure 2
Figure 2
Finite element mesh of (a) the 3D geometry and (b) the cross-sectional view of the system.
Figure 3
Figure 3
Schemes of the theoretical models developed by (a) Kim et al. [31] and (b) Her et al. [32].
Figure 4
Figure 4
Strain transfer curves provided by the analytical and numerical models, for different values of the adhesive stiffness.
Figure 5
Figure 5
Strain transfer curves provided by the finite element model (FEM) for different values of HA (height of adhesive from the bottom of the distributed optical fiber sensor (DOFS) to the concrete surface in the groove).
Figure 6
Figure 6
Experimental stress/strain curves collected from samples of the various adhesives subjected to tensile tests.
Figure 7
Figure 7
(a) Schematic description of the compressive test specimen; (b) experimental setup used for the compression test and the interrogation of DOFS.
Figure 8
Figure 8
Time evolutions of the applied displacement and corresponding load during the compression test.
Figure 9
Figure 9
Comparison of strain gauges (SGs) and optical fiber (OF) measurements.
Figure 10
Figure 10
Orthoradial strain profiles around the concrete cylinder, collected at different levels of compression load by DOFS bonded with the three different adhesives (A, B, and C).
Figure 11
Figure 11
(a) Scheme of the bending test configuration; (b) bottom view of the prismatic specimen used for the three-point bending test.
Figure 12
Figure 12
(a) Experimental setup used for the bending test; (b) recorded time evolutions of the applied load, actuator displacement, and LVDTs displacements.
Figure 12
Figure 12
(a) Experimental setup used for the bending test; (b) recorded time evolutions of the applied load, actuator displacement, and LVDTs displacements.
Figure 13
Figure 13
Strain profiles recorded by DOFS bonded to the concrete specimen with three soft adhesives (Adhesive C, Silicone 1, and Silicone 2).
Figure 14
Figure 14
(a) Strain profiles along the bonded DOFS at the sixth displacement plateau (over the half concrete prism only); (b) aspect of the crack near the initial notch.
Figure 15
Figure 15
(a) Simplified model for the numerical approach of the crack opening; (b) actual cross section of an instrumented specimen showing a DOFS sealed in a groove (optical micrograph).
Figure 16
Figure 16
Comparison of numerical simulations (considering extreme values of the adhesive Young’s modulus—min and max) with the experimental (exp) strain profiles (gauge length: 6 mm) collected by DOFS for a displacement of 0.7 mm of the universal testing machine (UTM) actuator.
Figure 17
Figure 17
Numerical simulations of shear stress σxz (x) at the adhesive/DOFS interface (z = −rc) considering opposite loads (0.045 MPa) applied to the two concrete blocks adjacent to the crack.
Figure 18
Figure 18
FEM calculation of the peak strain value versus crack opening displacement for different values of the adhesive elastic modulus.
Figure 19
Figure 19
Evolution curve of the shear lag parameter (at x = xc) versus the elastic modulus of the adhesive Ea: FEM simulation (solid line) with exponential regression (dotted line) and experimental results.
Figure 20
Figure 20
Evolution curves of the shear lag parameter (at x = xc) versus the adhesive Young’s modulus Ea, considering different IO values (FEM simulations in solid lines, exponential fitting in dotted lines). Dependence of parameter B on IO is also displayed as enclosed graph.
Figure 21
Figure 21
Evolution curves of the shear lag parameter (at x = xc) versus the adhesive Young’s modulus Ea, considering different HA values (FEM simulations in solid lines, exponential fitting in dotted lines). Dependence of parameter A on HA is also displayed as enclosed graph.

References

    1. Rodríguez G., Casas J.R., Villaba S. Cracking assessment in concrete structures by distributed optical fiber. Smart Mater. Struct. 2015;24:35005. doi: 10.1088/0964-1726/24/3/035005. - DOI
    1. Barrias A., Casas J.R., Villalba S. Fatigue performance of distributed optical fiber sensors in reinforced concrete elements. Constr. Build. Mater. 2019;218:214–223. doi: 10.1016/j.conbuildmat.2019.05.072. - DOI
    1. Ye X.W., Su Y.H., Han J.P. Structural health monitoring of civil infrastructure using optical fiber sensing technology: A comprehensive review. Sci. World J. 2014;2014:652329. doi: 10.1155/2014/652329. - DOI - PMC - PubMed
    1. Bremer K., Wollweber M., Weigand F., Rahlves M., Kuhne M., Helbig R., Roth B. Fibre Optic Sensors for the Structural Health Monitoring of Building Structures. Proced. Technol. 2016;26:524–529. doi: 10.1016/j.protcy.2016.08.065. - DOI
    1. Weisbrich M., Holschemacher K., Bier T. Comparison of different fiber coatings for distributed strain measurement in cementitious matrices. J. Sens. Sens. Syst. 2020;9:189–197. doi: 10.5194/jsss-9-189-2020. - DOI

LinkOut - more resources