
Early Insights from Statistical and Mathematical Modeling of Key Epidemiologic Parameters of COVID-19

Matthew Biggerstaff et al. Emerg Infect Dis. 2020 Nov.

Abstract

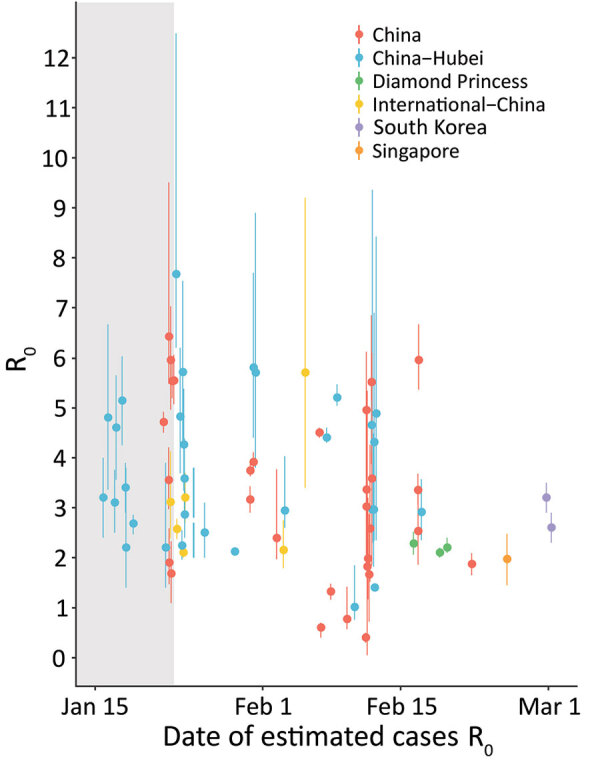
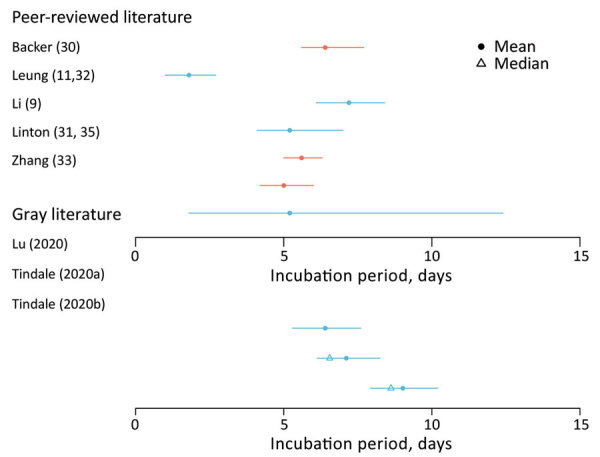
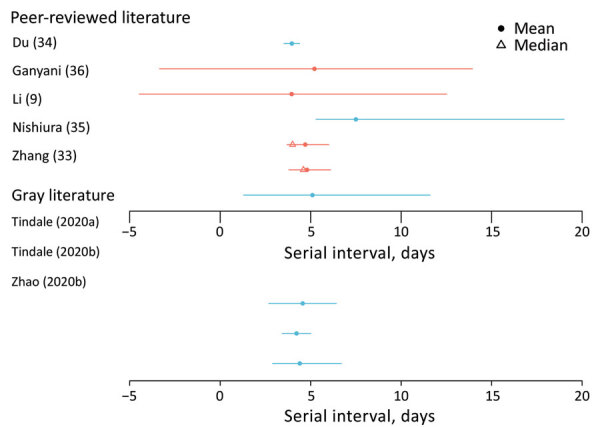
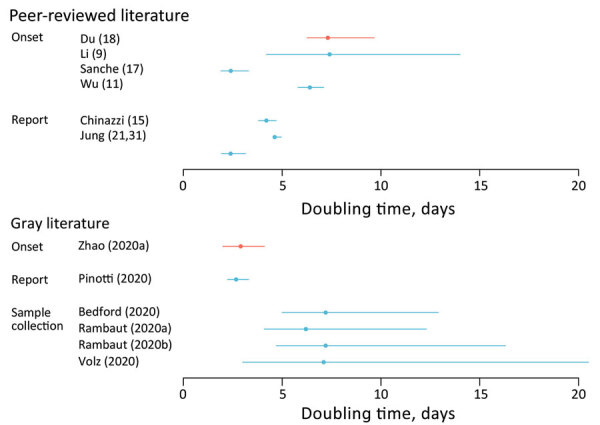
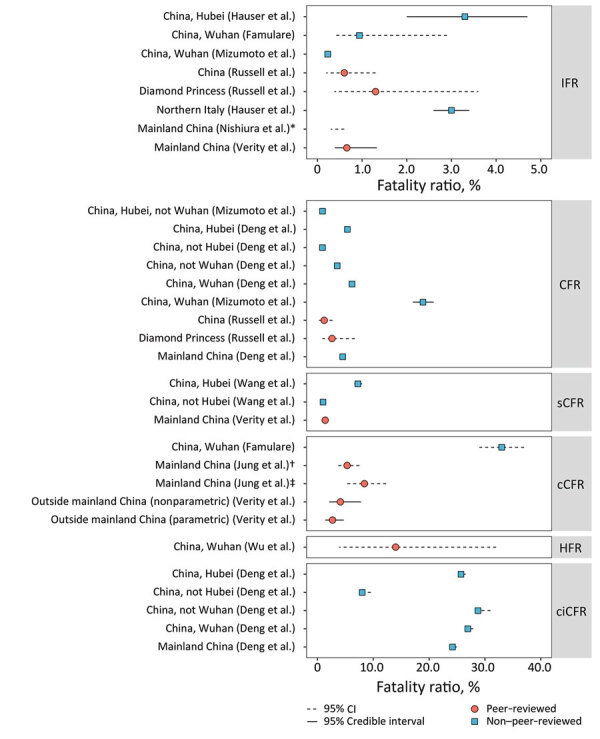
We report key epidemiologic parameter estimates for coronavirus disease identified in peer-reviewed publications, preprint articles, and online reports. Range estimates for incubation period were 1.8-6.9 days, serial interval 4.0-7.5 days, and doubling time 2.3-7.4 days. The effective reproductive number varied widely, with reductions attributable to interventions. Case burden and infection fatality ratios increased with patient age. Implementation of combined interventions could reduce cases and delay epidemic peak up to 1 month. These parameters for transmission, disease severity, and intervention effectiveness are critical for guiding policy decisions. Estimates will likely change as new information becomes available.

Keywords: 2019 novel coronavirus disease; COVID-19; SARS-CoV-2; World Health Organization; coronavirus; epidemiological parameters; mathematical modeling; severe acute respiratory syndrome coronavirus 2; viruses; zoonoses.


Figures

Figure 1
Figure 1
Basic reproduction number (R0) estimates for coronavirus disease by date of last reported cases analyzed and location. Points are mean or median estimates and error bars indicate 90% (12,13,15) or 95% bounds (i.e., confidence or credible intervals). International–China estimates are those using international cases or exported cases from China to infer R0 in China or Hubei Province. Estimates for China refer to R0 estimates at the national or province level, except for those exclusive estimating R0 for Hubei (China–Hubei). The gray shaded bar represents the time period before January 23, 2020, the date when broad restrictions were implemented in Hubei Province.
Figure 2
Figure 2
Estimated incubation period for coronavirus disease based on search in peer-reviewed and gray literature. Error bars indicate confidence (blue) or credible (red) intervals. Gray literature sources: Lu et al., unpub. data, https://www.medrxiv.org/content/10.1101/2020.02.19.20025031v1, Tindale et al., unpub. data, https://www.medrxiv.org/content/10.1101/2020.03.03.20029983v1 (also see Appendix Tables 2, 3).
Figure 3
Figure 3
Estimated serial interval for coronavirus disease based on search in peer-reviewed and gray literature. Error bars indicate confidence (blue) or credible (red) intervals. Gray literature sources: Tindale et al., unpub. data, https://www.medrxiv.org/content/10.1101/2020.03.03.20029983v1, Zhao et al., unpub. data, https://www.medrxiv.org/content/10.1101/2020.02.21.20026559v1 (also see Appendix Tables 2, 3).
Figure 4
Figure 4
Estimated doubling time for coronavirus disease based on search in peer-reviewed literature and gray literature. Error bars indicate confidence (blue) or credible (red) intervals. Gray literature sources: Onset: Zhao et al., unpub. data, https://www.medrxiv.org/content/10.1101/2020.02.06.20020941v1 ; report: Pinotti et al., unpub. data, https://www.medrxiv.org/content/10.1101/2020.02.24.20027326v1 ; sample collection: Bedford, unpub. data, http://virological.org/t/phylodynamic-estimation-of-incidence-and-prevalence-of-novel-coronavirus-ncov-infections-through-time/3 , Rambaut, unpub. data, http://virological.org/t/phylodynamic-analysis-176-genomes-6-mar-2020/356 , Rambaut, unpub. data, http://virological.org/t/phylodynamic-analysis-176-genomes-6-mar-2020/356 (same) , Volz et al., https://spiral.imperial.ac.uk/bitstream/10044/1/77169/11/2020-02-15-COVID19-Report-5.pdf (also see Appendix Tables 2, 3).
Figure 5
Figure 5
Summary of IFR and CFR estimates for coronavirus disease. Circles or squares indicate mean or median estimates and error bars indicate confidence (dotted line) or credible (full line) intervals. Red indicates peer-reviewed and blue non–peer-reviewed papers (for links to non–peer reviewed papers, see Appendix Table 5). *Range based on »10% ascertainment. †Epidemic growth alone. ‡Epidemic growth along with other parameters. CFR, case fatality ratio; cCFR, laboratory-confirmed CFR; ccCFR, critical care and severe CFR; sCFR, symptomatic CFR; HFR, hospitalization fatality ratio; IFR, infection fatality ratio.

References

    1. World Health Organization. Novel coronavirus (2019-nCoV) situation report 1. 2020. Jan [cited 2020 Mar 1]. https://www.who.int/docs/default-source/coronaviruse/situation-reports/2...
    1. World Health Organization. Coronavirus disease 2019 (COVID-19) situation report 47. 2020. Mar [cited 2020 Mar 1]. https://www.who.int/docs/default-source/coronaviruse/situation-reports/2...
    1. World Health Organization Health Emergencies Programme. Q&A on coronaviruses (COVID-19). 2020. [cited 2020 Feb 26]. https://www.who.int/news-room/q-a-detail/q-a-coronaviruses
    1. Wu JT, Cowling BJ. The use of mathematical models to inform influenza pandemic preparedness and response. Exp Biol Med (Maywood). 2011;236:955–61. 10.1258/ebm.2010.010271 - DOI - PMC - PubMed
    1. Garske T, Cori A, Ariyarajah A, Blake IM, Dorigatti I, Eckmanns T, et al. Heterogeneities in the case fatality ratio in the West African Ebola outbreak 2013–2016. Philos Trans R Soc Lond B Biol Sci. 2017;372:20160308. - PMC - PubMed

Publication types

LinkOut - more resources