Multi-parameter Sub-Hertz Analysis of Viscoelasticity With a Quality Metric for Differentiation of Breast Masses
- PMID: 32917470
- PMCID: PMC7606763
- DOI: 10.1016/j.ultrasmedbio.2020.08.004
Multi-parameter Sub-Hertz Analysis of Viscoelasticity With a Quality Metric for Differentiation of Breast Masses
Abstract
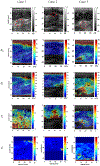
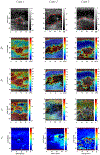
We applied sub-Hertz analysis of viscoelasticity (SAVE) to differentiate breast masses in pre-biopsy patients. Tissue response during external ramp-and-hold stress was ultrasonically detected. Displacements were used to acquire tissue viscoelastic parameters. The fast instantaneous response and slow creep-like deformations were modeled as the response of a linear standard solid from which viscoelastic parameters were estimated. These parameters were used in a multi-variable classification framework to differentiate malignant from benign masses identified by pathology. When employing all viscoelasticity parameters, SAVE resulted in 71.43% accuracy in differentiating lesions. When combined with ultrasound features and lesion size, accuracy was 82.24%. Adding a quality metric based on uniaxial motion increased the accuracy to 81.25%. When all three were combined with SAVE, accuracy was 91.3%. These results confirm the utility of SAVE as a robust ultrasound-based diagnostic tool for non-invasive differentiation of breast masses when used as stand-alone biomarkers or in conjunction with ultrasonic features.
Keywords: Breast lesion; Creep; Retardation time; Ultrasound; Viscoelasticity.
Copyright © 2020 The Authors. Published by Elsevier Inc. All rights reserved.
Conflict of interest statement
Conflict of interest disclosure The authors of this manuscript declare no relationships with any companies, whose products or services may be related to the subject matter of the article and the authors affirm that they do not have any potential financial interest related to the technology referenced in this paper.
Figures


Similar articles
-
Automated In Vivo Sub-Hertz Analysis of Viscoelasticity (SAVE) for Evaluation of Breast Lesions.IEEE Trans Biomed Eng. 2018 Oct;65(10):2237-2247. doi: 10.1109/TBME.2017.2787679. Epub 2017 Dec 27. IEEE Trans Biomed Eng. 2018. PMID: 29989938 Free PMC article.
-
Viscoelastic parameters as discriminators of breast masses: Initial human study results.PLoS One. 2018 Oct 12;13(10):e0205717. doi: 10.1371/journal.pone.0205717. eCollection 2018. PLoS One. 2018. PMID: 30312358 Free PMC article.
-
Diagnostic performance of quantitative shear wave elastography in the evaluation of solid breast masses: determination of the most discriminatory parameter.AJR Am J Roentgenol. 2014 Sep;203(3):W328-36. doi: 10.2214/AJR.13.11693. AJR Am J Roentgenol. 2014. PMID: 25148191
-
A review of breast ultrasound.J Mammary Gland Biol Neoplasia. 2006 Apr;11(2):113-23. doi: 10.1007/s10911-006-9018-0. J Mammary Gland Biol Neoplasia. 2006. PMID: 17082996 Review.
-
Viscoelastic imaging of breast tumor microenvironment with ultrasound.J Mammary Gland Biol Neoplasia. 2004 Oct;9(4):393-404. doi: 10.1007/s10911-004-1409-5. J Mammary Gland Biol Neoplasia. 2004. PMID: 15838608 Free PMC article. Review.
Cited by
-
Viscoelastic biomarker for differentiation of benign and malignant breast lesion in ultra- low frequency range.Sci Rep. 2019 Apr 5;9(1):5737. doi: 10.1038/s41598-019-41885-9. Sci Rep. 2019. PMID: 30952880 Free PMC article.
-
A Force-Matched Approach to Large-Strain Nonlinearity in Elasticity Imaging for Breast Lesion Characterization.IEEE Trans Biomed Eng. 2024 Jan;71(1):367-374. doi: 10.1109/TBME.2023.3305986. Epub 2023 Dec 22. IEEE Trans Biomed Eng. 2024. PMID: 37590110 Free PMC article.
-
Segmental and transmural motion of the rat myocardium estimated using quantitative ultrasound with new strategies for infarct detection.Front Bioeng Biotechnol. 2023 Sep 7;11:1236108. doi: 10.3389/fbioe.2023.1236108. eCollection 2023. Front Bioeng Biotechnol. 2023. PMID: 37744251 Free PMC article.
References
-
- Balleyguier C, Lakhdar AB, Dunant A, Mathieu MC, Delaloge S, Sinkus R. Value of whole breast magnetic resonance elastography added to MRI for lesion characterization. NMR in Biomedicine 2018; 31:e3795. - PubMed
-
- Barr RG, Destounis S, Lackey LB, Svensson WE, Balleyguier C, Smith C. Evaluation of breast lesions using sonographic elasticity imaging: a multicenter trial. Journal of Ultrasound in Medicine 2012; 31:281–87. - PubMed
-
- Barr RG, Zhang Z. Shear-Wave Elastography of the Breast: Value of a Quality Measure and Comparison with Strain Elastography. Radiology 2014; 275:45–53. - PubMed
Publication types
MeSH terms
Grants and funding
LinkOut - more resources
Full Text Sources
Medical

