. 2020 Sep 2;6(36):eaba1693.
doi: 10.1126/sciadv.aba1693. Print 2020 Sep.

DSCAM regulates delamination of neurons in the developing midbrain

Affiliations

DSCAM regulates delamination of neurons in the developing midbrain

Nariko Arimura et al. Sci Adv. .

Abstract

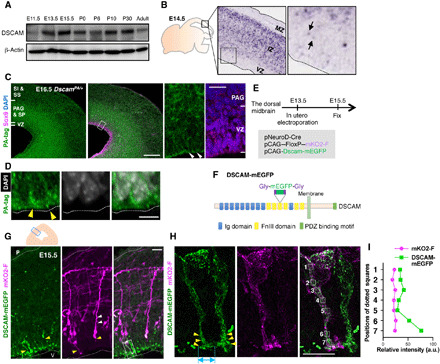
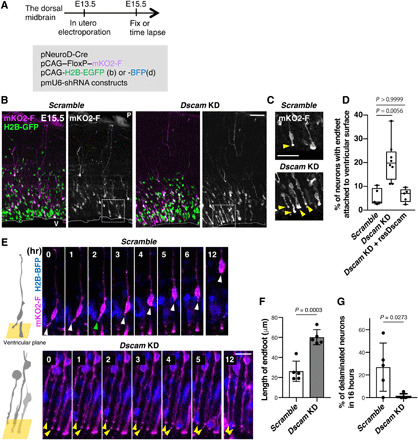
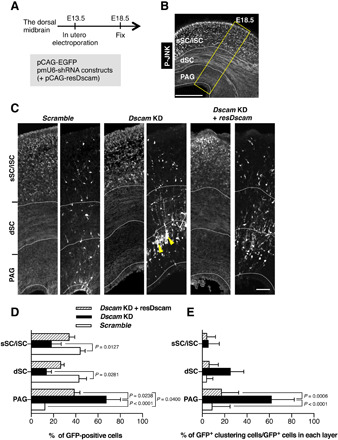
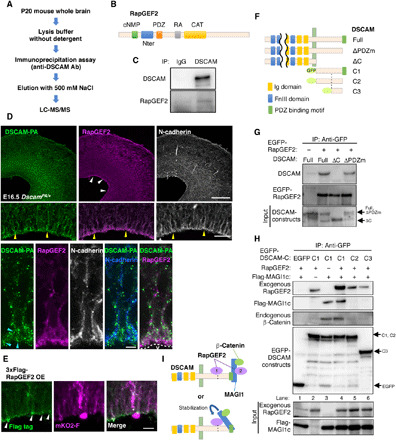
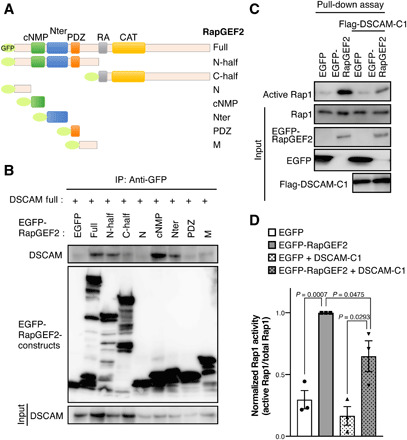
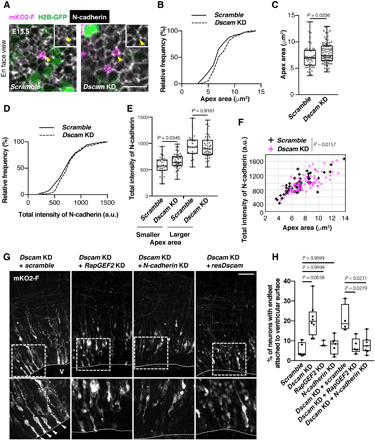
For normal neurogenesis and circuit formation, delamination of differentiating neurons from the proliferative zone must be precisely controlled; however, the regulatory mechanisms underlying cell attachment are poorly understood. Here, we show that Down syndrome cell adhesion molecule (DSCAM) controls neuronal delamination by local suppression of the RapGEF2-Rap1-N-cadherin cascade at the apical endfeet in the dorsal midbrain. Dscam transcripts were expressed in differentiating neurons, and DSCAM protein accumulated at the distal part of the apical endfeet. Cre-loxP-based neuronal labeling revealed that Dscam knockdown impaired endfeet detachment from ventricles. DSCAM associated with RapGEF2 to inactivate Rap1, whose activity is required for membrane localization of N-cadherin. Correspondingly, Dscam knockdown increased N-cadherin localization and ventricular attachment area at the endfeet. Furthermore, excessive endfeet attachment by Dscam knockdown was restored by co-knockdown of RapGEF2 or N-cadherin Our findings shed light on the molecular mechanism that regulates a critical step in early neuronal development.


Figures

Fig. 1
Fig. 1. Expression and localization of DSCAM in the dorsal midbrain during early neurogenesis.
(A) Temporal expression profiles of DSCAM protein in the midbrain from E11.5 to adult stage (P90). (B) In situ hybridization analysis of a mouse embryo (GenePaint.org). Black arrows indicate weak signals in the VZ. (C) Immunohistochemical analyses using anti-PA tag and Sox9 antibodies. Scale bar, 200 μm. Areas surrounded by white dotted lines are shown at higher magnification on the right. White arrowheads indicate accumulation of DSCAM-PA signals. Scale bar, 20 μm. (D) DSCAM-PA accumulated at the apical ventricular surface (yellow arrowheads) just beneath DAPI-positive nuclei. Scale bar, 5 μm. (E) Experimental design. (F) Diagram of the DSCAM-mEGFP protein domain structure. (G) DSCAM-mEGFP and mKO2-F expression in the dorsal midbrain. Upper schematic depicts coronal section of dorsal midbrain. Small blue box indicates area showing fluorescence image. White and yellow arrowheads indicate basal and apical processes, respectively. Higher magnification in (H) represents area surrounded by dotted box in (G). P, pia; V, ventricle. Scale bar, 20 μm. (H) Enlarged image of mKO2-F–positive neurons abutting apical endfeet into the ventricular surface. Yellow arrowheads indicate the accumulation of DSCAM-mEGFP. Light blue double-headed arrow indicates size of widely spread palm-like structures at the endfeet tip. Numbered areas in the merged image correspond to the fluorescence intensity measurement position in (I). Scale bar, 10 μm. (I) Relative intensity of mKO2-F and DSCAM-mEGFP. a.u., arbitrary units.
Fig. 2
Fig. 2. Dscam KD prevents delamination of newborn neurons.
(A to F) Embryonic dorsal midbrains were electroporated in utero at E13.5 with Cre-loxP–based neuron labeling. pCAG-H2B-EGFP (B) or BFP (D) plasmid was introduced to monitor nuclear position. At E15.5, midbrain coronal slices were analyzed. (A) Experimental design. (B) E15.5 dorsal midbrain coronal sections expressing mKO2-F and H2B-EGFP in electroporated cells with control (scramble) or Dscam KD. Higher magnification in (C) represents areas surrounded by dotted boxes. P, pia; V, ventricle. Scale bar, 50 μm. (C) Excessive abnormal apical processes (yellow arrowheads) observed in Dscam KD condition. Scale bar, 20 μm. (D) Percentage of neurons (mKO2-F–positive cells) with endfeet attached to the ventricular surface. Box plots show median (horizontal line), quartiles (box), and range (whiskers) from five to eight brains; Kruskal-Wallis test with Dunn’s multiple comparisons test. (E) Endfeet live imaging in slice culture. Left-side cartoons represent the angle of the ventricular surface in each movie. Each frame comprises z-stacked images. Control mKO2-F–positive neurons had apical endfeet (white arrowhead) first, which were then retracted (green arrowhead). In Dscam KD neurons, most mKO2-F–positive neurons bore long endfeet (yellow arrowheads). The ventricle is toward the bottom. Scale bar, 30 μm. (F) Length of mKO2-F–positive endfeet (Scramble, n = 5; Dscam-KD, n = 5). (G) Ratio of mKO2-F–positive delaminating neurons in 16 hours (Scramble, n = 5; Dscam KD, n = 5). Data are presented as the mean ± SEM; unpaired two-tailed t test.
Fig. 3
Fig. 3. Dscam KD prevents neuronal migration and isolated behavior.
(A to E) Dorsal midbrains were electroporated in utero at E13.5 with plasmids encoding pCAG-EGFP and indicated shRNA constructs and pCAG vector encoding shRNA-resistant expression construct (resDscam). At E18.5, midbrain coronal slices were analyzed. (A) Experimental design for in utero electroporation and analyses. (B) Schematic of coronal section of the dorsal midbrain at E18.5. Slices were stained with anti–phospho-JNK (P-JNK) antibody, a marker that demarcates the sSC/iSC, dSC, and PAG layers in the dorsal midbrain. Yellow box indicates the area shown in (C). Scale bar, 300 μm. (C) E18.5 dorsal midbrain coronal sections expressing EGFP in the electroporated cells with shRNA vectors and pCAG vector coding resDscam. Yellow arrowheads indicate impaired neuronal migration and abnormal cell clustering. Scale bar, 50 μm. (D) Distribution of EGFP-positive cells in three layers demarcated by anti–phospho-JNK antibody (Scramble, n = 4; Dscam KD, n = 4; Dscam KD and resDscam, n = 4). (E) Ratios of abnormal cell cluster formation in each layer (Scramble, n = 4; Dscam KD, n = 4; Dscam KD and resDscam, n = 4). Data are presented as the mean ± SEM; two-way analysis of variance (ANOVA) and Tukey’s multiple comparison test.
Fig. 4
Fig. 4. DSCAM associates with RapGEF2 and MAGI1c/β-catenin.
(A) Procedure for searching for DSCAM-binding molecules. (B) Diagram of the RapGEF2 protein domain structure. (C) Coimmunoprecipitation and Western blot assays using E15.5 brain and indicated antibodies. (D) Immunohistochemistry of RapGEF2 and N-cadherin in E16.5 DscamPA/+ midbrains. (Top) RapGEF2 localization was prominent at the ventricular surface (white arrowheads). Scale bar, 200 μm. (Middle) Higher-magnification image of the area enclosed by a dotted rectangle in the top-right panel. Yellow arrowheads indicate radially fibrous signals. V, ventricle. Scale bar, 10 μm. (Bottom) High-resolution images of thin sections. Light blue arrowheads indicate DSCAM accumulation. (E) Specific accumulation of 3xFlag-RapGEF2 was observed at the most distal part of the endfeet (white arrowheads) at E18.5. The outline of this experiment is described in Fig. 3A. Scale bar, 20 μm. (F) Diagram of the domain structure of DSCAM deletion constructs. (G) Coimmunoprecipitation assay revealed the association of EGFP-RapGEF2 with DSCAM cytoplasmic domain. The input (bottom column, 5%) and immunoprecipitants (upper two columns) were analyzed by Western blotting using anti-DSCAM and anti-GFP antibodies. (H) Coimmunoprecipitation assay revealed association of DSCAM with RapGEF2/MAGI1/β-catenin ternary complex. Experimental conditions were the same as in (G). The input (bottom two columns) and immunoprecipitants (upper four columns) were analyzed by Western blotting with anti-RapGEF2, anti-Flag, anti–β-catenin, and anti-GFP antibodies. The experiment was repeated at least three times. (I) Model of the complex formation of DSCAM, RapGEF2, MAGI1, and β-catenin.
Fig. 5
Fig. 5. DSCAM associates with RapGEF2 and prevents Rap1 activation.
(A) Diagram of the domain structure of RapGEF2 deletion constructs. (B) Coimmunoprecipitation assay revealed that DSCAM associates with the RapGEF2 cNMP and Nter domains. Lysates of COS-7 cells expressing RapGEF2 constructs described in (A) and DSCAM were incubated with an anti-GFP antibody. The input (bottom column, 5%) and immunoprecipitants (upper two columns) were analyzed by Western blotting using anti-DSCAM and anti-GFP antibodies. The experiment was repeated at least three times. (C) Pull-down assay to evaluate active Rap1 using COS-7 cells expressing control EGFP or EGFP-RapGEF2 with or without Flag-Dscam cytoplasmic region (Flag-DSCAM-C1; described in Fig. 4F). The input (bottom four columns, 5%) and immunoprecipitants (upper column) were analyzed by Western blotting using anti-Rap1, anti-GFP, and anti-Flag antibodies. (D) Quantification of fold change of active Rap1 levels. Normalized active Rap1 activity was calculated by active Rap1/total Rap1. Data are presented as the mean ± SEM from three independent experiments; unpaired two-tailed t test.
Fig. 6
Fig. 6. DSCAM regulates neuronal delamination via RapGEF2 and N-cadherin down-regulation.
(A) En face view of E15.5 dorsal midbrain that was electroporated in utero at E13.5. The outline of this experiment is described in Fig. 2A. Yellow arrowheads indicate collected apex areas. Scale bar, 10 μm. (B) Cumulative distribution and (C) quantification of the size of the endfeet apex area. (B and C) Scramble, n = 50 cells from three animals; Dscam KD, n = 88 cells from three animals. Box plots show median (horizontal line), quartiles (box), and range (whiskers); Mann-Whitney test. (D) Cumulative distribution of normalized fluorescence intensity of N-cadherin in apex of endfeet. This was calculated by the ratio of the average pixel intensity within the apical circumference of one transfected cell versus the mean of average pixel intensity of four to seven of its close nontransfected neighbors. (E) Quantification of normalized fluorescence intensity of N-cadherin level ratio. A smaller population was defined as the size of the apex area of endfeet being smaller than the median size, and the other half was defined as larger [smaller, n = 25 cells; Dscam KD, n = 44 cells, box plots show median (horizontal line), quartiles (box), and range (whiskers), Mann-Whitney test]. (F) Scatter plot of N-cadherin intensity and apex area for control and Dscam KD brains. ANCOVA test. (G) Coronal sections of E15.5 dorsal midbrain expressing mKO2-F that were coelectroporated with indicated vectors. White arrowheads indicate excess endfeet formation. Higher magnification in bottom panels represents areas surrounded by the dotted box. V, ventricle. Scale bar, 50 μm. (H) Analysis of the number of mKO2-F–positive neurons bearing endfeet. Box plots show median (horizontal line), quartiles (box), and range (whiskers) from five to eight brains; Kruskal-Wallis test with Dunn’s multiple comparisons test.

References

    1. Hatta K., Takeichi M., Expression of N-cadherin adhesion molecules associated with early morphogenetic events in chick development. Nature 320, 447–449 (1986). - PubMed
    1. D’Gama A. M., Walsh C. A., Somatic mosaicism and neurodevelopmental disease. Nat. Neurosci. 21, 1504–1514 (2018). - PubMed
    1. Arimura N., Dewa K.-I., Okada M., Yanagawa Y., Taya S.-I., Hoshino M., Comprehensive and cell-type-based characterization of the dorsal midbrain during development. Genes Cells 24, 41–59 (2019). - PubMed
    1. Edwards M. A., Caviness V. S. Jr., Schneider G. E., Development of cell and fiber lamination in the mouse superior colliculus. J. Comp. Neurol. 248, 395–409 (1986). - PubMed
    1. Das R. M., Storey K. G., Apical abscission alters cell polarity and dismantles the primary cilium during neurogenesis. Science 343, 200–204 (2014). - PMC - PubMed

Publication types