. 2020 Sep 2;6(36):eabb9011.
doi: 10.1126/sciadv.abb9011. Print 2020 Sep.

Globally deimmunized lysostaphin evades human immune surveillance and enables highly efficacious repeat dosing

Affiliations

Globally deimmunized lysostaphin evades human immune surveillance and enables highly efficacious repeat dosing

Hongliang Zhao et al. Sci Adv. .

Abstract

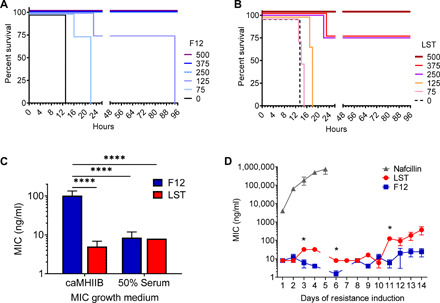
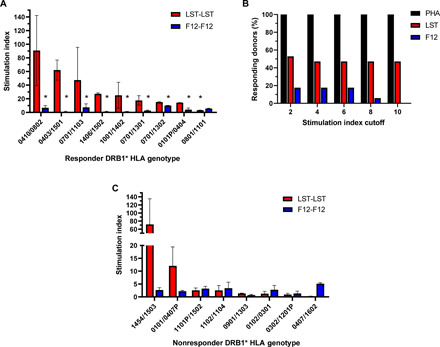
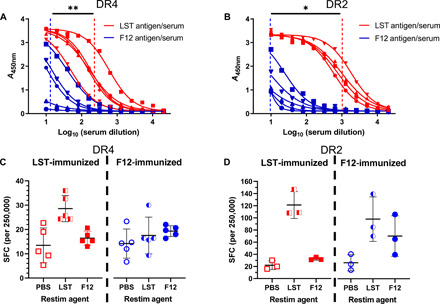
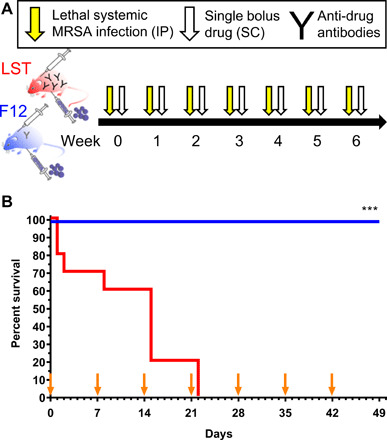
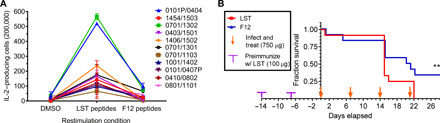
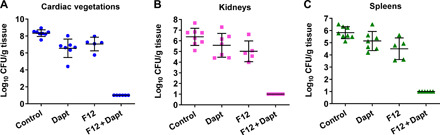
There is a critical need for novel therapies to treat methicillin-resistant Staphylococcus aureus (MRSA) and other drug-resistant pathogens, and lysins are among the vanguard of innovative antibiotics under development. Unfortunately, lysins' own microbial origins can elicit detrimental antidrug antibodies (ADAs) that undermine efficacy and threaten patient safety. To create an enhanced anti-MRSA lysin, a novel variant of lysostaphin was engineered by T cell epitope deletion. This "deimmunized" lysostaphin dampened human T cell activation, mitigated ADA responses in human HLA transgenic mice, and enabled safe and efficacious repeated dosing during a 6-week longitudinal infection study. Furthermore, the deimmunized lysostaphin evaded established anti-wild-type immunity, thereby providing significant anti-MRSA protection for animals that were immune experienced to the wild-type enzyme. Last, the enzyme synergized with daptomycin to clear a stringent model of MRSA endocarditis. By mitigating T cell-driven antidrug immunity, deimmunized lysostaphin may enable safe, repeated dosing to treat refractory MRSA infections.


Figures

Fig. 1
Fig. 1. F12 versus LST efficacy and activity in biological matrices against MRSA MW2.
(A) F12 dose-response survival curves in murine bacteremia model (dose provided in micrograms per mouse). (B) LST dose-response survival curves in murine bacteremia model (dose provided in micrograms per mouse). For matched doses in (A) and (B), F12 was significantly more efficacious at 75 μg, P = 0.009; 125 μg, P = 0.003; 250 μg, P = 0.01; and 375 μg, P = 0.01 (Mantel-Cox log-rank test). (C) F12 (blue) and LST (red) MIC values in standard caMHIIB medium and in 50% human serum. Mean and SD from three independent experiments, each with two to three technical replicates. For (C), both the enzyme and assay medium resulted in significant differences [two-way analysis of variance (ANOVA)]. F12 in caMHIIB was significantly less potent than all other treatments [P < 0.0001, two-stage linear step-up procedure of Benjamini, Krieger, and Yekutieli with false discovery rate (Q) = 5%]. (D) Serial induction of resistance in 50% serum. Growth wells from MIC assays were serially cultured to induce drug resistance upon repeated and escalating drug exposure. Nafcillin resistance increased 190-fold over 5 days, LST resistance increased 50-fold over 14 days, and F12 resistance increased only 3-fold over 14 days. Missing data at days 5 (LST and F12) and 7 (F12) indicate inability to determine MIC values, as bacteria failed to yield visible outgrowth even in control wells lacking antibacterial agents. Mean and SD of duplicate assays are shown. F12 was significantly more potent than LST on days 3, 6, and 11 [multiple unpaired t tests with false discovery rate (Q) = 5%]. *P < 0.01; ****P < 0.0001.
Fig. 2
Fig. 2. F12 versus LST activation of human T cells in PBMC preparations.
PBMCs were expanded separately in the presence of LST (red) or F12 (blue), restimulated with synthetic peptides matched to the expansion protein, and T cell activation was quantified as SFCs by IL-2 ELISpot. (A) SIs for nine donors deemed responders to one or both proteins. Donor DRB1 MHC II genotype is indicated on the x axis. Values are average and SD for triplicate ELISpots. F12 is significantly less stimulatory for all responders except 0801/1101 [multiple unpaired t tests with false discovery rate (Q) = 5%]. (B) Responder frequencies as a function of SI cutoff value. Phytohemagglutinin is shown as a positive control (black). F12 had no responders at a cutoff of 10. See Materials and Methods for responder criteria. (C) SI for nonresponders. *q value < 0.05.
Fig. 3
Fig. 3. F12 versus LST immunogenicity in human HLA transgenic mice.
(A) ELISA of serum dilutions (x axis) to quantify ADA titers in DR4 mice following four immunizations with F12 (blue) or LST (red). Mean 50% response titer for each group is indicated with vertical hashed lines. Average titers are significantly different. P = 0.008, Mann-Whitney two-tailed test. (B) Analogous ADA titers in DR2 mice after two immunizations. Average titers are significantly different. P = 0.016, Mann-Whitney two-tailed test. (C) Activation of splenocytes harvested from DR4 mice following four immunizations with LST (left, red squares) or F12 (right, blue circles). Splenocytes restimulated ex vivo with buffer control (open symbols), LST (half-open symbols), or F12 (closed symbols). Y axis is activated cells based on the ELISpot analysis of 250,000 splenocytes. Mean and SD are indicated for each group. The LST immunized–LST restimulated group is significantly higher than all other groups. See table S4 for two-way ANOVA results. (D) Analogous activation of splenocytes harvested from DR2 mice. The LST immunized–LST restimulated group is significantly higher than all other groups except the F12 immunized–LST restimulated group. See table S5 for two-way ANOVA results. A450nm, absorbance at 450 nm. *P < 0.05; **P < 0.01.
Fig. 4
Fig. 4. Recurrent bacteremia model in DR4 human HLA transgenic mice.
(A) Schematic of recurrent infection model. Mice were given a lethal intraperitoneal (IP) challenge of MRSA clinical isolate USA400 and, 1 hour later, were treated with either 500 μg of LST (red) or F12 (blue) subcutaneously (SC) administered. Surviving mice underwent serial cycles of infection and treatment. (B) Kaplan-Meier survival curve for F12 versus LST treatments. Infection dates are indicated with orange arrows. F12 provides significantly better protection than LST. P = 0.0003, log-rank test. ***P < 0.001.
Fig. 5
Fig. 5. F12 evades established anti-LST immunity.
(A) Crossover PBMC assays. Human PBMCs were expanded in the presence of LST protein and, following expansion, were split and restimulated separately with peptide pools corresponding to either LST or F12. The number of SFCs by ELISpot is provided for each responding donor after DMSO control, LST, or F12 peptide restimulation. Donor DRB1 MHC II genotype is indicated in legend. F12 restimulation is significantly less activating than LST restimulation for all donors except DRB1*0801/1101 (two-way ANOVA). See table S6 for summary statistics. (B) F12 manifests improved efficacy in DR4 mice preimmunized with LST. DR4 mice were preimmunized twice with 100 μg of LST, split into two groups (N = 12 each), and tested in the MRSA recurrent bacteremia model treated with either 750 μg of LST (red) or F12 (blue). Preimmunization is indicated with purple “T,” and infections are indicated with orange arrows. F12 provides significantly better protection. P = 0.0034, log-rank test. **P < 0.01.
Fig. 6
Fig. 6. F12, daptomycin, and combination therapy in a rabbit model of left-sided infective endocarditis.
Daptomycin dosed at 4 mg/kg once daily × 4 days, F12 dosed at 40 mg/kg once daily × 1 day, or a combined treatment using the same dosing regimens. Viable bacterial counts recovered from (A) cardiac vegetations, (B) kidney, and (C) spleen at the study conclusion are shown. Lines and bars are mean and SD. The combination therapy eradicated bacteria in all target tissues such that the limit of detection was assigned as an upper bound. The combination therapy is significantly different from all other groups (two-way ANOVA). See table S7 for summary statistics. Mortality was 100% for control animals, 14% for daptomycin, 20% for F12, and 0% for the combination therapy.

Similar articles

Cited by

References

    1. Tong S. Y. C., Davis J. S., Eichenberger E., Holland T. L., Fowler V. G. Jr., Staphylococcus aureus infections: Epidemiology, pathophysiology, clinical manifestations, and management. Clin. Microbiol. Rev. 28, 603–661 (2015). - PMC - PubMed
    1. Antibiotic Resistance Threats in the United States, 2013 (2013); http://cdc.gov/drugresistance/threat-report-2013/.
    1. Chambers H. F., Deleo F. R., Waves of resistance: Staphylococcus aureus in the antibiotic era. Nat. Rev. Microbiol. 7, 629–641 (2009). - PMC - PubMed
    1. David M. Z., Daum R. S., Treatment of Staphylococcus aureus Infections. Curr. Top. Microbiol. Immunol. 409, 325–383 (2017). - PubMed
    1. Fischetti V. A., Development of phage lysins as novel therapeutics: A historical perspective. Viruses 10, 310 (2018). - PMC - PubMed

Publication types