. 2020 Sep 2;6(36):eaaz2747.
doi: 10.1126/sciadv.aaz2747. Print 2020 Sep.

Dose-dependent effects of transcranial alternating current stimulation on spike timing in awake nonhuman primates

Affiliations

Dose-dependent effects of transcranial alternating current stimulation on spike timing in awake nonhuman primates

Luke Johnson et al. Sci Adv. .

Abstract

Weak extracellular electric fields can influence spike timing in neural networks. Approaches to noninvasively impose these fields on the brain have high therapeutic potential in neurology and psychiatry. Transcranial alternating current stimulation (TACS) is hypothesized to affect spike timing and cause neural entrainment. However, the conditions under which these effects occur in vivo are unknown. Here, we recorded single-unit activity in the neocortex in awake nonhuman primates during TACS and found dose-dependent neural entrainment to the stimulation waveform. Cluster analysis of changes in interspike intervals identified two main types of neural responses to TACS-increased burstiness and phase entrainment. Our results uncover key mechanisms of TACS and show that the stimulation affects spike timing in the awake primate brain at intensities feasible in humans. Thus, novel TACS protocols tailored to ongoing brain activity may be a tool to normalize spike timing in maladaptive brain networks and neurological disease.


Figures

Fig. 1
Fig. 1. Experimental outline and data processing.
(A) A 96-channel microelectrode microdrive (maroon dots indicate different contacts at their original cortical location) was used to record from motor cortical regions (pre-motor and primary motor cortex). TACS was applied through two round stimulation electrodes (black) attached on the scalp over the left (L) and right (R) temples. Top to bottom is anterior to posterior direction. The brain orientation is identical for all panels. (B) Stimulation time course of different conditions. TACS was applied at 0.5, 1.0, or 1.5 mA for 2 min with resting periods before and after stimulation. (C) Recorded raw data of neural activity (orange) in the context of the TACS artifact and other noise sources (black). Signal filtering suppressed the TACS artifact, allowing spike extraction, sorting, and identification of time stamps for spike times with respect to the stimulation phase. (D) Overlaid spike waveforms before, during, and after TACS (from one exemplary neuron), demonstrating the consistency of spike waveforms in the presence of the stimulation artifacts.
Fig. 2
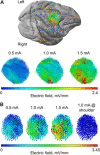
Fig. 2. Recorded electric field during TACS in the neocortex.
Electric field strength is color-coded, with red indicating maximum electric field strength. Right to left is anterior to posterior direction. The brain orientation is identical for all panels. (A) Electric field distributions in subject A on the brain surface for three different intensities (0.5, 1.0, and 1.5 mA). The distributions have the same orientation and relative spatial relationships and scale linearly with intensity. (B) Electric field distributions in subject B for three different intensities and for the shoulder control stimulation.
Fig. 3
Fig. 3. Dose dependency of single-unit entrainment.
(A) Time course of spikes (indicated as black dots for pre-/post-stimulation periods, and as orange dots during stimulation) over two stimulation cycles (x axis) over total recording time before, during, and after TACS (y axis). The data are shown for one exemplary neuron for three intensities (0.5, 1, and 1.5 mA). Pre-stimulation trials and post-stimulation trials (black) are arranged to a virtual stimulation signal with the same frequency (10 Hz) as during stimulation (orange). With stimulation onset, spike times cluster more toward the peak of the stimulation cycle (corresponding electric field shown in Fig. 2) compared to a more uniform distribution during rest. Below, peristimulus histograms (smoothed with a 10-ms Gaussian kernel) of spike times during stimulation (TACS waveform is shown with gray above the figure) indicate a nonuniform distribution of spike onsets. On the right side, polar plots of the phase during spike onset are shown. *P < 0.01, significant nonuniformity according to a Rayleigh test. (B) Same analysis as presented in (A) but for another exemplary neuron with higher spiking rate.
Fig. 4
Fig. 4. Phase-lag value and spike rate changes across all neurons.
(A) Phase-lag values across all recorded neurons (n = 34) are shown for all conditions (before, during, and after stimulation) for three studied intensities (0.5, 1.0, and 1.5 mA). Individual dots indicate values for each neuron, and solid bars show the group mean. (B) The increase in PLV during stimulation is driven by a subset of neurons responding to TACS with increased entrainment. PLV values during stimulation are enhanced during all intensities and increasingly so for higher intensities. Bright blue and red highlight the cases from Fig. 3. (C) Spiking rate during TACS and rest across all conditions are shown for all recorded neurons and (D) for only responsive neurons. No consistent effects on spiking rate were observed during TACS. See fig. S3 for the same data during shoulder stimulation (control condition).
Fig. 5
Fig. 5. Relationship between the electric field and PLV.
Linear relationship of the relative changes in PLVs, ΔPLV = (PLVstim − PLVpre)/PLVpre, to the local electric field strength (r.u., relative units). Each neuron (n = 34) is displayed during 0.5-, 1.0-, and 1.5-mA TACS. The responsive cases are highlighted in orange. Linear regression for the responsive cases: R2 = 0.39, F16 = 10.30, P = 0.005; for all cases: R2 = 0.01, F100 = 0.58, P = 0.45.
Fig. 6
Fig. 6. Individual phase histograms of neural spikes during TACS.
Polar phase plots of the timing of neural spikes in individual “responsive” neurons relative to the stimulation waveform (10 Hz) during TACS for intensities of 0.5 mA (A), 1.0 mA (B), and 1.5 mA (C). All plots show a significant deviation from the uniform distribution according to a Rayleigh test (P < 0.01). Phase values are given relative to a cosine, i.e., 0° is the peak and 180° is the trough of the stimulation waveform. The number in the lower right corner of each polar plot indicates the unique neuron.
Fig. 7
Fig. 7. Interspike intervals.
Two types of stimulation-induced ISI changes (TACS minus rest). Each subplot shows a mean ISI histogram of neurons that belong to a given class according to Newman’s modularity analysis. All mean histograms are statistically significant (cluster-based permutation test, P < 0.01). Differences in spike counts (n.u., normalized units) of ISI histograms across all neurons falling into the class are color-coded. (A) Class 1. An increase in burstiness (spikes following each at low interstimulus times) during TACS is observed. This effect increases for higher stimulation intensities. (B) Class 2. An increase in entrainment (enhanced ISIs at 100 ms, based on 10-Hz waveform) is visible during TACS. This is accompanied with a decrease in fast successive spikes. See figs. S5 and S6 for the ISI histograms of individual neurons during TACS and rest.

Comment in

References

    1. Buzsáki G., Anastassiou C. A., Koch C., The origin of extracellular fields and currents—EEG, ECoG, LFP and spikes. Nat. Rev. Neurosci. 13, 407–420 (2012). - PMC - PubMed
    1. Singer W., Neuronal oscillations: Unavoidable and useful? Eur. J. Neurosci. 48, 2389–2398 (2018). - PubMed
    1. Anastassiou C. A., Perin R., Markram H., Koch C., Ephaptic coupling of cortical neurons. Nat. Neurosci. 14, 217–223 (2011). - PubMed
    1. Anastassiou C. A., Koch C., Ephaptic coupling to endogenous electric field activity: Why bother? Curr. Opin. Neurobiol. 31, 95–103 (2015). - PubMed
    1. Borst A., Theunissen F. E., Information theory and neural coding. Nat. Neurosci. 2, 947–957 (1999). - PubMed

Publication types

LinkOut - more resources