. 2020 Sep 2;6(36):eaaz7364.
doi: 10.1126/sciadv.aaz7364. Print 2020 Sep.

Reprogramming competence of OCT factors is determined by transactivation domains

Affiliations

Reprogramming competence of OCT factors is determined by transactivation domains

Kee-Pyo Kim et al. Sci Adv. .

Abstract

OCT4 (also known as POU5F1) plays an essential role in reprogramming. It is the only member of the POU (Pit-Oct-Unc) family of transcription factors that can induce pluripotency despite sharing high structural similarities to all other members. Here, we discover that OCT6 (also known as POU3F1) can elicit reprogramming specifically in human cells. OCT6-based reprogramming does not alter the mesenchymal-epithelial transition but is attenuated through the delayed activation of the pluripotency network in comparison with OCT4-based reprogramming. Creating a series of reciprocal domain-swapped chimeras and mutants across all OCT factors, we clearly delineate essential elements of OCT4/OCT6-dependent reprogramming and, conversely, identify the features that prevent induction of pluripotency by other OCT factors. With this strategy, we further discover various chimeric proteins that are superior to OCT4 in reprogramming. Our findings clarify how reprogramming competences of OCT factors are conferred through their structural components.


Figures

Fig. 1
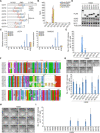
Fig. 1. Factor screening identifies OCT6 as a pluripotency inducer in humans.
(A) Schematic representation of the screening procedure. We transduced fibroblasts with each candidate virus along with SKM viruses. After two serial infections over the course of 3 days, the transduced cells were plated onto the plates precoated with feeder cells and cultured in hESC medium for 21 days. NaB (an HDAC inhibitor) was supplied to the medium for the first 10 days. The resulting cells were then stained with TRA-1-60 antibody. One hundred candidate genes (see table S1) were used as factor X. (B) Phase-contrast and fluorescence images of TRA-1-60+ colonies that had emerged from fibroblasts transduced with the indicated factors. Scale bar, 250 μm. (C) Western blot for GOI (OCT4, NR5A2, TET1, GATA3 and OCT6), SOX2, KLF4, MYC, and TUBULIN in fibroblasts that were transduced with the indicated factors. GOI, gene of interest. (D) Western blot for OCT6, OCT4, PAX6, DESMIN, and TUBULIN in the indicated samples. Fib, fibroblasts; NPC, neural precursor cells that were differentiated from HUES6; MEF, mouse embryonic fibroblasts; EpiSC, epiblast stem cells; NSC, neural stem cells. (E to G) Quantification of TRA-1-60+ colonies that had emerged from cells transduced with the indicated factors (n = 3). (H) Western blot for FLAG, OCT4, OCT6, SOX2, and TUBULIN in O4SKM- and O6SKM-transduced cells. FLAG tag was fused to N-TADs of OCT4 and OCT6. (I) Quantification of TRA-1-60+ colonies that had emerged from fibroblasts transduced with the indicated factors (n = 3). (J) Quantification of TRA-1-60+ colonies that had emerged from fibroblasts transduced with the indicated factors (n = 3). The transduced cells were cultured with dimethyl sulfoxide (DMSO) or the indicated chemicals. ***P < 0.001.
Fig. 2
Fig. 2. Characterization of OCT4- and OCT6-based reprogramming.
(A) Unsupervised hierarchical clustering analysis of the indicated samples. The list of samples we used for RNA-seq can be found in table S2. (B) Principal components analysis of the indicated samples. The solid and dashed red lines indicate O4SKM-reprogramming route (O4). The solid blue line indicates O6SKM-reprogramming route (O6). (C) Heatmap analysis of the indicated samples. (D) Transgene expression was monitored by NANOG and FLAG staining. FLAG tag was fused to N-TADs of OCT4 and OCT6. DAPI was used as a nuclear counterstain. Scale bars, 250 μm. (E) Bisulfite sequencing analysis of the 5′ LTR promoter of pMXs in the indicated samples. The percentages of methylation are given. (F) Western blot for DNMT1, DNMT3A, DNMT3B, and TUBULIN in the indicated samples. (G) Fluorescence images of iPSC colonies that were stained with FLAG, NANOG, and DNMT3B antibodies. DAPI was used as a nuclear counterstain. Scale bar, 250 μm. (H) Motif analysis of OCT4FLAG and OCT6FLAG binding sites. While OCT4FLAG predominantly bound to the SOX-OCT motif, OCT6FLAG bound to the MORE motif. (I) Genomic distribution patterns of OCT4FLAG and OCT6FLAG binding sites. (J) Quantification of common and unique binding sites of OCT6FLAG and OCT4FLAG. (K) GO terms of common and unique binding sites of OCT6FLAG and OCT4FLAG. (L) Genomic distribution patterns of common and unique binding sites of OCT6FLAG and OCT4FLAG. UTR, untranslated region. (M) Representative regions cobound by OCT4FLAG/OCT6FLAG and p300. (N) ChIP assay of pluripotency gene enhancers in the indicated samples (n = 3). The fold enrichment was calculated by the standard curve method and normalized to the value obtained at a negative control region. d or D, day. ***P < 0.001, **P < 0.01, and *P < 0.05.
Fig. 3
Fig. 3. Identification of transactivation domains negatively or positively influences the reprogramming process.
(A) Western blot for G4DBD and TUBULIN in HeLa cells transfected with the indicated luciferase constructs. G4DBD, DNA binding domain of the yeast transcription factor Gal4. (B) Relative luciferase activity of the indicated constructs (n = 3). The luciferase activity of the indicated constructs was normalized to that of G4DBD. (C) Schematic representation of OCT4-OCT6 chimeras. (D) Western blot for FLAG, SOX2, KLF4, MYC, and TUBULIN in fibroblasts that were transduced with the indicated factors. FLAG tag was fused to N-TADs of each factor. (E) Quantification of TRA-1-60+ colonies that had emerged from fibroblasts transduced with the indicated factors (n = 3). (F) ChiP assay of pluripotency gene enhancers in cells that were transduced with the indicated factors (n = 3). ChiP assay was carried out on day 2 of reprogramming. The fold enrichment was calculated by the standard curve method and normalized to the value obtained at a negative control region. (G) Expression of OCT4, NANOG, and TRA-1-60 in cells that were transduced with the indicated factors. The OCT4 antibody recognizes OCT4 N-TAD so that it can detect both endogenous OCT4 and exogenous O464 proteins in O464/SKM-transduced cells. DAPI was used as a nuclear counterstain. Scale bar, 100 μm. ***P < 0.001, **P < 0.01, *P < 0.05, and ns P > 0.05.
Fig. 4
Fig. 4. Intrinsic properties that are essential or detrimental to POU III factor–based reprogramming.
(A) Schematic representation of eight OCT proteins. The numbers indicate length of amino acids. N-TAD, N-terminal transactivation domain; DBD, DNA binding domain; C-TAD, C-terminal transactivation domain. The DBD has a bipartite structure with two subdomains, POU-specific domain (red) and POU-homeodomain (blue), which are connected by a linker (green). (B) Expression levels of all OCT factors in primed and naïve pluripotent stem cells (n = 2 to 3). The data were obtained from ArrayExpress (E-MTAB-2857, E-MTAB-2856, and E-MTAB-2856). fpkm, fragments per kilobase million. (C) Relative expression of OCT4 and NANOG in the indicated samples (n = 3). Expression values of these genes were normalized by expression value of RPL37A. (D) Western blot for FLAG, SOX2, KLF4, MYC, and TUBULIN in fibroblasts that were transduced with the indicated factors. FLAG tag was fused to N-TADs of all OCT factors. (E) Quantification of TRA-1-60+ colonies that had emerged from fibroblasts transduced with the indicated factors (n = 3). (F) Protein sequence alignment of OCT factor’s DBD. (G to I) Representative images and quantification of TRA-1-60+ colonies that had emerged from fibroblasts transduced with the indicated mutants and chimeras (n = 6). ***P < 0.001 and **P < 0.01.
Fig. 5
Fig. 5. Strong reprogramming competence of OCT4 arises from its C-TAD.
(A) Relative luciferase activity of the indicated constructs (n = 3). The luciferase activity of the indicated constructs was normalized to that of G4DBD. (B and C) Representative images and quantification of TRA-1-60+ colonies that had emerged from fibroblasts transduced with the indicated chimeras (n = 6). ***P < 0.001, **P < 0.01, *P < 0.05, and ns P > 0.05.
Fig. 6
Fig. 6. Characterization of chimeras that are superior to OCT4.
(A) Western blot for FLAG and TUBULIN in cells that were transduced with the indicated factors. FLAG tag was fused to N-TADs of each chimera. (B) Quantification of cells that had immunoreactivity to CD13 and TRA-1-60 by flow cytometry (see fig. S6A). (C) Relative expression of DPPA4, SALL4, DPPA2, and PRMD14 in the indicated samples (n = 3). Expression values of these genes were normalized by expression value of RPL37A. (D) ChIP assay of OCT4, NANOG, KLF5, and FGFR1 enhancers in cells that were transduced with the indicated factors (n = 3). ChiP assay was carried out on day 2 of reprograming. The fold enrichment was calculated by the standard curve method and normalized to the value obtained at a negative control region. (E) FACS plots for CD13 and TRA-1-60 in the indicated samples. O4SKM- and O774/SKM-transduced cells were cultured and stained with CD13 and TRA-1-60 antibodies at the indicated days. Their expression was analyzed by flow cytometry. (F) Relative expression of OCT4, SOX2, EOMES, ISL1, PAX6, and GATA3 in the indicated samples (n = 2 to 3). Expression values of these genes were normalized by expression value of RPL37A. (G) Fluorescence images NANOG+ and GATA6+ cells in O4SKM- and O774/SKM-transduced cells. The cells were stained on day 18 of reprogramming. DAPI was used as a nuclear counterstain. Scale bar, 500 μm. ***P < 0.001, **P < 0.01, *P < 0.05, and ns P > 0.05.

References

    1. Takahashi K., Tanabe K., Ohnuki M., Narita M., Ichisaka T., Tomoda K., Yamanaka S., Induction of pluripotent stem cells from adult human fibroblasts by defined factors. Cell 131, 861–872 (2007). - PubMed
    1. Nakagawa M., Koyanagi M., Tanabe K., Takahashi K., Ichisaka T., Aoi T., Okita K., Mochiduki Y., Takizawa N., Yamanaka S., Generation of induced pluripotent stem cells without Myc from mouse and human fibroblasts. Nat. Biotechnol. 26, 101–106 (2008). - PubMed
    1. Jerabek S., Ng C. K., Wu G., Arauzo-Bravo M. J., Kim K.-P., Esch D., Malik V., Chen Y., Velychko S., MacCarthy C. M., Yang X., Cojocaru V., Schöler H. R., Jauch R., Changing POU dimerization preferences converts Oct6 into a pluripotency inducer. EMBO Rep. 18, 319–333 (2016). - PMC - PubMed
    1. Maekawa M., Yamaguchi K., Nakamura T., Shibukawa R., Kodanaka I., Ichisaka T., Kawamura Y., Mochizuki H., Goshima N., Yamanaka S., Direct reprogramming of somatic cells is promoted by maternal transcription factor Glis1. Nature 474, 225–229 (2011). - PubMed
    1. Malik V., Glaser L. V., Zimmer D., Velychko S., Weng M., Holzner M., Arend M., Chen Y., Srivastava Y., Veerapandian V., Shah Z., Esteban M. A., Wang H., Chen J., Schöler H. R., Hutchins A. P., Meijsing S. H., Pott S., Jauch R., Pluripotency reprogramming by competent and incompetent POU factors uncovers temporal dependency for Oct4 and Sox2. Nat. Commun. 10, 3477 (2019). - PMC - PubMed

Publication types