Review
. 2020 Dec;29(12):2556-2567.
doi: 10.1158/1055-9965.EPI-20-0075. Epub 2020 Sep 11.

Radiomics Improves Cancer Screening and Early Detection

Affiliations
Review

Radiomics Improves Cancer Screening and Early Detection

Robert J Gillies et al. Cancer Epidemiol Biomarkers Prev. 2020 Dec.

Abstract

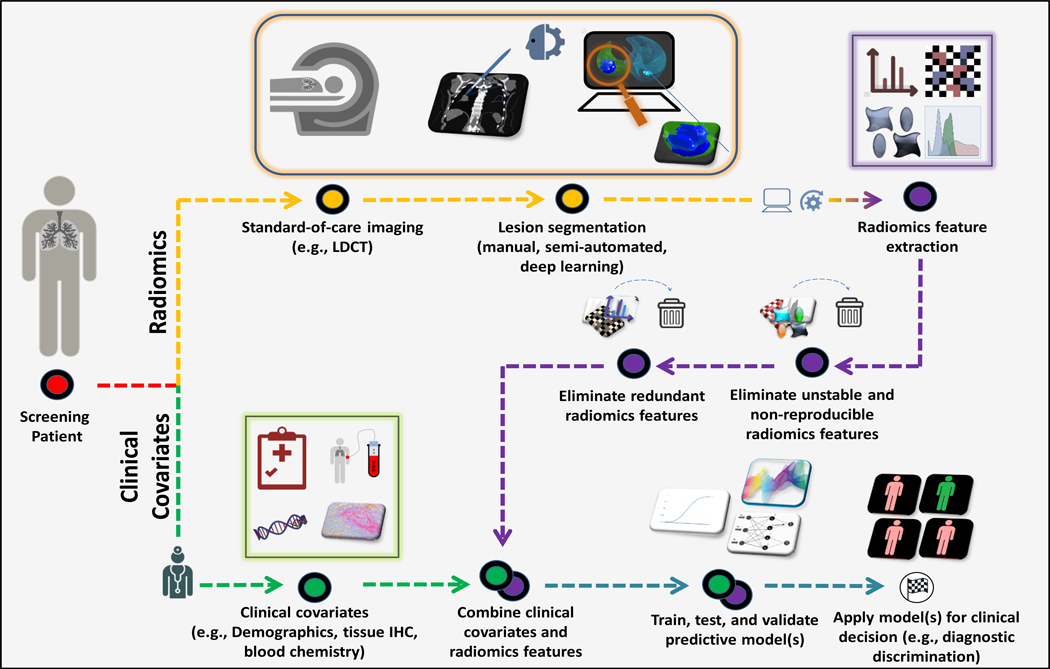
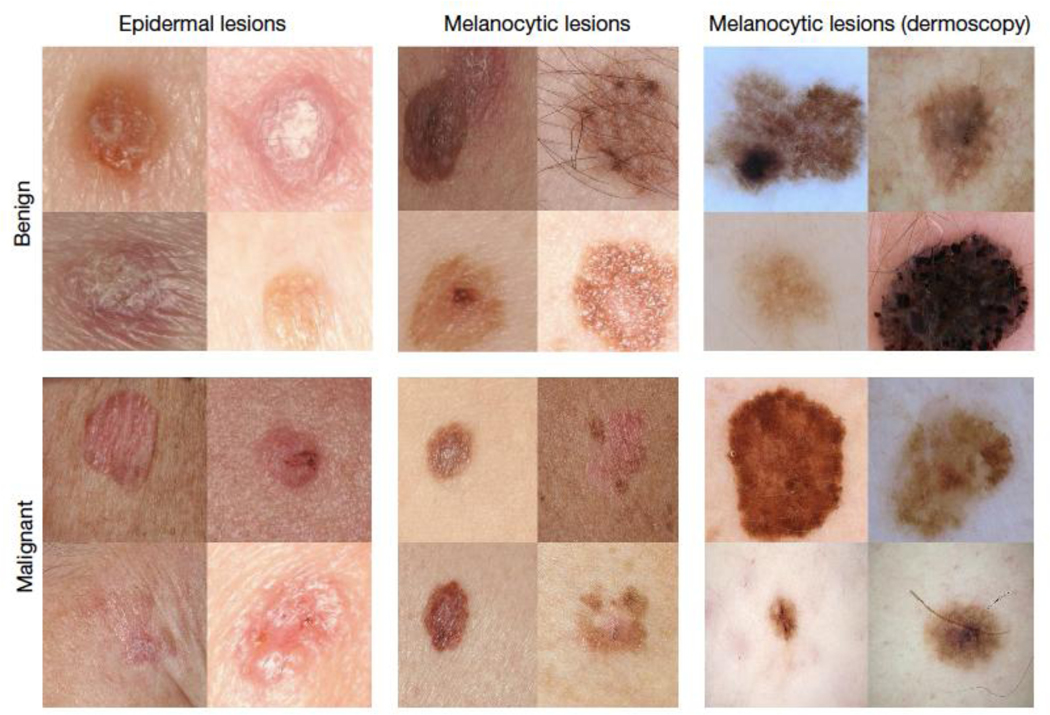
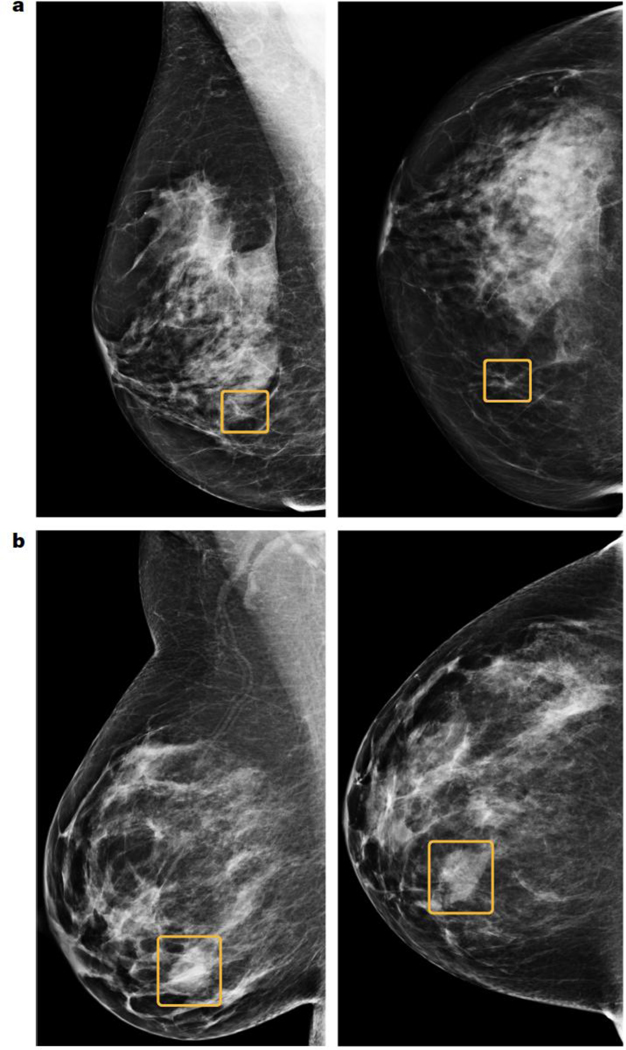
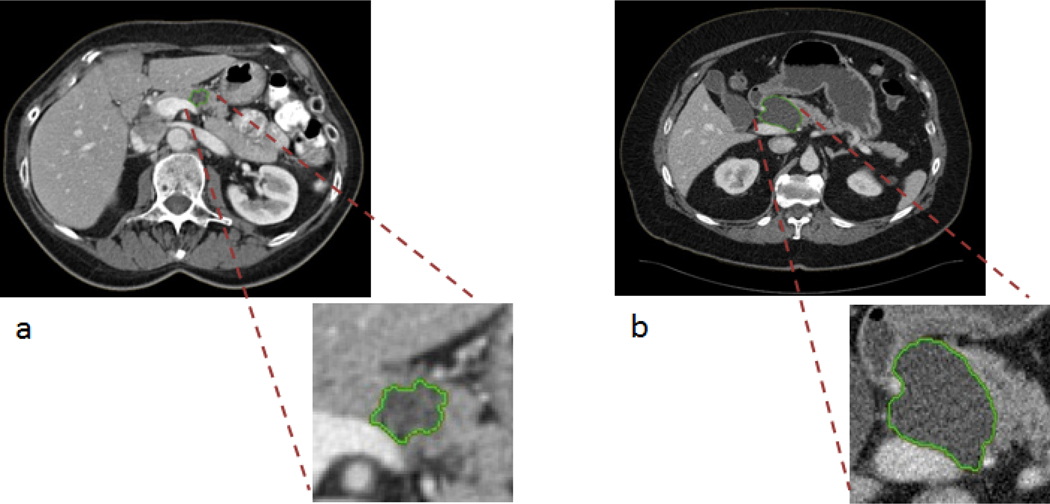
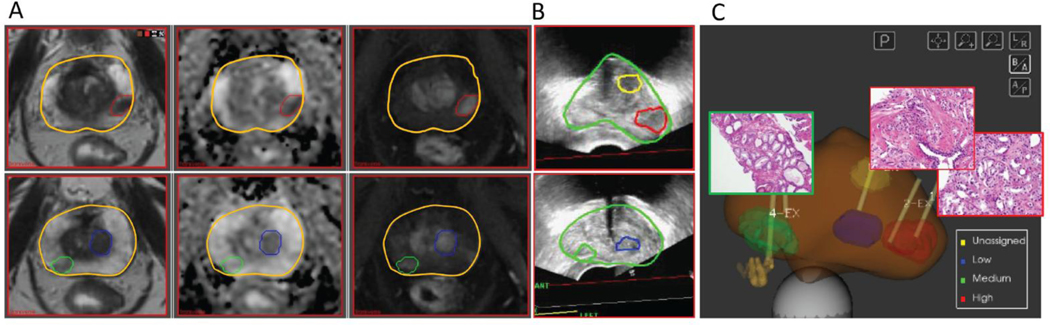
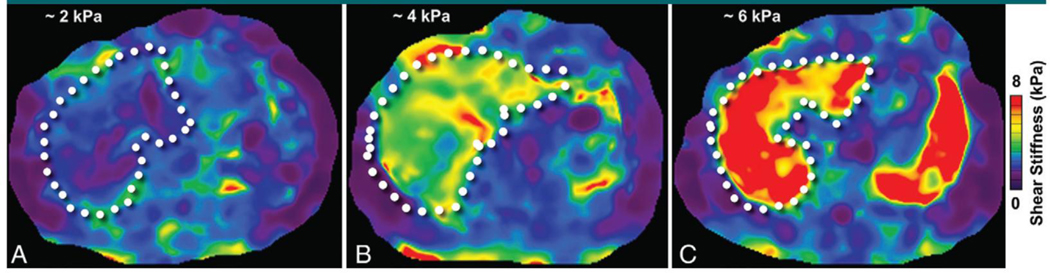
Imaging is a key technology in the early detection of cancers, including X-ray mammography, low-dose CT for lung cancer, or optical imaging for skin, esophageal, or colorectal cancers. Historically, imaging information in early detection schema was assessed qualitatively. However, the last decade has seen increased development of computerized tools that convert images into quantitative mineable data (radiomics), and their subsequent analyses with artificial intelligence (AI). These tools are improving diagnostic accuracy of early lesions to define risk and classify malignant/aggressive from benign/indolent disease. The first section of this review will briefly describe the various imaging modalities and their use as primary or secondary screens in an early detection pipeline. The second section will describe specific use cases to illustrate the breadth of imaging modalities as well as the benefits of quantitative image analytics. These will include optical (skin cancer), X-ray CT (pancreatic and lung cancer), X-ray mammography (breast cancer), multiparametric MRI (breast and prostate cancer), PET (pancreatic cancer), and ultrasound elastography (liver cancer). Finally, we will discuss the inexorable improvements in radiomics to build more robust classifier models and the significant limitations to this development, including access to well-annotated databases, and biological descriptors of the imaged feature data.See all articles in this CEBP Focus section, "NCI Early Detection Research Network: Making Cancer Detection Possible."


Conflict of interest statement

No potential conflicts of interest were disclosed by M.B.S.

Figures

Figure 1.
Figure 1.. The Radiomics Pipeline.
Patient standard-of-care imaging and data (as available) are obtained prospectively or retrospective. A radiologist or imaging scientist identified the regions(s)-of-interest (e.g., pulmonary nodule) which are then segmented manually or by using semi-automatically algorithms or through deep learning algorithms. After the ROI is segmented, radiomic features are extracted (purple). Unstable, non-reproducible, and correlated radiomic features are eliminated. The remaining radiomics features are combined with relevant clinical covariates (green) and predictive model building approaches are applied which can be applied for clinical decision. Figure 1 is modified from Tunali et al. (113)
Figure 2.
Figure 2.
A) A subset of the top of the tree-structured taxonomy of skin disease. The full taxonomy contains 2,032 diseases and is organized based on visual and clinical similarity of diseases. Red indicates malignant, green indicates benign, and orange indicates conditions that can be either. Black indicates melanoma. The first two levels of the taxonomy are used in validation. Testing is restricted to the tasks of b. B) Malignant and benign example images from two disease classes. These test images highlight the difficulty of malignant versus benign discernment for the three medically critical classification tasks we consider: epidermal lesions, melanocytic lesions and melanocytic lesions visualized with a dermoscope. Example images for Figure 2 are reprinted with permission from the Edinburgh Dermofit Library (URL at: https://licensing.eri.ed.ac.uk/i/software/dermofit-image-library.html).
Figure 3.
Figure 3.. A schematic illustration of the taxonomy and example test set images.
A) A sample cancer case that was missed by all six readers in the US reader study, but correctly identified by the AI system. The malignancy, outlined in yellow, is a small, irregular mass with associated microcalcifications in the lower inner right breast. B) A sample cancer case that was caught by all six readers in the US reader study, but missed by the AI system. The malignancy is a dense mass in the lower inner right breast. Left, mediolateral oblique view; right, craniocaudal view. Figure 3 is with permission from McKinney et al (URL at: https://www.nature.com/articles/s41586-019-1799-6?proof=true)
Figure 4.
Figure 4.. Semi-automated segmentation of two IPMN patient CT scans at selected central slice.
A) Axial venous phase images through the abdomen demonstrate a cystic mass in the pancreatic head/neck measuring up to 3.5 cm. This lesion contains a non-enhancing soft tissue mural nodule (arrow). B) Axial venous phase images through the abdomen demonstrate an ovoid, homogeneous appearing cystic mass measuring up to 4.8 cm in greatest dimension. No internal enhancing soft tissue nodules were seen within the lesion. Images from Figure 4 are with permission from Permuth et al. (URL at: http://www.oncotarget.com/index.php?journal=oncotarget&page=article&op=view&path[]=11768&path[]=37276)
Figure 5.
Figure 5.. Delineation of biopsy targets on mpMRI and fusion of targets on 3D TRUS.
A. Screenshots from ProFuse software (Eigen, Grass Valley, CA) for fusion of mpMRI delineated prostate Regions of Interest (ROIs) for targeted biopsy. Two axial slices, going from base (top) to apex (bottom) are displayed. The prostate volume is outlined (yellow contour); (Left) T2-weighted MRI; (Center) Apparent Diffusion Coefficient (ADC) derived from Diffusion Weighted Imaging (DWI); and (Right) Early enhancing image from Dynamic Contrast Enhanced (DCE-)MRI. The volumes in red, green and blue are assigned high, medium and low probability for cancer; B. A screenshot from Artemis (Eigen, Grass Valley, CA), displaying the 3D TRUS views corresponding to the axial slices in (A) after non-rigid fusion of the prostate boundaries on MRI and ultrasound. The targets are transferred from mpMRI to real-time ultrasound biopsy system; C. Schematic representation of the prostate and target volumes. (Note that the display contains a ROI in yellow is with unassigned probability). Yellow lines indicate biopsy needle tracks (1 needle in green, 2 in red and 1 in blue); The corresponding N&E slides at 20 x magnification from green target (left; Gleason Score 6) and red targets (right, Gleason Score 7). Images for Figure are with permission from Stoyanova et al. (URL at: https://www.ncbi.nlm.nih.gov/pubmed/27438142)
Figure 6.
Figure 6.. MR elastograms in three patients.
A) MR elastogram in a 63-year-old woman with a history of autoimmune hepatitis shows that the liver (outlined) has no evidence of hepatic fibrosis, with a normal stiffness value of approximately 2 kPa. B) MR elastogram in a 52-year-old woman with chronic cholestatic hepatitis demonstrates increased hepatic stiffness with approximately twice the normal value at 4 kPa, indicating the presence of significant hepatic fibrosis. C) MR elastogram in a 46-year-old man with chronic hepatitis C infection demonstrates markedly increased hepatic stiffness, averaging over 6 kPa, as is consistent with the presence of advanced hepatic fibrosis (cirrhosis). Images from Figure 6 are with permission from Barr et al. (URL at: https://pubs.rsna.org/doi/full/10.1148/radiol.2015150619

Similar articles

Cited by

References

    1. Srivastava S, Koay EJ, Borowsky AD, De Marzo AM, Ghosh S, Wagner PD, et al. Cancer overdiagnosis: a biological challenge and clinical dilemma. Nat Rev Cancer 2019;19:349–58 - PMC - PubMed
    1. Grizzle WE, Srivastava S, Manne U. Translational pathology of neoplasia. Cancer biomarkers : section A of Disease markers 2010;9:7–20 - PMC - PubMed
    1. Gillies RJ, Kinahan PE, Hricak H. Radiomics: images are more than pictures, they are data. Radiology 2015;278:563–77 - PMC - PubMed
    1. Napel S, Mu W, Jardim-Perassi BV, Aerts H, Gillies RJ. Quantitative imaging of cancer in the postgenomic era: Radio(geno)mics, deep learning, and habitats. Cancer 2018;124:4633–49 - PMC - PubMed
    1. Bi WL, Hosny A, Schabath MB, Giger ML, Birkbak NJ, Mehrtash A, et al. Artificial intelligence in cancer imaging: Clinical challenges and applications. CA Cancer J Clin 2019;69:127–57 - PMC - PubMed

Publication types