. 2020 Jun 10;6(24):eaay8299.
doi: 10.1126/sciadv.aay8299. Print 2020 Jun.

Incomplete annotation has a disproportionate impact on our understanding of Mendelian and complex neurogenetic disorders

Affiliations

Incomplete annotation has a disproportionate impact on our understanding of Mendelian and complex neurogenetic disorders

David Zhang et al. Sci Adv. .

Abstract

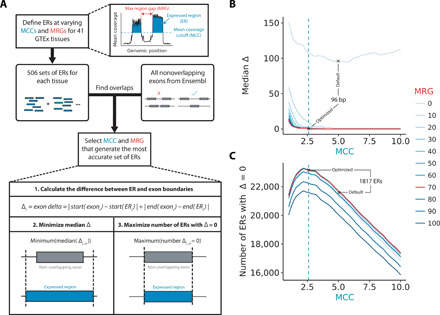
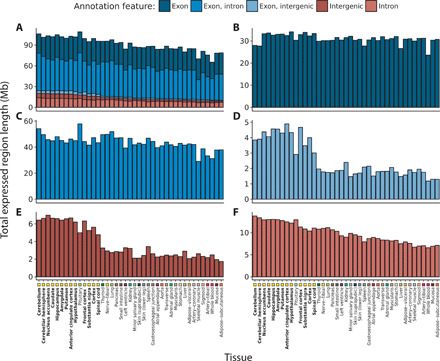
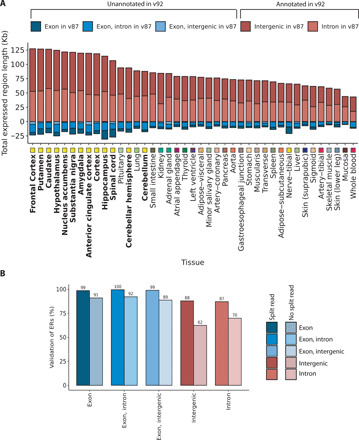
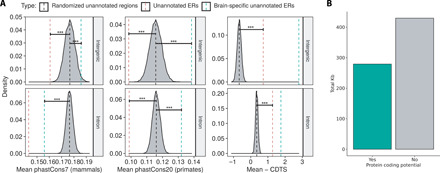
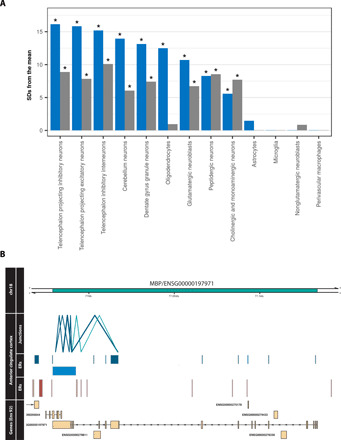
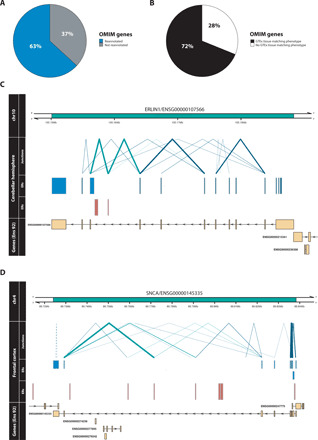
Growing evidence suggests that human gene annotation remains incomplete; however, it is unclear how this affects different tissues and our understanding of different disorders. Here, we detect previously unannotated transcription from Genotype-Tissue Expression RNA sequencing data across 41 human tissues. We connect this unannotated transcription to known genes, confirming that human gene annotation remains incomplete, even among well-studied genes including 63% of the Online Mendelian Inheritance in Man-morbid catalog and 317 neurodegeneration-associated genes. We find the greatest abundance of unannotated transcription in brain and genes highly expressed in brain are more likely to be reannotated. We explore examples of reannotated disease genes, such as SNCA, for which we experimentally validate a previously unidentified, brain-specific, potentially protein-coding exon. We release all tissue-specific transcriptomes through vizER: http://rytenlab.com/browser/app/vizER We anticipate that this resource will facilitate more accurate genetic analysis, with the greatest impact on our understanding of Mendelian and complex neurogenetic disorders.


Figures

Fig. 1
Fig. 1. Optimization of the detection of transcription.
(A) Transcription in the form ERs was detected in an annotation-agnostic manner across 41 human tissues. The MCC is the number of reads supporting each base above which that base would be considered transcribed, and the MRG is the maximum number of bases between ERs below which adjacent ERs would be merged. MCC and MRG parameters were optimized for each tissue using the nonoverlapping exons from Ensembl v92 reference annotation. (B) Line plot illustrating the selection of the MCC and MRG that minimized the difference between ER and exon definitions (median exon delta). (C) Line plot illustrating the selection of the MCC and MRG that maximized the number of ERs that precisely matched exon definitions (exon delta = 0). The cerebellum tissue is plotted for (B) and (C), which is representative of the other GTEx tissues. Green and red lines indicate the optimal MCC (2.6) and MRG (70), respectively.
Fig. 2
Fig. 2. Transcription detected across 41 GTEx tissues categorized by annotation feature.
Within each tissue, the length of the ERs Mb overlapping (A) all annotation features, (B) purely exons, (C) exons and introns, (D) exons and intergenic regions, (E) purely intergenic regions, and (F) purely introns according to Ensembl v92 was computed. Tissues are plotted in descending order based on the respective total size of intronic and intergenic regions. Tissues are color-coded as indicated in the x axis, with GTEx brain regions highlighted with bold font. At least 8.4 Mb of previously unannotated transcription was discovered in each tissue, with the greatest quantity found within brain tissues (mean across brain tissues, 18.6 Mb; nonbrain, 11.2 Mb; two-sided Wilcoxon rank sum test, P = 2.35 × 10⁻¹⁰.
Fig. 3
Fig. 3. Validation of unannotated transcription.
(A) The classification of ERs based on v87 and v92 of Ensembl was compared. Across all tissues, the number of intron or intergenic ERs with respect to v87 that were known to be exonic in Ensembl v92 was greater than the number of ERs overlapping exons according to v87 that were now unannotated in v92. Tissues are plotted in descending order based on the total Mb of unannotated ERs with respect to Ensembl v87 that were validated (classified as exonic in the Ensembl v92). Tissues are color-coded as indicated in the x axis, with GTEx brain regions highlighted with bold font. (B) Bar plot represents the percentage of ERs seeding from the GTEx frontal cortex that validated in an independent frontal cortex RNA-seq dataset. ERs defined in the seed tissue were requantified using coverage from the validation dataset, after which the optimized MCC was applied to determine validated ERs. Colors represent the different annotation features that the ERs overlapped, and the shade indicates whether the ER was supported by junction read(s).
Fig. 4
Fig. 4. Unannotated ERs collectively serve an important function for humans, and a proportion can form potentially protein-coding transcripts.
(A) Comparison of conservation (phastCons7/phastCons20) and constraint (CDTS) of intronic and intergenic ERs to 10,000 sets of random, length-matched intronic and intergenic regions. Unannotated ERs marked by the red dashed line are less conserved than expected by chance but are more constrained. Brain-specific ERs marked by the green dashed lines are among the most constrained. Data for the cerebellum shown and is representative of other GTEx tissues. ***P = <2 × 10–16. (B) The DNA sequence for ERs overlapping two junction reads was obtained and converted to amino acid sequence for all three possible frames. ERs (2168; 57%) lacked a stop codon in at least one frame and were considered potentially protein coding.
Fig. 5
Fig. 5. Incomplete annotation of genes disproportionately affects oligodendrocytes.
(A) Bar plot displaying the enrichment of reannotated and not reannotated genes within brain cell type–specific gene sets. Blue bars represent the reannotated genes, and gray are those without reannotations. Of all analyzed cell types, the greatest difference between enrichment of reannotated and not reannotated was observed in oligodendrocytes. “*“ represents FDR-corrected P = <0.05. (B) Previously unannotated potentially protein-coding ER discovered in MBP, with an oligodendrocyte-specific expression pattern. The two junction reads in green intersect both the unannotated ER and also the known exons of MBP.
Fig. 6
Fig. 6. Reannotation of OMIM genes.
(A) A previously unannotated ER connected through a junction read was discovered for 63% of OMIM-morbid genes. (B) Comparison of the phenotype (HPO terms) associated with each reannotated OMIM-morbid gene and the GTEx tissue from which unannotated ERs were derived. Through manual inspection, HPO terms were matched to disease-relevant GTEx tissues and for 72% of reannotated OMIM genes, the associated unannotated ER was detected in the phenotype-relevant tissue. Visualized examples of reannotated OMIM-morbid genes (C) ERLIN1 and (D) SNCA. Top track represents the genomic region including the gene of interest marked in green. Second group of tracks detail the junction reads and ERs overlapping the genomic region derived from the labeled tissue. Blue ERs overlap known exonic regions, and red ERs fall within intronic or intergenic regions. Blue junction reads overlap blue ERs, while green junction reads overlap both red and blue ERs, connecting unannotated ERs to OMIM-morbid genes. Thickness of junction reads represents the proportion of samples of that tissue in which the junction read was detected. Only partially annotated junction reads (solid lines) and unannotated junction reads (dashed lines) are plotted. The last track displays the genes within the region according to Ensembl v92, with all known exons of the gene collapsed into one “meta” transcript.

References

    1. Thierry-Mieg D., Thierry-Mieg J., AceView: A comprehensive cDNA-supported gene and transcripts annotation. Genome Biol. 7, S12 (2006). - PMC - PubMed
    1. Harrow J., Frankish A., Gonzalez J. M., Tapanari E., Diekhans M., Kokocinski F., Aken B. L., Barrell D., Zadissa A., Searle S., Barnes I., Bignell A., Boychenko V., Hunt T., Kay M., Mukherjee G., Rajan J., Despacio-Reyes G., Saunders G., Steward C., Harte R., Lin M., Howald C., Tanzer A., Derrien T., Chrast J., Walters N., Balasubramanian S., Pei B., Tress M., Rodriguez J. M., Ezkurdia I., van Baren J., Brent M., Haussler D., Kellis M., Valencia A., Reymond A., Gerstein M., Guigo R., Hubbard T. J., GENCODE: The reference human genome annotation for The ENCODE Project. Genome Res. 22, 1760–1774 (2012). - PMC - PubMed
    1. O’Leary N. A., Wright M. W., Brister J. R., Ciufo S., Haddad D., Veigh R. M., Rajput B., Robbertse B., Smith-White B., Ako-Adjei D., Astashyn A., Badretdin A., Bao Y., Blinkova O., Brover V., Chetvernin V., Choi J., Cox E., Ermolaeva O., Farrell C. M., Goldfarb T., Gupta T., Haft D., Hatcher E., Hlavina W., Joardar V. S., Kodali V. K., Li W., Maglott D., Masterson P., Mc Garvey K. M., Murphy M. R., O’Neill K., Pujar S., Rangwala S. H., Rausch D., Riddick L. D., Schoch C., Shkeda A., Storz S. S., Sun H., Thibaud-Nissen F., Tolstoy I., Tully R. E., Vatsan A. R., Wallin C., Webb D., Wu W., Landrum M. J., Kimchi A., Tatusova T., Cuccio M. D., Kitts P., Murphy T. D., Pruitt K. D., Reference sequence (RefSeq) database at NCBI: Current status, taxonomic expansion, and functional annotation. Nucleic Acids Res. 44, D733–D745 (2016). - PMC - PubMed
    1. Zerbino D. R., Achuthan P., Akanni W., Amode M. R., Barrell D., Bhai J., Billis K., Cummins C., Gall A., Girón C. G., Gil L., Gordon L., Haggerty L., Haskell E., Hourlier T., Izuogu O. G., Janacek S. H., Juettemann T., To J. K., Laird M. R., Lavidas I., Liu Z., Loveland J. E., Maurel T., McLaren W., Moore B., Mudge J., Murphy D. N., Newman V., Nuhn M., Ogeh D., Ong C. K., Parker A., Patricio M., Riat H. S., Schuilenburg H., Sheppard D., Sparrow H., Taylor K., Thormann A., Vullo A., Walts B., Zadissa A., Frankish A., Hunt S. E., Kostadima M., Langridge N., Martin F. J., Muffato M., Perry E., Ruffier M., Staines D. M., Trevanion S. J., Aken B. L., Cunningham F., Yates A., Flicek P., Ensembl 2018. Nucleic Acids Res. 46, D754–D761 (2018). - PMC - PubMed
    1. Chen G., Wang C., Shi L., Qu X., Chen J., Yang J., Shi C., Chen L., Zhou P., Ning B., Tong W., Shi T., Incorporating the human gene annotations in different databases significantly improved transcriptomic and genetic analyses. RNA 19, 479–489 (2013). - PMC - PubMed

Publication types

LinkOut - more resources