. 2020 Sep 11;6(37):eabc5961.
doi: 10.1126/sciadv.abc5961. Print 2020 Sep.

Efficient high-throughput SARS-CoV-2 testing to detect asymptomatic carriers

Affiliations

Efficient high-throughput SARS-CoV-2 testing to detect asymptomatic carriers

Noam Shental et al. Sci Adv. .

Abstract

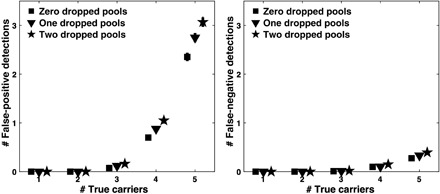
Recent reports suggest that 10 to 30% of severe acute respiratory syndrome coronavirus 2 (SARS- CoV-2) infected patients are asymptomatic and that viral shedding may occur before symptom onset. Therefore, there is an urgent need to increase diagnostic testing capabilities to prevent disease spread. We developed P-BEST, a method for Pooling-Based Efficient SARS-CoV-2 Testing, which identifies all positive subjects within a set of samples using a single round of testing. Each sample is assigned into multiple pools using a combinatorial pooling strategy based on compressed sensing. We pooled sets of 384 samples into 48 pools, providing both an eightfold increase in testing efficiency and an eightfold reduction in test costs, while identifying up to five positive carriers. We then used P-BEST to screen 1115 health care workers using 144 tests. P- BEST provides an efficient and easy-to-implement solution for increasing testing capacity that can be easily integrated into diagnostic laboratories.


Figures

Fig. 1
Fig. 1. P-BEST design and detection results obtained for a set of 384 samples with a carrier rate of ~1%.
(A) Pooling design: Pools are generated using a combinatorial pooling design based on an error-correcting code that optimizes carrier detection. The P-BEST pooling design for a carrier rate of ~1% uses 48 pools to simultaneously test 384 subjects providing both an eightfold increase in testing efficiency and an eightfold reduction in testing reagent costs. Each sample is distributed to six pools, and there are a total of 48 subjects per pool. Subjects in red represent the four unidentified infected individuals within the set of 384 samples. (B) Pooled samples are then treated as individual samples—RNA is extracted, followed by a standard PCR amplification. Positive pools are designated by red circles. (C) P-BEST identifies the positive samples of the 384 samples using an optimization-based algorithm based on compressed sensing. (D) Results of the four experiments performed, containing 2, 3, 4, or 5 positive samples, respectively. All positive carriers were correctly identified in all experiments. When five positive carriers were tested (carrier rate of 1.3%), a single false-positive sample was added to the true-positive ones.
Fig. 2
Fig. 2. Effect of sample dilution on C(t) values.
(A) Five positive samples from the SUMC virology laboratory were heat inactivated (70°C, 60 min) and tested as individual samples and in pools of sizes 8, 16, 20, and 24. For each pool size, the set of negative samples used was identical across all five samples tested, e.g., the same seven negative samples were used to create all pools of size 8. Sample’s de-identified study IDs appear above each subplot. Each pool size is plotted in a different color. All samples, including those with C(t) > 34 were identified in all pool sizes, yet in some cases, the C(t) value does not monotonically increase with pool size. Samples were tested using an in-house PCR kit based on the SARS-CoV-2 E gene. (B) Five positive samples were mixed into three pools of sizes 16 and 48, each containing a distinct set of negative samples. Sample de-identified study IDs appear above each subplot. RNA was extracted from all single samples and pools and subsequently tested for SARS-CoV-2 using the Seegene diagnostic kit. All five samples were identified across all pools of both sizes, yet triplicates sometime display variation in C(t).
Fig. 3
Fig. 3. P-BEST in silico performance.
A small number of carriers were randomly assigned to 384 samples, and a P-BEST experiment was simulated using the reported pooling scheme designed for a carrier rate of ~1%. Simulations accounted for the estimated variation in RNA amounts based on measurements of n = 48 individual samples and also assumed that 1 of the 48 pools failed PCR amplification. Samples reported by P-BEST were compared to the true simulated sample labels to estimate the P-BEST’s success rate. Results were averaged over 3000 simulations. Error bars correspond to 95% CIs. (A) Average number of samples reported by P-BEST as a function of the number of true carriers. For example, P-BEST reports exactly two samples when simulating two carriers and retrieves an average of ~7.4 samples when the simulated set contains five carriers. (B) Average number of true positives, false negatives, and false positives identified for a given number of simulated carriers. Even for five carriers, the number of false negatives is lower than 1, and the average number of false positives remains low (<3).
Fig. 4
Fig. 4. Evaluating the effect of variation in RNA levels on P-BEST performance.
To assess the effects of variations in RNA levels, we measured the average number of false-positive and false-negative detections as a function of the true number of carriers across 3000 simulations in two scenarios: (i) no noise in RNA levels (black square) and (ii) RNA noise based on the measured variation of RNA levels across 48 samples (see fig. S1). Simulations used the pooling scheme designed for a carrier rate of ~1%. The false-positive (left) and false-negative (right) detection rates for the two scenarios show that RNA variation does not substantially degrade P-BEST performance. All simulations considered one dropped pool. Error bars correspond to 95% CIs.
Fig. 5
Fig. 5. Evaluating the effect of dropped pools on P-BEST performance.
To assess the effects of dropped pools due to PCR amplification failures, we measured the average number of false-positive (left) and false-negative (right) detections as a function of the true number of carriers across 3000 simulations for zero, one, or two randomly dropped pools using the pooling scheme designed for a carrier rate of ~1%. P-BEST seems to be robust to one to two dropped pools. All simulations considered the experimental level of RNA variation, as measured across 48 samples (fig. S1A). Error bars correspond to 95% CIs.

References

    1. Bai Y., Yao L., Wei T., Tian F., Jin D.-Y., Chen L., Wang M., Presumed asymptomatic carrier transmission of COVID-19. JAMA 323, 1406–1407 (2020). - PMC - PubMed
    1. Li R., Pei S., Chen B., Song Y., Zhang T., Yang W., Shaman J., Substantial undocumented infection facilitates the rapid dissemination of novel coronavirus (SARS-CoV2). Science 368, 489–493 (2020). - PMC - PubMed
    1. Mizumoto K., Kagaya K., Zarebski A., Chowell G., Estimating the asymptomatic proportion of coronavirus disease 2019 (COVID-19) cases on board the Diamond Princess cruise ship, Yokohama, Japan, 2020. Euro Surveill. 25, 2000180 (2020). - PMC - PubMed
    1. Moriarty L. F., Plucinski M. M., Marston B. J., Kurbatova E. V., Knust B., Murray E. L., Pesik N., Rose D., Fitter D., Kobayashi M., Toda M., Cantey P. T., Scheuer T., Halsey E. S., Cohen N. J., Stockman L., Wadford D. A., Medley A. M., Green G., Regan J. J., Tardivel K., White S., Brown C., Morales C., Yen C., Wittry B., Freeland A., Naramore S., Novak R. T., Daigle D., Weinberg M., Acosta A., Herzig C., Kapella B. K., Jacobson K. R., Lamba K., Ishizumi A., Sarisky J., Svendsen E., Blocher T., Wu C., Charles J., Wagner R., Stewart A., Mead P. S., Kurylo E., Campbell S., Murray R., Weidle P., Cetron M., Friedman C. R.; CDC Cruise Ship Response Team; California Department of Public Health COVID- Team; Solano County COVID-Team , Public health responses to COVID-19 outbreaks on cruise ships - Worldwide, February-March 2020. MMWR Morb. Mortal. Wkly Rep. 69, 347–352 (2020). - PMC - PubMed
    1. Rothe C., Schunk M., Sothmann P., Bretzel G., Froeschl G., Wallrauch C., Zimmer T., Thiel V., Janke C., Guggemos W., Seilmaier M., Drosten C., Vollmar P., Zwirglmaier K., Zange S., Wölfel R., Hoelscher M., Transmission of 2019-nCoV infection from an asymptomatic contact in germany. N. Engl. J. Med. 382, 970–971 (2020). - PMC - PubMed