. 2021 May 10;62(5):656-664.
doi: 10.2967/jnumed.120.250720. Epub 2020 Sep 11.

89Zr-Labeled Anti-PD-L1 Antibody PET Monitors Gemcitabine Therapy-Induced Modulation of Tumor PD-L1 Expression

Affiliations

89Zr-Labeled Anti-PD-L1 Antibody PET Monitors Gemcitabine Therapy-Induced Modulation of Tumor PD-L1 Expression

Kyung-Ho Jung et al. J Nucl Med. .

Abstract

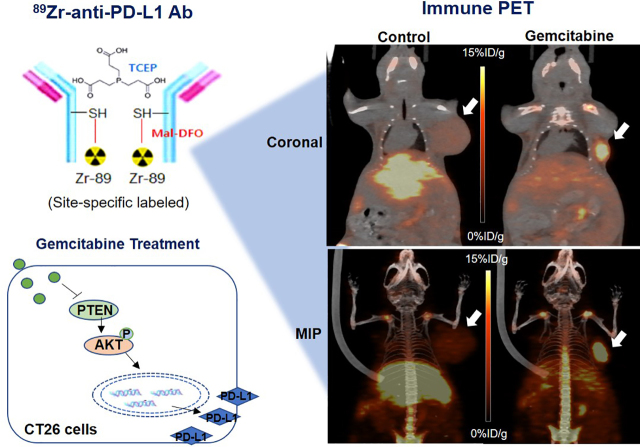
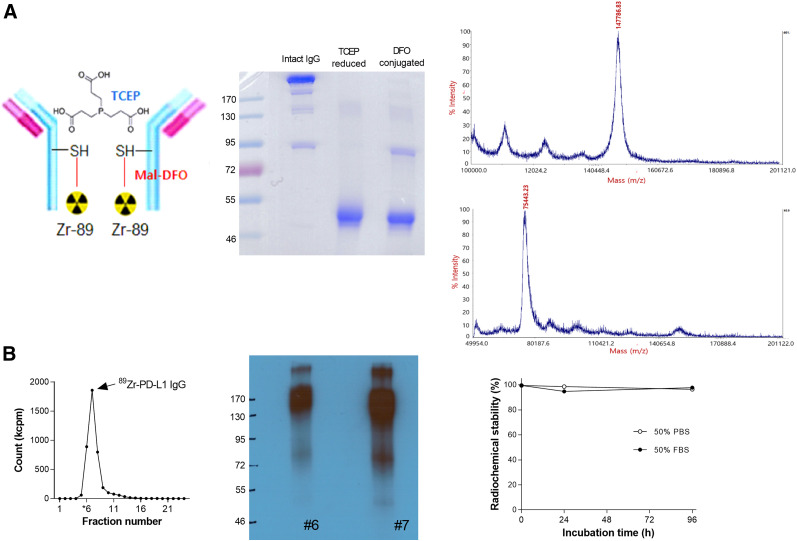
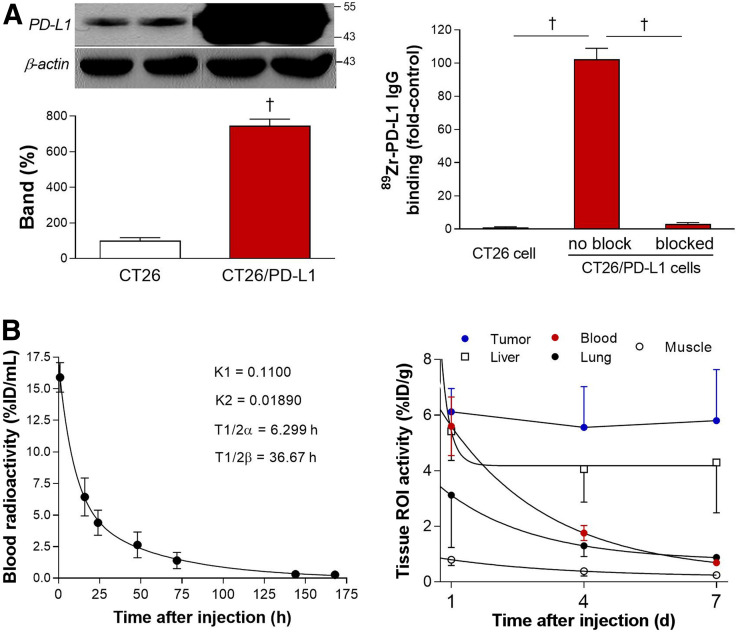
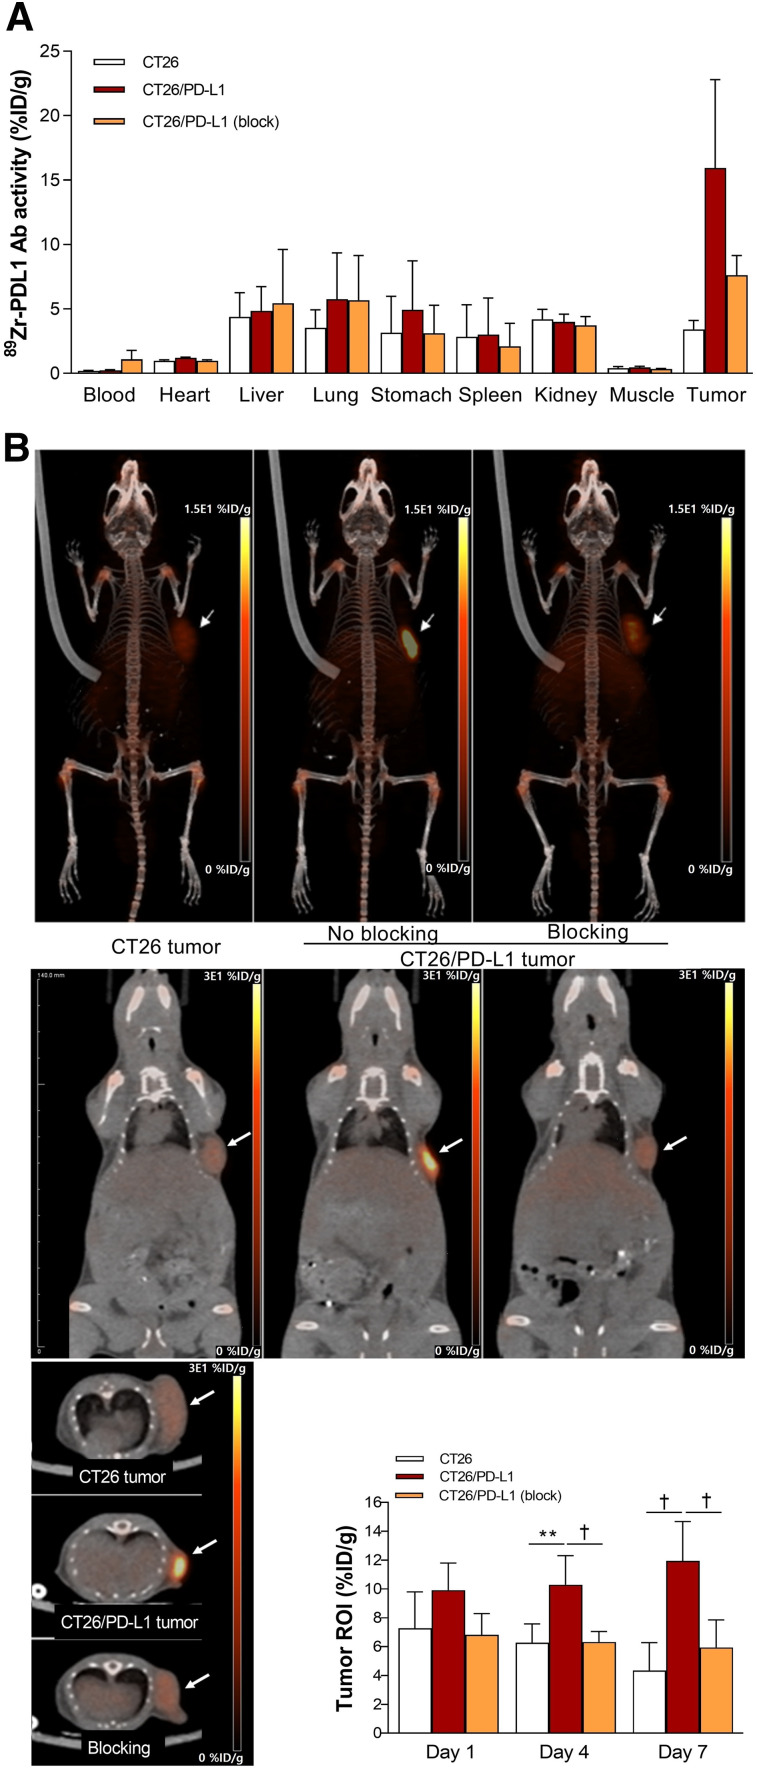
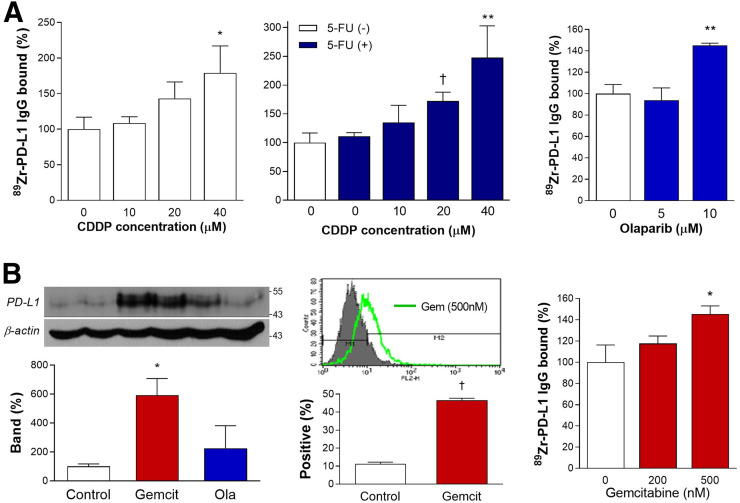
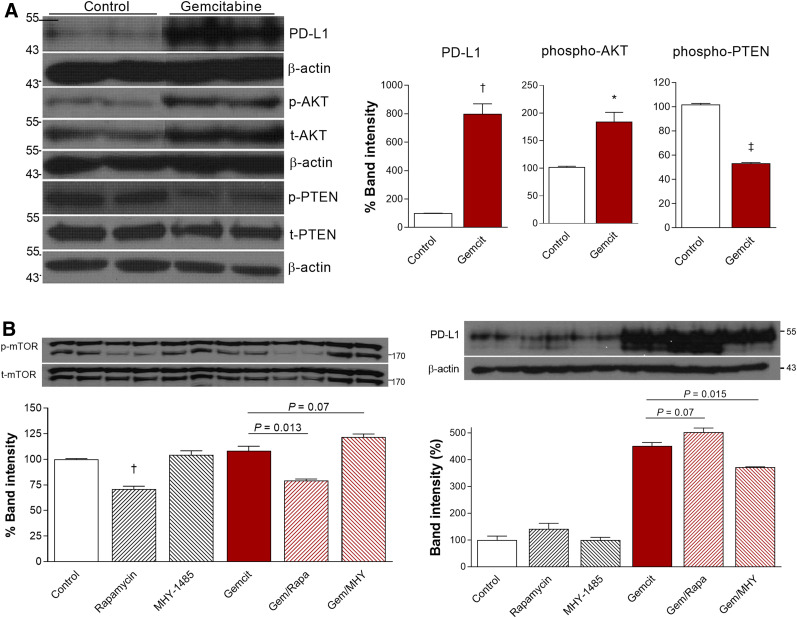
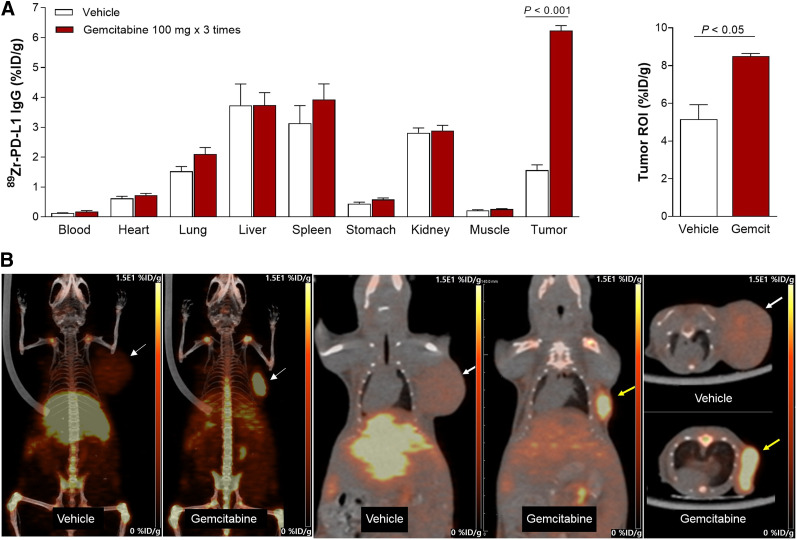
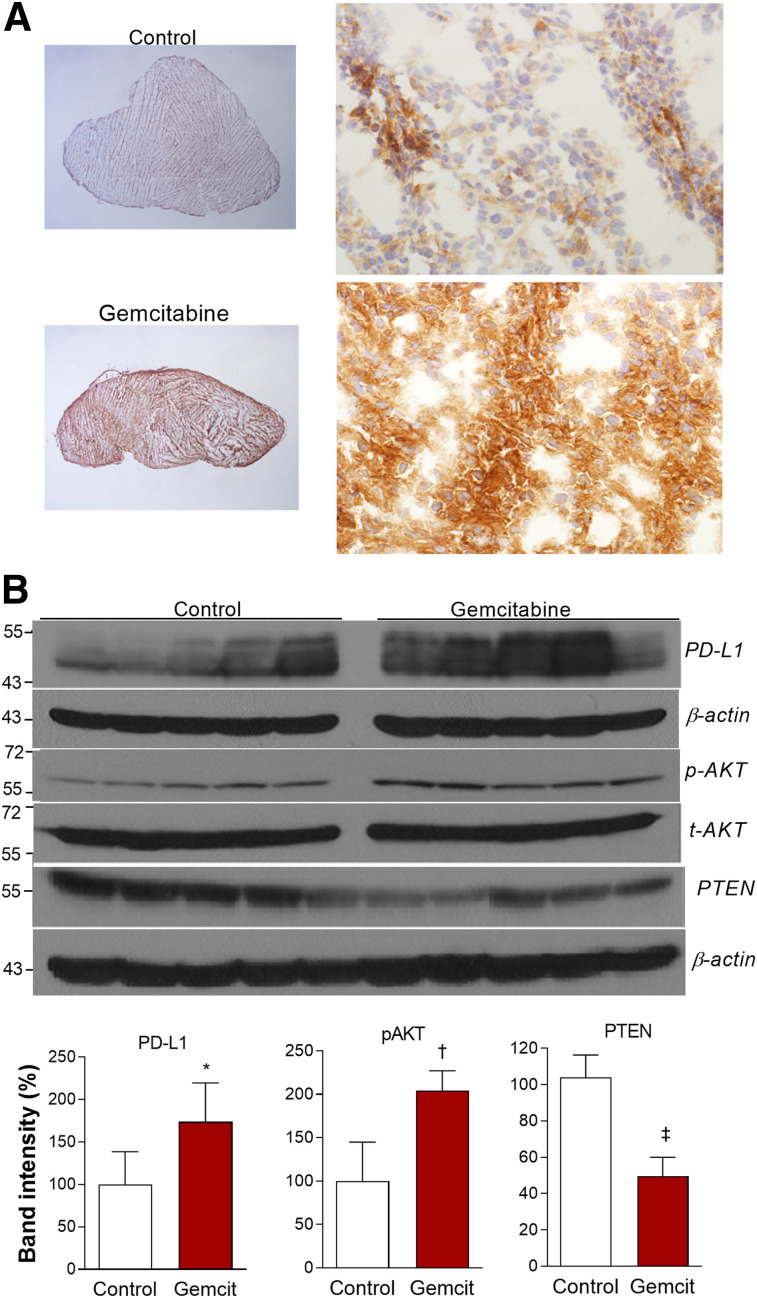
We developed an 89Zr-labeled anti-programmed death ligand 1 (anti-PD-L1) immune PET that can monitor chemotherapy-mediated modulation of tumor PD-L1 expression in living subjects. Methods: Anti-PD-L1 underwent sulfohydryl moiety-specific conjugation with maleimide-deferoxamine followed by 89Zr radiolabeling. CT26 colon cancer cells and PD-L1-overexpressing CT26/PD-L1 cells underwent binding assays, flow cytometry, and Western blotting. In vivo pharmacokinetics, biodistribution, and PET imaging were evaluated in mice. Results:89Zr-anti-PD-L1 synthesis was straightforward and efficient. Sodium dodecyl sulfate polyacrylamide gel electrophoresis showed that reduction produced half-antibody fragments, and matrix-assisted laser desorption ionization time-of-flight analysis estimated 2.18 conjugations per antibody, indicating specific conjugation at the hinge-region disulfide bonds. CT26/PD-L1 cells showed 102.2 ± 6.7-fold greater 89Zr-anti-PD-L1 binding than that of weakly expressing CT26 cells. Excellent target specificity was confirmed by a drastic reduction in binding by excess cold antibody. Intravenous 89Zr-anti-PD-L1 followed biexponential blood clearance. PET/CT image analysis demonstrated decreases in major organ activity over 7 d, whereas high CT26/PD-L1 tumor activity was maintained. Again, this was suppressed by excess cold antibody. Treatment of CT26 cells with gemcitabine for 24 h augmented PD-L1 protein to 592.4% ± 114.2% of the control level and increased 89Zr-anti-PD-L1 binding, accompanied by increased AKT (protein kinase B) activation and reduced phosphatase and tensin homolog (PTEN). In CT26 tumor-bearing mice, gemcitabine treatment substantially increased tumor uptake from 1.56% ± 0.48% to 6.24% ± 0.37% injected dose per gram (tumor-to-blood ratio, 34.7). Immunoblots revealed significant increases in tumor PD-L1 and activated AKT and a decrease in PTEN. Conclusion:89Zr-anti-PD-L1 showed specific targeting with favorable imaging properties. Gemcitabine treatment upregulated cancer cell and tumor PD-L1 expression and increased 89Zr-anti-PD-L1 uptake. 89Zr-anti-PD-L1 PET may thus be useful for monitoring chemotherapy-mediated tumor PD-L1 modulation in living subjects.

Keywords: 89Zr; PD-L1; antibody; cancer; gemcitabine; immuno-PET.


Figures

None
Graphical abstract
FIGURE 1.
FIGURE 1.
89Zr-labeling of anti-PD-L1. (A) Diagram of 89Zr-anti-PD-L1 (left), nonreduced sodium dodecyl sulfate PAGE (middle), and MALDI time-of-flight results (right). (B) Radioactivity profile of PD-10 column–eluted fractions (left), autoradiography on native PAGE (middle), and in vitro stability (right). DFO = deferoxamine; FBS = fetal bovine serum; Mal = maleimide; PBS = phosphate-buffered saline; SH = sulfohydryl; TCEP = tris(2-carboxyethyl)phosphine
FIGURE 2.
FIGURE 2.
Cell binding and pharmacokinetic properties. (A) Western blotting of PD-L1 (left) and 89Zr-anti-PD-L1 binding (right) are shown for CT26 and CT26/PD-L1 cancer cells. Bars are means ± SDs. P < 0.005. (B) Time-dependent blood clearance in normal mice shows early and late rate constants (K 1 and K 2) and half-lives (T½α and T½β) (left). Pharmacokinetic profile in major organs and tumor was measured by PET-based analysis in CT26/PD-L1 tumor mice (n = 5) at 1, 4, and 7 d (right). ROI = region of interest.
FIGURE 3.
FIGURE 3.
Biodistribution and tumor imaging. (A) Biodistribution in CT26 and CT26/PD-L1 tumor–bearing mice with or without blocking at day 7. (B) Representative maximum-intensity-projection (top), coronal (middle), and transaxial (bottom) PET images. PET-based tumor uptakes are also shown. All bars are means ± SDs of values from 5 mice per group. **P < 0.01. P < 0.005. Ab = antibody; ROI = region of interest.
FIGURE 4.
FIGURE 4.
Effects of chemotherapeutic agents on CT26 cells. (A) Stimulatory effects of 24-h treatment with graded doses of cisplatin (CDDP) alone (left), CDDP plus 5-fluorouracil (middle), or olaparib (right) on 89Zr-anti-PD-L1 binding. (B) PD-L1 immunoblots and β-actin–corrected band (left), flow cytometry of PD-L1–positive cells (middle), and 89Zr-anti-PD-L1 binding (right). Bars are means ± SDs. Binding data are from triplicate samples per group. *P < 0.05, compared with controls. **P < 0.01, compared with controls. P < 0.005, compared with controls.
FIGURE 5.
FIGURE 5.
AKT and PTEN signaling in gemcitabine effect on CT26 cells. (A) Immunoblots and quantified protein band intensities (corrected by appropriate controls) for PD-L1, p-AKT, and p-PTEN. (B) Effects of rapamycin (1 μM) and MHY1485 (2 μM) on immunoblots and band intensities for p-mTOR (corrected by t-mTOR) and PD-L1 (corrected by β-actin). Bars are means ± SDs. *P < 0.05. P < 0.005. P < 0.001.
FIGURE 6.
FIGURE 6.
Effect of gemcitabine on tumor 89Zr-anti-PD-L1 uptake. (A) Biodistribution in CT26 tumor mice treated with vehicle or gemcitabine at day 7 (left). PET-based tumor activity is shown on right. Data are mean ± SD of %ID/g (n = 5 per group). (B) Representative maximum-intensity-projection (left), coronal (middle), and transaxial (right) PET images of vehicle- and gemcitabine-treated animals. ROI = region of interest.
FIGURE 7.
FIGURE 7.
Effects of gemcitabine on CT26 tumor expression. (A) Representative tumor PD-L1 immunohistochemistry (magnification, ×12.5 on left and ×400 on right). (B) Immunoblots of tumor tissues (top), and protein band intensities of PD-L1 and PTEN corrected by β-actin and p-AKT corrected by t-AKT (bottom). Bars are means ± SDs (n = 5 per group). *P < 0.05. P < 0.005. P < 0.001.

References

    1. Topalian SL, Hodi FS, Brahmer JR, et al. . Safety, activity, and immune correlates of anti-PD-1 antibody in cancer. N Engl J Med. 2012;366:2443–2454. - PMC - PubMed
    1. Butte MJ, Keir ME, Phamduy TB, Sharpe AH, Freeman GJ. Programmed death-1 ligand 1 interacts specifically with the B7-1 costimulatory molecule to inhibit T cell responses. Immunity. 2007;27:111–122. - PMC - PubMed
    1. Song Y, Li Z, Xue W, Zhang M. Predictive biomarkers for PD-1 and PD-L1 immune checkpoint blockade therapy. Immunotherapy. 2019;11:515–529. - PubMed
    1. McLaughlin J, Han G, Schalper KA, et al. . Quantitative assessment of the heterogeneity of PD-L1 expression in non-small-cell lung cancer. JAMA Oncol. 2016;2:46–54. - PMC - PubMed
    1. Brodská B, Otevřelová P, Šálek C, Fuchs O, Gašová Z, Kuželová K. High PD-L1 expression predicts for worse outcome of leukemia patients with concomitant NPM1 and FLT3 mutations. Int J Mol Sci. 2019;20:2823. - PMC - PubMed

Publication types