. 2020 Oct 15;205(8):2039-2045.
doi: 10.4049/jimmunol.2000614. Epub 2020 Sep 11.

Type II Cytokines Fine-Tune Thymic T Cell Selection to Offset Murine Central Nervous System Autoimmunity

Affiliations

Type II Cytokines Fine-Tune Thymic T Cell Selection to Offset Murine Central Nervous System Autoimmunity

Subhasis Barik et al. J Immunol. .

Abstract

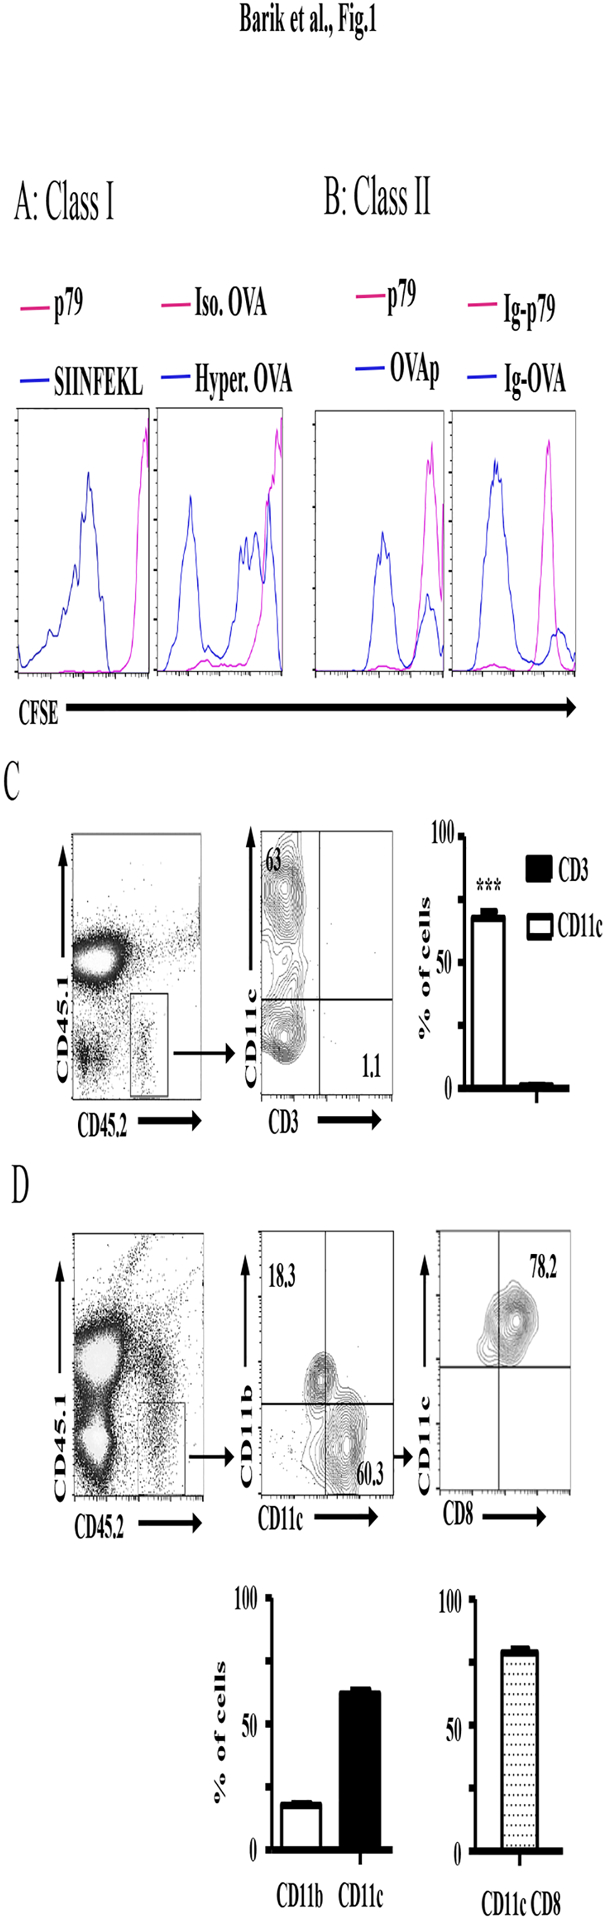
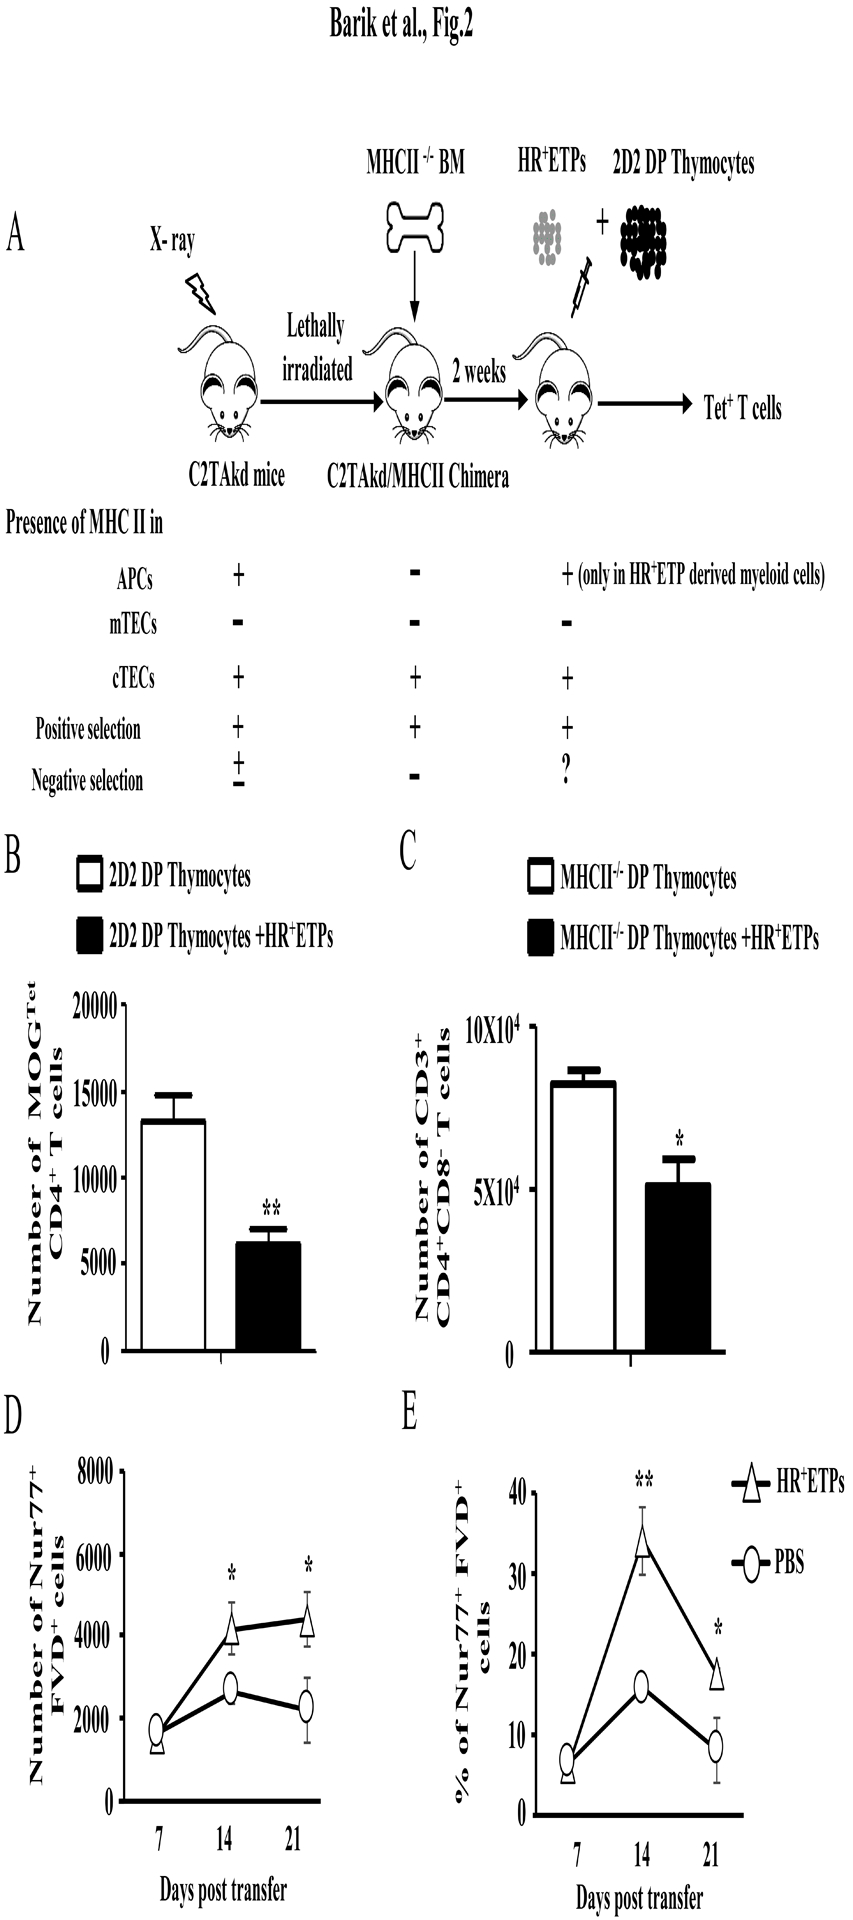
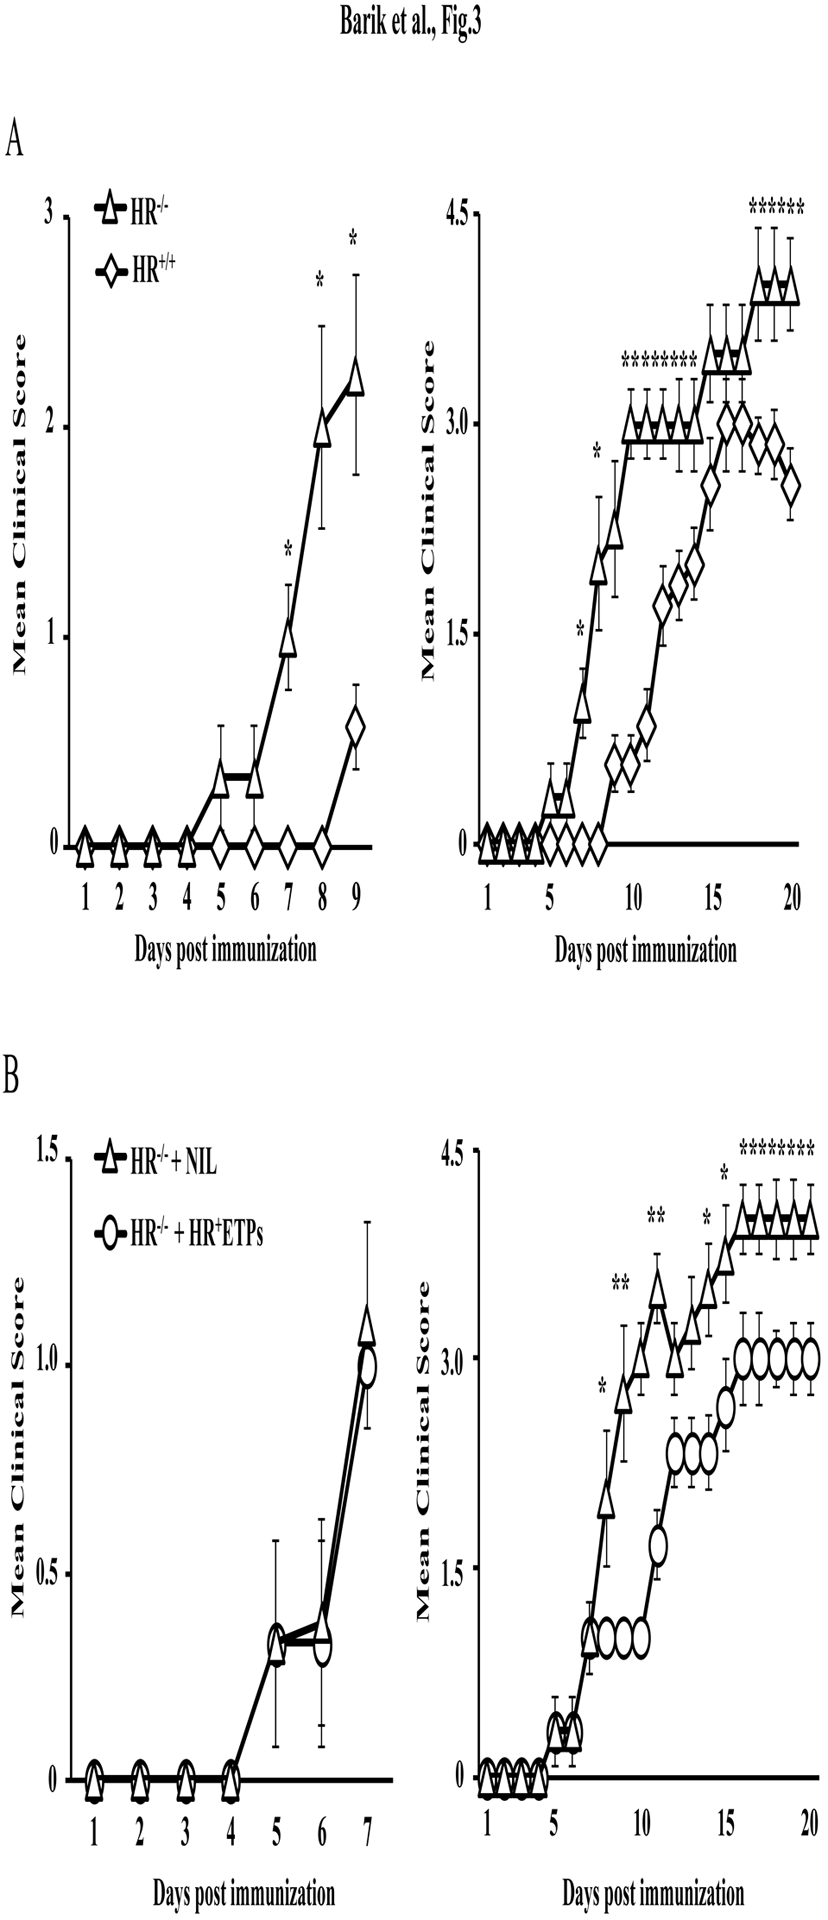
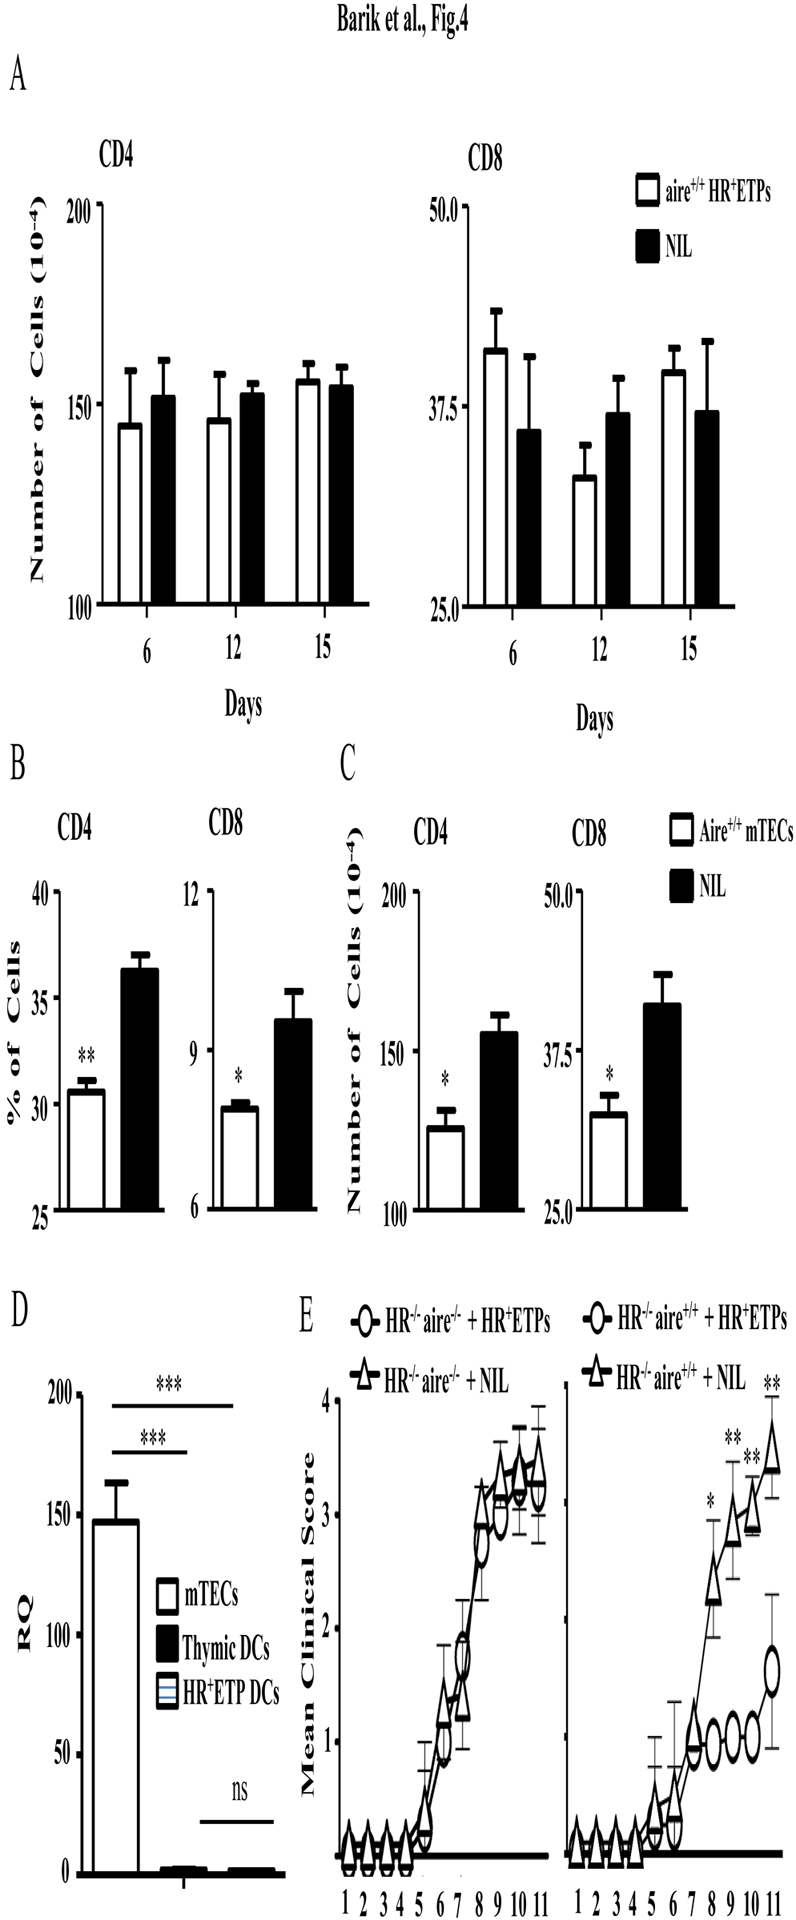
Early thymic progenitors (ETPs) are bone marrow-derived hematopoietic stem cells that remain multipotent and give rise to a variety of lineage-specific cells. Recently, we discovered a subset of murine ETPs that expresses the IL-4Rα/IL-13Rα1 heteroreceptor (HR) and commits only to the myeloid lineage. This is because IL-4/IL-13 signaling through the HR inhibits their T cell potential and enacts commitment of HR+ETPs to thymic resident CD11c+CD8α+ dendritic cells (DCs). In this study, we discovered that HR+-ETP-derived DCs function as APCs in the thymus and promote deletion of myelin-reactive T cells. Furthermore, this negative T cell selection function of HR+-ETP-derived DCs sustains protection against experimental allergic encephalomyelitis, a mouse model for human multiple sclerosis. These findings, while shedding light on the intricacies underlying ETP lineage commitment, reveal a novel, to our knowledge, function by which IL-4 and IL-13 cytokines condition thymic microenvironment to rheostat T cell selection and fine-tune central tolerance.


Figures

Figure 1.
Figure 1.. HR+ETPs give rise to CD8α+CD11c+ DCs which present MHC class I- and II-restricted Ags.
(A, B) Shows CFSE-dilution by CD8 OT-I (A) and CD4 OT-II (B) T cells (100 × 103 cell/ well) upon stimulation with in vitro IL-4-guided ETP-derived DCs that were pre-loaded with Ag. (A) For Class I classical presentation the DCs (5 × 10³ cells/well) were loaded with free SIINFEKL (1μM) or control p79 (10 μM) peptide (left panel) and for class I cross-presentation, the DCs were loaded with soluble OVA (70 μM) after osmotic shock in hypertonic (Hyper.OVA) or isotonic (Iso.OVA) media (right panel) as described (41). (B) For class II classical presentation, the DCs were loaded with 10 μM free OVAp or negative control p79 peptide (left panel) and for endocytic presentation the DCs were loaded with 1 μM Ig-OVA or negative control Ig-p79 (right panel). This is representative of 3 experiments. (C) Thymic cells from CD45.2 IL-13Rα1-GFP reporter mice were depleted of Lin+ cells and the LinCD4CD8 cells were stained with antibodies to CD25, CD44, and c-Kit. The CD25CD44+c-Kit+GFP+ (HR+ETPs) were sorted and injected i.t. (50 × 103 cells/mouse) into congenic (CD45.1) hosts. The thymic cells were stained with anti-CD45.1, CD45.2, CD11c and CD3ε antibodies and evaluated for CD11c and CD3 expression by CD45.2+ cells on day 16 after transfer. The contour plots show a representative experiment while the bar graph shows data compiled from 3 independent experiments.*** p< 0.001 as determined by two-tailed unpaired Student t-test. (D) CD45.2 HR+ETPs were injected i.t. (50 × 103 cells/ mouse) into CD45.1 hosts and the thymic cells harvested on day 12 post-transfer were stained with anti-CD45.1, CD45.2, CD11b, CD11c and CD8α antibodies. The CD45.2+ cells were evaluated for CD11b, CD11c and CD8α expression. The contour plots show a representative experiment while the bar graphs show the mean ± SD of cell percentage compiled from 3 independent experiments.
Figure 2.
Figure 2.. HR+ETP-derived thymic APCs support thymic negative T cell selection.
(A) C2TAkd mice that specifically lack MHCII expression in mTECs but not cTECs which can partially drive negative T cell selection, were lethally irradiated (990 rads) and given BM cells (10 × 106 cells) from MHCII−/− mice. Positive but not negative thymic T cell selection is functional in these chimeric mice. The chimeras were then given i.t. unselected double-positive monoclonal (B) or polyclonal (CD45.2) from 2D2 TCR-MOG transgenic and normal C57BL/6 mice, respectively (C-E) and HR+ETPs (from MHCII+/+ mice) and used to measure thymic negative T cell selection. (B and C) Thymi were harvested on day 21 and used to assess for negative T cell selection. (B) The bars represent the mean ± SD of the absolute number of MOGTet+ CD4 SP 2D2 T cells. Data are representative of 2 independent experiments in which 7 mice were tested individually. (C) Shows the absolute number of CD45.2+CD3+ polyclonal CD4 SP T cells. (D and E) Show the number (D) and percentages (E) of CD45.2+CD3+ polyclonal CD4 SP FVD+ Nur77+ T cells undergoing negative selection. *p<0.05, and **p<0.01 as determined by two-tailed, unpaired Student’s t-test.
Figure 3.
Figure 3.. HR+ETP derived APCs support protection against EAE.
(A) HR+/+ and HR−/− C57BL/6 mice (6–8 per group) were induced for EAE with MOGp and monitored daily for disease severity for 20 days. The graphs show the mean ± SD clinical scores during disease onset (left panel) and progression (right panel). *p<0.05, **p<0.01 as determined by Mann-Whitney’s U test. (B) HR−/− mice (6–8 per group) were given i.t. HR+ETPs (15,000 cells/mouse) or saline with no cells (NIL) twice (7 days apart) and 2 weeks later were induced for EAE with MOGp. The hosts were monitored daily for disease severity for 20 days. The graphs show the mean ± SD clinical scores during disease onset (left panel) and progression (right panel). *p<0.05, **p<0.01 as determined by Mann-Whitney’s U test.
Figure 4.
Figure 4.. HR+ETP-derived APCs rely on aire gene expression to support protection against EAE
(A) Aire−/−HR+/+ C57BL/6 hosts were given (i.t.) PBS (NIL) or aire+/+HR+ETPs (15 × 103 cells/mouse) twice (7 days apart) and thymic SP CD4 and CD8 T cells were analysed at the indicated day post transfer. The bars show the mean absolute number of SP cells ± SD compiled from 3 independent experiments. Each experiment included 5 mice per group that were tested individually. (B and C) Aire−/−HR+/+ C57BL/6 hosts were given (i.t.) PBS (NIL) or aire+/+mTECs (15 × 103 cells/mouse) once and thymic SP CD4 and CD8 T cells were analysed on day 6 post transfer. The bars show the mean percentage (B) and absolute number (C) of SP cells ± SD compiled from 3 independent experiments. *p<0.05 and **p<0.01 as determined by two-tailed unpaired Student t-test. (D) mTECs, total thymic CD11c+, and HR+ETP derived CD11c+ cells were sorted from aire+/+HR+/+ C57BL/6 mice and assessed for aire gene expression by RT-PCR. ***p<0.001 as determined by one-way ANOVA. (E) HR−/− Aire−/− (left panel) and HR−/−Aire+/+ (right panel) C57BL/6 mice were given (i.t.) HR+ETPs (15,000 cells/mouse) or PBS (NIL) twice (7 days apart) and two weeks later induced for EAE with MOGp. The mice were monitored daily for disease severity for 11 days. The graphs show the mean ± SD clinical scores. **p<0.01 as determined by Mann-Whitney U test.

Similar articles

Cited by

References

    1. Bell JJ, and Bhandoola A. 2008. The earliest thymic progenitors for T cells possess myeloid lineage potential. Nature 452: 764–767. - PubMed
    1. Wada H, Masuda K, Satoh R, Kakugawa K, Ikawa T, Katsura Y, and Kawamoto H. 2008. Adult T-cell progenitors retain myeloid potential. Nature 452: 768–772. - PubMed
    1. Luc S, Luis TC, Boukarabila H, Macaulay IC, Buza-Vidas N, Bouriez-Jones T, Lutteropp M, Woll PS, Loughran SJ, Mead AJ, Hultquist A, Brown J, Mizukami T, Matsuoka S, Ferry H, Anderson K, Duarte S, Atkinson D, Soneji S, Domanski A, Farley A, Sanjuan-Pla A, Carella C, Patient R, de Bruijn M, Enver T, Nerlov C, Blackburn C, Godin I, and Jacobsen SE. 2012. The earliest thymic T cell progenitors sustain B cell and myeloid lineage potential. Nat Immunol 13: 412–419. - PMC - PubMed
    1. Rothenberg EV 2014. Transcriptional control of early T and B cell developmental choices. Annu Rev Immunol 32: 283–321. - PMC - PubMed
    1. Califano D, Cho JJ, Uddin MN, Lorentsen KJ, Yang Q, Bhandoola A, Li H, and Avram D. 2015. Transcription Factor Bcl11b Controls Identity and Function of Mature Type 2 Innate Lymphoid Cells. Immunity 43: 354–368. - PMC - PubMed

Publication types

MeSH terms