. 2020 Sep 11;11(1):4577.
doi: 10.1038/s41467-020-18266-2.

Nucleoporin TPR is an integral component of the TREX-2 mRNA export pathway

Affiliations

Nucleoporin TPR is an integral component of the TREX-2 mRNA export pathway

Vasilisa Aksenova et al. Nat Commun. .

Abstract

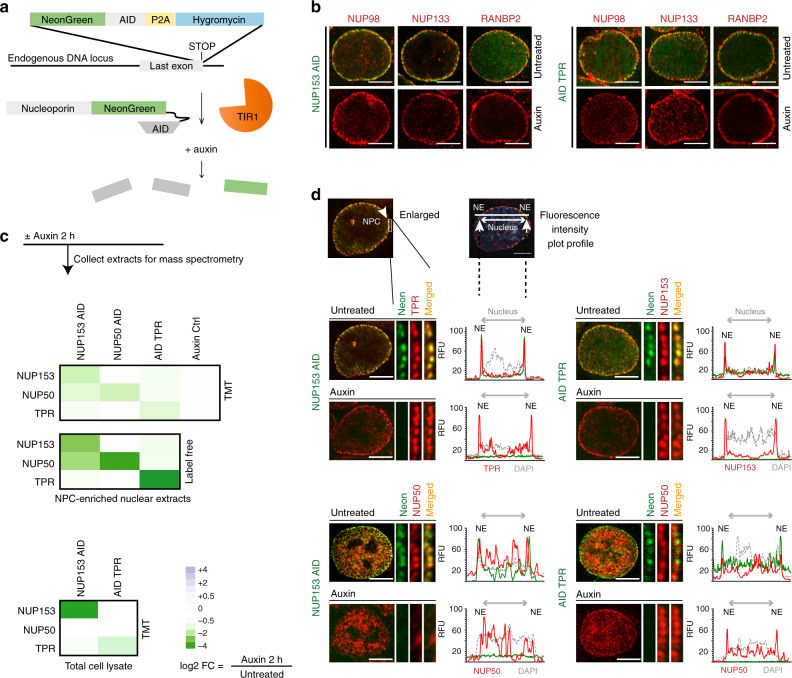
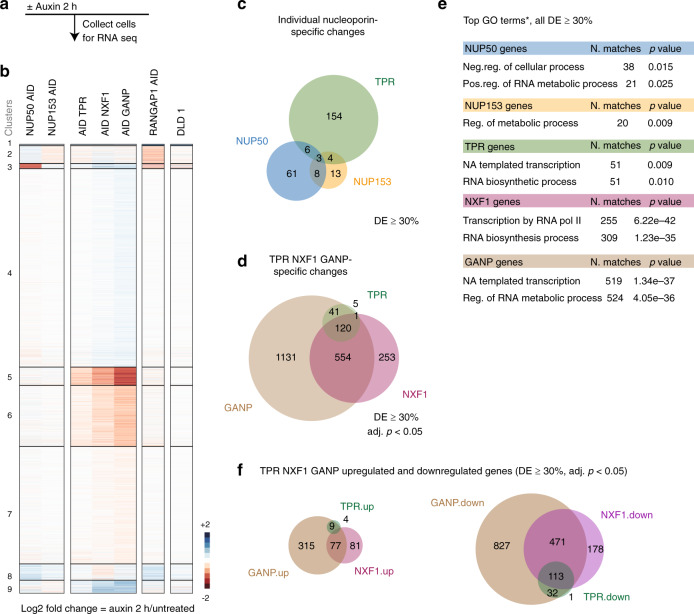
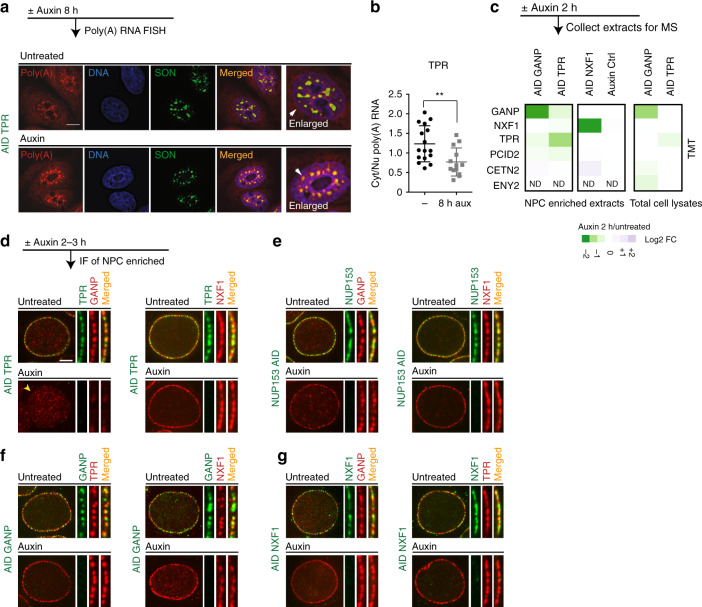
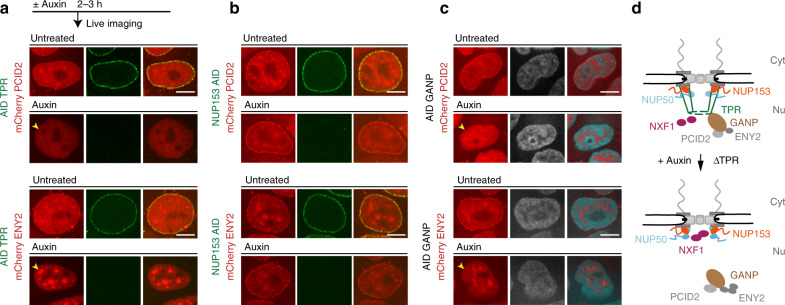
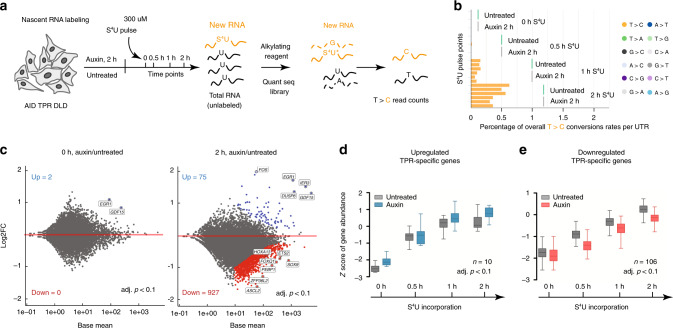
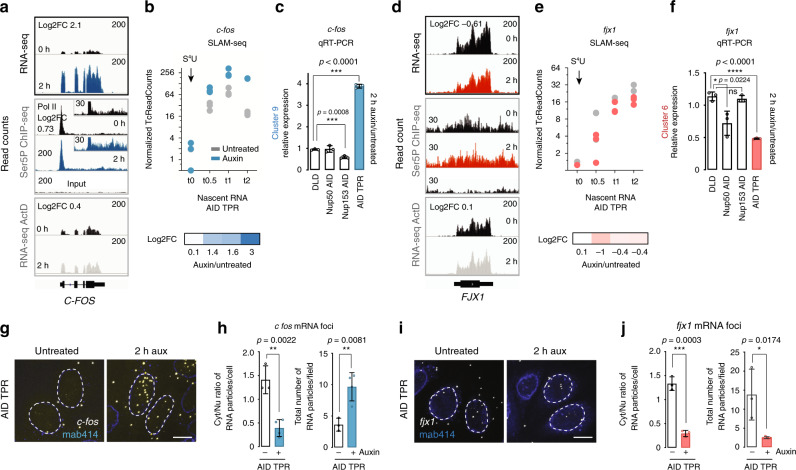
Nuclear pore complexes (NPCs) are important for cellular functions beyond nucleocytoplasmic trafficking, including genome organization and gene expression. This multi-faceted nature and the slow turnover of NPC components complicates investigations of how individual nucleoporins act in these diverse processes. To address this question, we apply an Auxin-Induced Degron (AID) system to distinguish roles of basket nucleoporins NUP153, NUP50 and TPR. Acute depletion of TPR causes rapid and pronounced changes in transcriptomic profiles. These changes are dissimilar to shifts observed after loss of NUP153 or NUP50, but closely related to changes caused by depletion of mRNA export receptor NXF1 or the GANP subunit of the TRanscription-EXport-2 (TREX-2) mRNA export complex. Moreover, TPR depletion disrupts association of TREX-2 subunits (GANP, PCID2, ENY2) to NPCs and results in abnormal RNA transcription and export. Our findings demonstrate a unique and pivotal role of TPR in gene expression through TREX-2- and/or NXF1-dependent mRNA turnover.


Conflict of interest statement

The authors declare no competing interests.

Figures

Fig. 1
Fig. 1. Stability of the assembled nuclear pore upon rapid loss of BSK-NUPs.
a Schematic of CRISPR/Cas9-based tagging of nucleoporin genes and subsequent degradation of the AID-fused proteins. Each AID cell line is biallelically tagged. b NUP98, NUP133, and RANBP2 localization is not altered upon loss of NUP153 or TPR (4 h of auxin treatment). AID-NG tagged NUP153 and TPR proteins are shown in green, antibody-stained NUPs in red. Data are representative of at least three independent experiments. c Heat maps of differential abundance of NUP153, NUP50, and TPR proteins in NPC-enriched nuclear extracts and total cell lysates of the indicated AID-tagged cells 2 h after auxin treatment using TMT-assisted and conventional (label-free) mass spectrometry. Green color indicates a decrease in protein abundance after auxin treatment, log2 scale. Data represent a repeat of one experiment. d Localization of BSK-NUPs in the absence or presence of TPR and NUP153 (4 h of auxin treatment). Plots show line scans of relative fluorescence intensity (RFU) for BSK-NUPs (AID-NG tagged NUPs are shown in green, antibody-stained NUPs in red) and DNA across the nucleus. DNA was counterstained with DAPI (gray). Note that NUP50 no longer localizes to the nuclear envelope (NE) in the absence of NUP153. Scale bar: 5 µm. Data are representative of at least three independent experiments. AID auxin-inducible degron, TMT tandem mass tag, FC fold change.
Fig. 2
Fig. 2. Loss of TPR leads to rapid changes in mRNA abundance.
a, b A scheme of the experiment and heatmaps of unsupervised k-means clustering of differentially expressed genes 2 h after auxin treatment of cells expressing corresponding AID-tagged proteins. DLD-1 parental DLD-1 cells treated with auxin. Three independent biological replicates were used to perform RNA-seq of the indicated cell lines. c A Venn diagram representing the number of RNAs that showed significant change (both upregulation and downregulation) upon NUP50 (blue), NUP153 (yellow), and TPR (green) loss. d A Venn diagram representing the overlaps among significantly regulated transcripts upon TPR, NXF1 (purple), or GANP (brown) depletion (p value <2.3e−117, hypergeometric distribution test). e Top GO terms (*Biological Process, HumanMine v5.1 2018) of differentially expressed (DE) RNAs upon loss of the indicated nucleoporins (c), NXF1, and GANP (d). All DE RNAs (c, d) are log2FC > 30%, adj. p value <0.05, Wald test. f A Venn diagram representing the overlaps between significantly upregulated or downregulated transcripts upon TPR, NXF1, or GANP loss. Note that most of the TPR/NXF1/GANP-dependent RNAs are downregulated. Neg. negative, Pos. positive, Reg. regulation, NA Nucleic Acid, GO Gene Ontology, FC fold change.
Fig. 3
Fig. 3. TPR is required for both GANP localization and efficient export of poly(A) RNA.
a The analysis of cytoplasmic–nuclear distribution of poly(A) RNA in AIDTPR cells using oligo(dT)-Quasar 670 probe 8 h after TPR degradation. Note that Poly(A) RNA accumulates in the nuclear speckles. Scale bar: 10 µm. b Quantification of cytoplasmic-to-nuclear (Cyt/Nu) Poly(A) RNA distribution. Biological triplicates from two independent experiments were used (**p value 0.0062, n = 16 untreated and n = 13 auxin-treated cells, unpaired two-tailed Student’s t test). Data are presented as mean values; error bars are SD. c A heat map of differential abundance of the indicated proteins in either NPC-enriched fractions or total lysates upon loss of GANP, TPR, or NXF1, analyzed by TMT-assisted mass spectrometry. Note that the loss of TPR results in diminished abundance of TREX-2 complex subunits (GANP and PCID2) to the NPC but does not affect their total protein amount. Data represent a repeat of one experiment. dg Targeting of GANP and NXF1 to the NPC. d, e GANP localization at the NE depends on TPR but not on NUP153 or NUP50, while NXF1 localization is not affected upon loss of either BSK-NUPs (see also Supplementary Fig. 7a). f, g GANP and NXF1 localization at the NE are independent of each other. Scale bar: 5 µm. All BSK-NUPs and NXF1 AID-tagged cell lines were treated with auxin for 2 h; GANP AID-tagged cell line was treated with auxin for 3 h. Data are representative of at least three independent experiments. MS mass spectrometry, IF immunofluorescence, FC fold change, NE nuclear envelope.
Fig. 4
Fig. 4. TPR is required for localization of TREX-2 complex at the NPC.
ac Both TPR and GANP are required for PCID2 and ENY2 localization at the NE. Localization of mCherry-PCID2 and mCherry-ENY2 in cells after acute loss of TPR (a), NUP153 (b), or GANP (c). (see also Supplementary Fig. 7b, c). Note the changes in NPC localization of PCID2 and ENY2 (yellow arrowheads). Scale bar is 7 µm. All BSK-NUPs and NXF1 AID-tagged cell lines were treated with auxin for 2 h; GANP AID-tagged cell line was treated with auxin for 3 h. Data are representative of three independent experiments. d A schematic representation of the TREX-2–NPC interaction.
Fig. 5
Fig. 5. TPR regulates transcription.
a A workflow of the SLAM-seq experiment. Untreated and 2 h auxin-treated DLD-1 AIDTPR cells were labeled with S4U for 0, 0.5, 1, or 2 h. 3′UTRs of purified and alkylated RNA was sequenced and T > C reads counts (marked with yellow) were analyzed by the DESeq2 (Supplementary Data 5). b Bar plots of the overall T > C conversion rates per UTR analyzed after Quant-Seq. Each bar plot represents an independent repeat of Quant-Seq experiment covering 19,495 genes. Note that conversion events of other nucleotides were not detectable per UTR (detailed information is provided in Source data file). c M-A plots representing changes in the abundance of newly synthesized transcripts after TPR loss. All significantly upregulated transcripts are marked in blue and downregulated transcripts in red (FDR-adjusted p value <0.1, Wald test). Top upregulated and downregulated genes are indicated. d, e Dynamics of gene transcription was analyzed for 10 upregulated (d) and 106 downregulated (e) TPR-dependent transcripts after 0, 0.5, 1, and 2 h after S4U pulse labeling. Three independent replicates were used to perform SLAM-seq. Data are represented as mean values of normalized log2 T > C counts that were centered to the mean and scaled to the standard deviation to obtain Z-score for each gene. Details of Z-score quantification are described in the “Methods” section. UTR untranslated region.
Fig. 6
Fig. 6. TPR controls both transcription and RNA export.
a, e IGV snapshots of RNA-seq, Ser5P Pol II ChIP-seq, and ActD RNA-seq results for two representative transcripts c-fos (blue) and fjx1 (red). Log2FC is shown separately for each experiment. We performed three and two independent biological replicates for RNA-seq and ChIP-seq experiments, respectively. b, e Top: Normalized T > C count plots for c-fos and fjx1 transcripts. Three independent replicates are shown on the plot. Bottom: Log2FC of T > C counts of auxin treated vs. untreated sample at each time point from three independent biological replicates (Supplementary Data 5). c, f qRT-PCR analysis of c-fos and fjx1 RNA abundance 2 h after TPR, NUP50, or NUP153 loss. Graphs show mean values of three technical replicates of one experiment, error bars are SD. Asterisks indicate p value *<0.1, ***<0.001, ****<0.0001 (unpaired two-tailed Student’s t test), ns non-significant (p > 0.05). Exact p values are indicated on the graphs and in Source data file. g, i RNA-FISH analysis of localization of c-fos and fjx1 transcripts after 2 h of TPR loss. Note that both c-fos and fjx1 transcripts were retained within the nucleus. Data are representative of two independent experiments. h, j Quantification of cytoplasmic to nucleus (Cyt/Nu) ratio and total number of mRNA foci after TPR loss. Data are presented as mean values, error bars are SD. Asterisks indicate p value *<0.1, **<0.01, ***<0.001 (unpaired two-tailed Student’s t test). Three independent fields from two independent experiments were used for c-fos (untreated cells, n = 51; auxin-treated cells, n = 69 for AID-TPR cell line) and fjx1 (untreated cells, n = 30, auxin-treated cells, n = 50) mRNA foci quantification. Exact p values are indicated on the graphs and in Source data file. FC fold change.

References

    1. Okamura M, Inose H, Masuda S. RNA export through the NPC in eukaryotes. Genes. 2015;6:124–149. - PMC - PubMed
    1. Delaleau M, Borden KL. Multiple export mechanisms for mRNAs. Cells. 2015;4:452–473. - PMC - PubMed
    1. Jensen TH, Patricio K, McCarthy T, Rosbash M. A block to mRNA nuclear export in S. cerevisiae leads to hyperadenylation of transcripts that accumulate at the site of transcription. Mol. Cell. 2001;7:887–898. - PubMed
    1. Schneider M, et al. The nuclear pore-associated TREX-2 complex employs mediator to regulate gene expression. Cell. 2015;162:1016–1028. - PMC - PubMed
    1. Jani D, et al. Functional and structural characterization of the mammalian TREX-2 complex that links transcription with nuclear messenger RNA export. Nucleic Acids Res. 2012;40:4562–4573. - PMC - PubMed

Publication types