. 2020 Sep 11;11(1):4541.
doi: 10.1038/s41467-020-18319-6.

Molecular interaction and inhibition of SARS-CoV-2 binding to the ACE2 receptor

Affiliations

Molecular interaction and inhibition of SARS-CoV-2 binding to the ACE2 receptor

Jinsung Yang et al. Nat Commun. .

Erratum in

Abstract

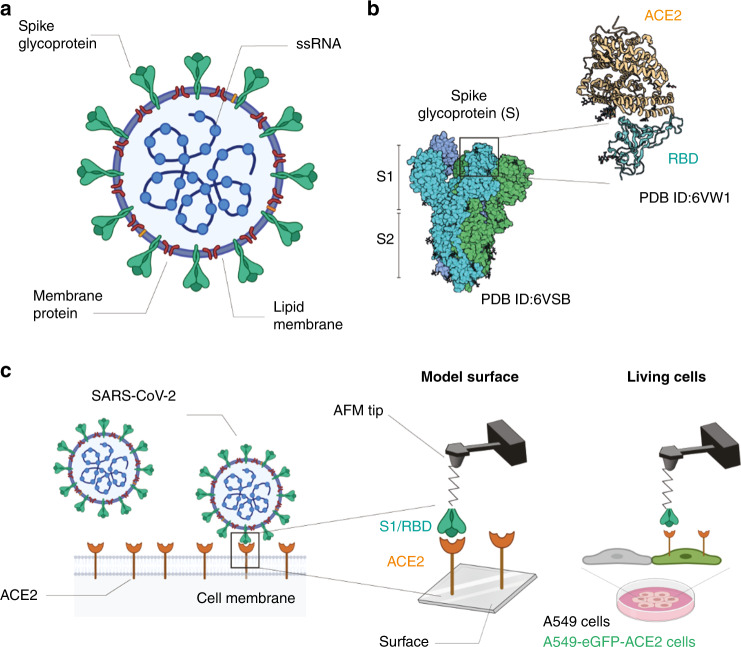
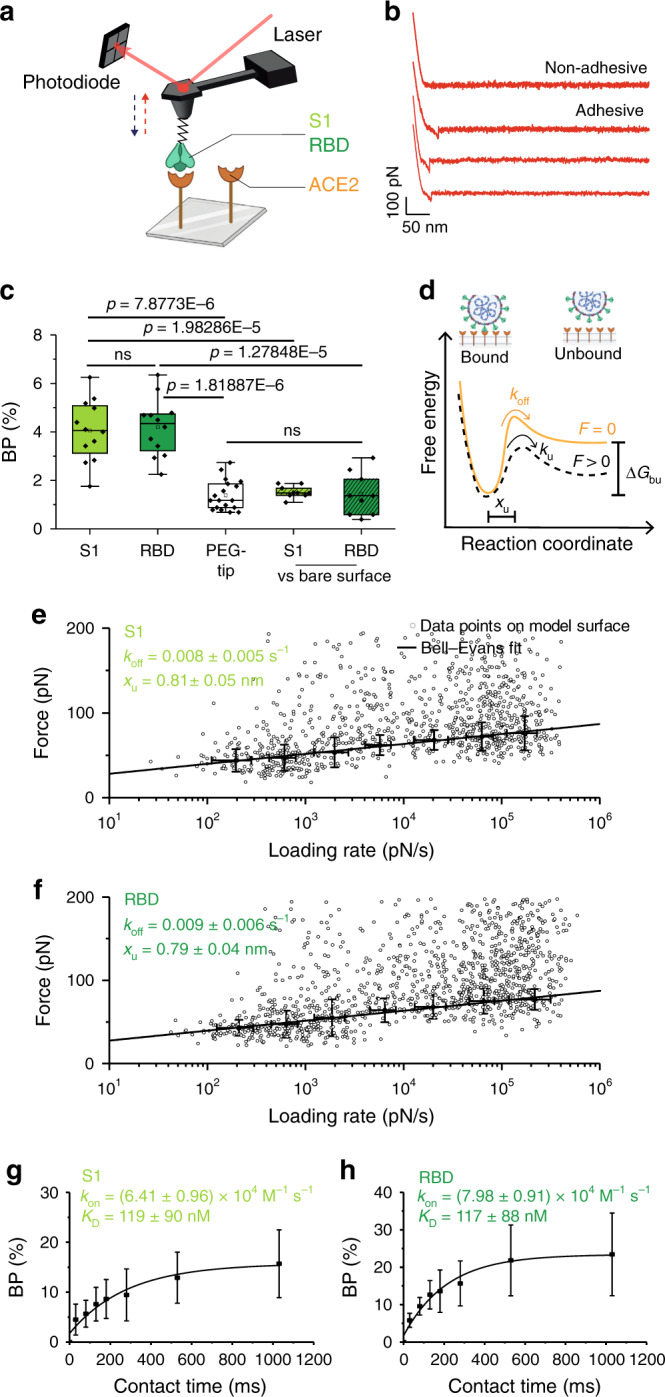
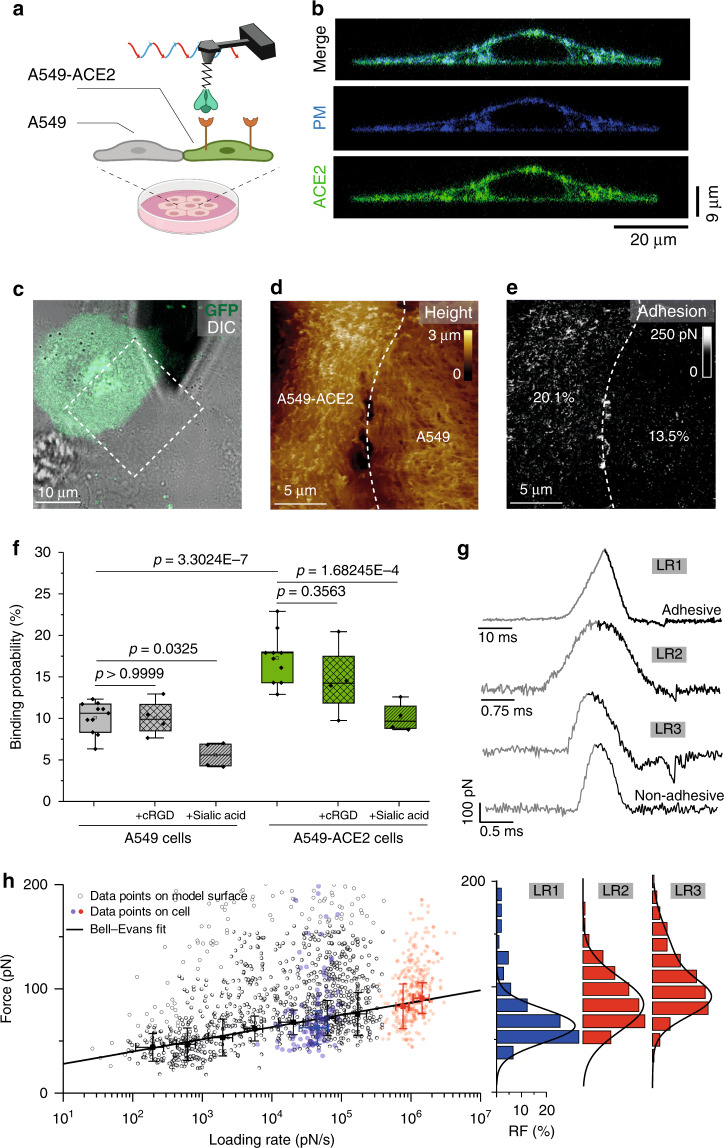
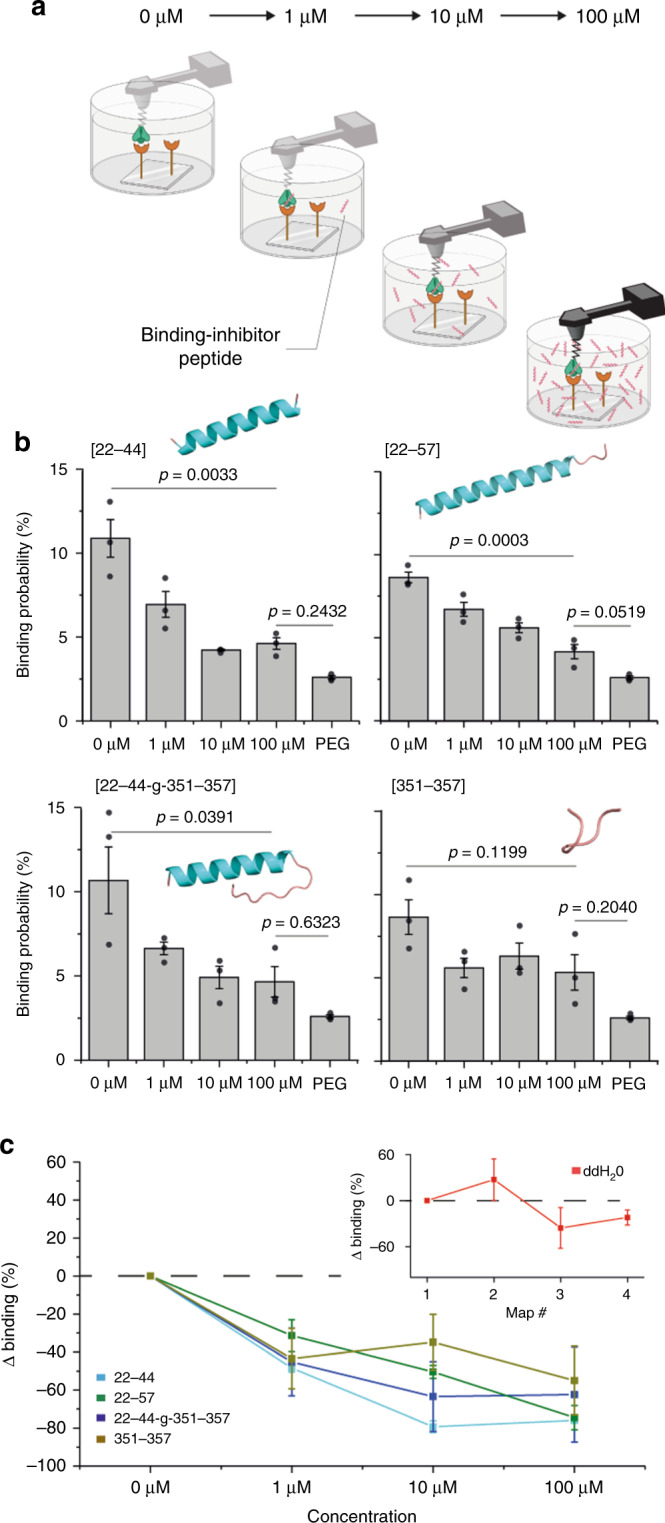
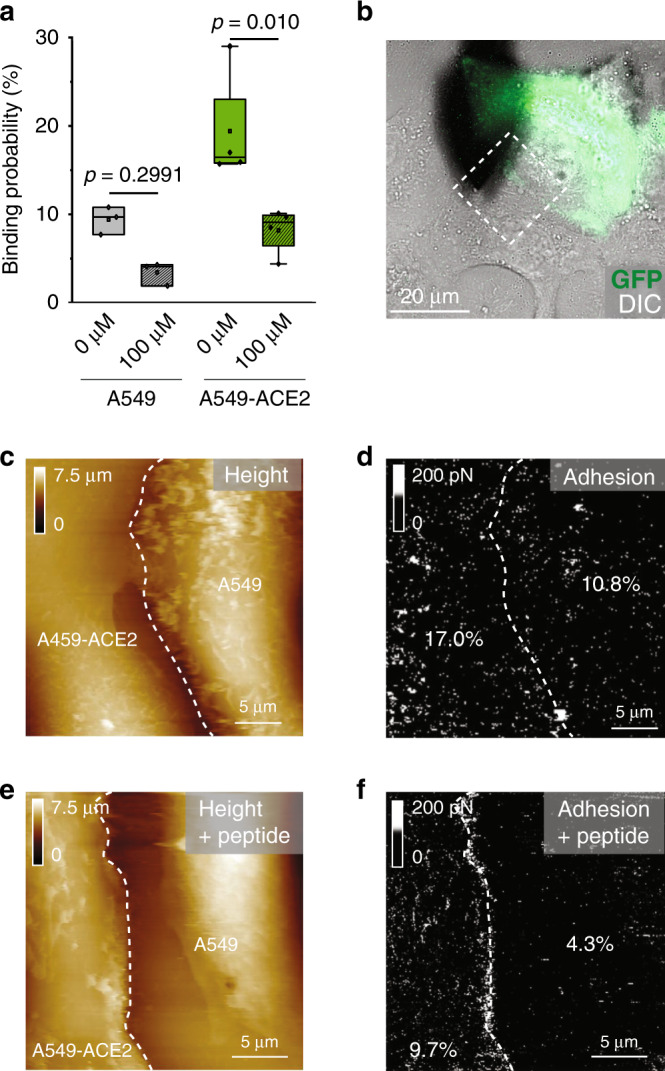
Study of the interactions established between the viral glycoproteins and their host receptors is of critical importance for a better understanding of virus entry into cells. The novel coronavirus SARS-CoV-2 entry into host cells is mediated by its spike glycoprotein (S-glycoprotein), and the angiotensin-converting enzyme 2 (ACE2) has been identified as a cellular receptor. Here, we use atomic force microscopy to investigate the mechanisms by which the S-glycoprotein binds to the ACE2 receptor. We demonstrate, both on model surfaces and on living cells, that the receptor binding domain (RBD) serves as the binding interface within the S-glycoprotein with the ACE2 receptor and extract the kinetic and thermodynamic properties of this binding pocket. Altogether, these results provide a picture of the established interaction on living cells. Finally, we test several binding inhibitor peptides targeting the virus early attachment stages, offering new perspectives in the treatment of the SARS-CoV-2 infection.


Conflict of interest statement

The authors declare no competing interests.

Figures

Fig. 1
Fig. 1. Probing SARS-CoV-2 binding to the ACE2 host receptor.
a Schematic of a SARS-CoV-2 particle, an enveloped ssRNA virus expressing at its surface the spike glycoprotein (S) that mediates the binding to host cells. b Structural studies have previously obtained a complex between the receptor-binding domain (RBD, a subunit of the S glycoprotein) and the angiotensin-converting enzyme 2 (ACE2) receptor. c Schematic of probing SARS-CoV-2 binding using atomic force microscopy (AFM). The initial attachment of SARS-CoV-2 to cells involves specific binding between the viral S glycoprotein and the cellular receptor, ACE2. The interactions are monitored by AFM on model surfaces, where the ACE2 receptor is attached to a surface and the S1 subunit or the RBD onto the AFM tip, and on A549 living cells expressing or not fluorescently labeled ACE2.
Fig. 2
Fig. 2. Probing S-glycoprotein binding to the ACE2 host receptor on model surface.
a Binding of S-glycoprotein subunit (S1 or RBD) is probed on an ACE2-coated surface. b Retraction part of four force–distance curves showing either nonadhesive or specific adhesive curves. c Box plot of specific binding probabilities (BP) measured by AFM between the functionalized tip (S1, RBD, or PEG) and the grafted surface (ACE2 or OH-/COOH-terminated alkanethiol (bare surface)). One data point belongs to the BP from one map acquired at 1 µm/s retraction speed. The square in the box indicates mean, the colored box indicates the 25th and 75th percentiles, and the whiskers indicate the highest and the lowest values of the results. The line in the box indicates median. N = 12 (S1, RBD), 18 (PEG), and 9 (S1, RBD vs. bare surface) maps examined over 4 (S1, RBD), 6 (PEG), and 3 (S1, RBD vs. bare surface) independent experiments. d Bell–Evans model describing a virus-receptor bond as a two-state model. The bound state is separated from the unbound state by a single energy barrier located at distance xu. koff and kon represent the dissociation and association rate, respectively. e, f Dynamic force spectroscopy (DFS) plot showing the distribution of the rupture forces as a function of their loading rate (LR) measured either between the S1 subunit and the ACE2 receptor (N = 1052 data points) (e) or between the RBD and the ACE2 receptor (N = 1490 data points) (f). The error bar indicates s.d. of the mean value for a single interaction (0–200 pN). The solid line represents the fit of the data with the Bell–Evans fit. Experiments were reproduced at least four times with independent tips and samples. g, h The BP is plotted as a function of the contact time for S1 subunit and RBD on ACE2 model surfaces, and data points were fitted using a least-squares fit of a monoexponential growth. One data point belongs to the BP from one map acquired at 1 µm/s retraction speed for the different contact times. Experiments were reproduced three times with independent tips and samples. P values were determined by two-sample t test in Origin. The error bar indicates s.d. of the mean value. Source data are provided as a Source Data file.
Fig. 3
Fig. 3. Probing S-glycoprotein binding to the ACE2 host receptor on living cells.
a Binding of S-glycoprotein subunit 1 (S1) is probed on A549 and A549–ACE2 cells. b Confocal microscopy (z stack) of A549–ACE2–eGFP (green) cell transduced with plasma membrane BFP (blue). c Overlay of eGFP and DIC images of a mixed culture of A549 and A549–ACE2–eGFP cells. d, e Force–distance (FD)-based AFM topography image (d) and the corresponding adhesion map (e) in the specified area in (c). The frequency of adhesion events is indicated. f Box plot of the binding probability between S1 and A549 cells (gray) or A549–ACE2 cells (green) without and after injection of cyclic RGD (cRGD, checked boxes) or sialic acid (SA, dashed boxes), respectively. The square in the box indicates mean, the colored box indicates the 25th and 75th percentiles, and the whiskers indicate the highest and the lowest values of the results. The line in the box indicates median. g Force versus time curves showing either a nonadhesive curve (bottom) or specific adhesive curves acquired at different LRs (LR1–LR3). h DFS plot showing the distribution or the rupture forces measured either between the S1 subunit and the ACE2 on model surfaces (black dots, extracted from Fig. 2e), and between the S1 subunit and ACE2-overexpressing A549 cells acquired at three different LRs (blue and red dots) (N = 403). Blue dots belong to a data set acquired in fast-force volume mode, with a retraction velocity of 20 µm s1 (LR1). Red dots belong to data sets acquired in peak force tapping mode with 0.125 kHz peak force frequency and 375-nm amplitude (LR2) or at 0.25 kHz and 750 nm (LR3), respectively. The error bar indicates s.d. of the mean value. Histograms of force distribution on A549–ACE2 cells for LR1–LR3 are shown on the side. For experiments without injection of cRGD or SA, data are representative of at least N = 11 cells from N = 6 independent experiments. The data for blocking experiments with cRGD or SA were acquired for at least N = 4 cells from N = 2 independent experiments. P values were determined by two-sample t test in Origin. Source data are provided as a Source Data file.
Fig. 4
Fig. 4. Anti-binding effects of ACE2-derived peptides on S1-subunit binding.
a Efficiency of blocking peptides is evaluated by measuring the binding probability of the interaction between the S1 subunit and ACE2 receptor on model surface before and after incubation of the functionalized AFM tip with the four different peptides at increasing concentration (1–100 µM). b Histograms, with the corresponding data points overlaid in dark gray, showing the binding probability without peptide (0 µM) and upon incubation with 1, 10, or 100 µM of ACE2-derived peptides ([22–44], [22–57], [22–44–g–351–357], and [351–357]). The binding probability measured with a polyethylene glycol (PEG) tip enables to evaluate the nonspecific binding level. The prediction of the structure of the ACE2-derived peptides is shown in the inset. The structure of the peptides is based on the structure of the peptide in the crystal structure (PDB ID: 6m0j). For the [22–44–g–351–357] peptide, its structure was generated using homology modeling. The error bar indicates s.d. of the mean value. c Graph showing the reduction of the binding probability. Control with ddH2O is provided in the inset showing that repetitive measurements do not result in a similar decrease of the binding probability. Data are representative of at least N = 3 independent experiments (tips and sample) per peptide concentration. P value was determined by two-sample t test in Origin. The error bar indicates s.d. of the mean value. Source data are provided as a Source Data file.
Fig. 5
Fig. 5. Blocking of S1-subunit binding using ACE2-derived peptide on living cells.
a Box plot showing that the reduction of binding probability measured the S1-subunit-derivatized tip and a mixed culture of A549 and A549–ACE2 cells upon injection of the [22–57] ACE2-derived peptide. The square in the box indicates mean, the colored box indicates the 25th and 75th percentiles, and the whiskers indicate the highest and the lowest values of the results. b Overlay of eGFP and DIC images of a mixed culture of A549 and A549–ACE2–eGFP cells. FD-based AFM topography images (c, e) and the corresponding adhesion map (d, f) recorded in the specified area in (b) (scanned with a scan angle) before (c, d) and after (e, f) incubation of the tip with the [22–57] ACE2-derived peptide. The frequency of adhesion events is indicated. Data are representative of at least N = 4 cells from N = 2 independent experiments. P values were determined by two-sample t test in Origin. Source data are provided as a Source Data file.

References

    1. Zhou P, et al. A pneumonia outbreak associated with a new coronavirus of probable bat origin. Nature. 2020;579:270–273. doi: 10.1038/s41586-020-2012-7. - DOI - PMC - PubMed
    1. Tortorici MA, Veesler D. Structural insights into coronavirus entry. Adv. Virus Res. 2019;105:93–116. doi: 10.1016/bs.aivir.2019.08.002. - DOI - PMC - PubMed
    1. Yan R, et al. Structural basis for the recognition of SARS-CoV-2 by full-length human ACE2. Science. 2020;367:1444. doi: 10.1126/science.abb2762. - DOI - PMC - PubMed
    1. Gallagher TM, Buchmeier MJ. Coronavirus spike proteins in viral entry and pathogenesis. Virology. 2001;279:371–374. doi: 10.1006/viro.2000.0757. - DOI - PMC - PubMed
    1. Simmons G, Zmora P, Gierer S, Heurich A, Pohlmann S. Proteolytic activation of the SARS-coronavirus spike protein: cutting enzymes at the cutting edge of antiviral research. Antivir. Res. 2013;100:605–614. doi: 10.1016/j.antiviral.2013.09.028. - DOI - PMC - PubMed

Publication types

MeSH terms