. 2020 Sep 11;11(1):4589.
doi: 10.1038/s41467-020-18146-9.

Loss of MTX2 causes mandibuloacral dysplasia and links mitochondrial dysfunction to altered nuclear morphology

Affiliations

Loss of MTX2 causes mandibuloacral dysplasia and links mitochondrial dysfunction to altered nuclear morphology

Sahar Elouej et al. Nat Commun. .

Erratum in

Abstract

Mandibuloacral dysplasia syndromes are mainly due to recessive LMNA or ZMPSTE24 mutations, with cardinal nuclear morphological abnormalities and dysfunction. We report five homozygous null mutations in MTX2, encoding Metaxin-2 (MTX2), an outer mitochondrial membrane protein, in patients presenting with a severe laminopathy-like mandibuloacral dysplasia characterized by growth retardation, bone resorption, arterial calcification, renal glomerulosclerosis and severe hypertension. Loss of MTX2 in patients' primary fibroblasts leads to loss of Metaxin-1 (MTX1) and mitochondrial dysfunction, including network fragmentation and oxidative phosphorylation impairment. Furthermore, patients' fibroblasts are resistant to induced apoptosis, leading to increased cell senescence and mitophagy and reduced proliferation. Interestingly, secondary nuclear morphological defects are observed in both MTX2-mutant fibroblasts and mtx-2-depleted C. elegans. We thus report the identification of a severe premature aging syndrome revealing an unsuspected link between mitochondrial composition and function and nuclear morphology, establishing a pathophysiological link with premature aging laminopathies and likely explaining common clinical features.


Conflict of interest statement

The authors declare no competing interests.

Figures

Fig. 1
Fig. 1. Patients’ clinical features and MTX2 mutations.
a Pictures and electropherograms of patient MADM1. At age 11 years, the girl showed severe growth retardation, mandibular recession, a pinched nose with hypoplastic alae nasi, long philtrum, prominent eyes, dental overcrowding, sparse eyebrows and body hair along with lipodystrophy and atrophic wrinkled skin. The homozygous c.2T>A (p.Met1Lys) MTX2 variant was identified and the heterozygous state of the parents confirmed the mode of inheritance as autosomal recessive. b Pictures and electropherograms of patient MADM2 at age 14 years, showing clinical features very similar to patient MADM1. The homozygous c.544-1G>C MTX2 splicing variant was confirmed by Sanger sequencing. c Pictures and electropherograms of patient MADM3 at age 2 years. He showed mandibular recession, prominent eyes, alopecia, long Stahl’s ears, and lipodystrophy. The homozygous c.208+3_208+6del MTX2 splicing variant was observed and confirmed by Sanger sequencing, and the carrier state of the parents was in accordance with autosomal recessive inheritance pattern. d Pictures of patients and family tree of the MADM4 consanguineous family. The homozygous MTX2 deletion c.603del (p.Tyr202Ilefs*26) was identified in three affected children (MADM4-1, MADM4-2, MADM4-3), all presenting with progeroid facies including high forehead, bulbous nose with depressed nasal bridge, prominent eyes, long philtrum, small mouth, small mandible, and long Stahl’s ears. Informed consent was obtained to publish patient images. See Supplementary Note 1, Supplementary Figs. 1, 2, and Supplementary Data File for additional clinical and radiological features.
Fig. 2
Fig. 2. MTX2 deficiency induces altered mitochondrial protein composition and increased mitochondrial fission.
a Immunoblot analysis of MTX2 and other outer and inner mitochondrial membrane proteins of whole-cell extracts from healthy control (WT) and patients’ (MADM2, MADM3) fibroblasts. Actin or REVERT total proteins were used as loading controls. n = 3 independent experiments for MTX2, TOMM22, SAMM50, CHCHD3 and n = 2 independent experiments for MTX1, VDAC2, TOMM40. b Representative confocal microscopy images showing mitochondria stained using DAPI (blue) and Mitotracker (red) from a control, patient MADM2, and patient MADM3. Boxed regions are enlarged. Scale bar: 10 µm. Data shown are representative of ten independent experiments. c Mitochondrial network analysis using the MINA ImageJ macro of healthy and patients’ fibroblasts showing significant differences in: mitochondrial footprint (exact p values: pMADM2 = 0.026, pMADM3 = 0.041), individuals (pMADM2 = 0.013, pMADM3 = 0.042), networks (pMADM2 = 7.31737E−05, pMADM3 = 0.041) and mean number of branches per network (pMADM2 = 0.005, pMADM3 = 0.043). 53 (WT), 46 (MADM2) and 51 (MADM3) cells from n = 5 independent experiments were blindly scored. Box plots show median (horizontal lines), first to third quartile (box), and the most extreme values within 1.5 times the interquartile range (vertical lines). Two-tailed unpaired t test; *p < 0.05, **p < 0.01, ***p < 0.001. d Immunoblot analysis of OPA1-L (protein optic atrophy 1, long) and OPA1-S (protein optic atrophy 1, short) (proteins involved in mitochondrial fusion, OPA1-S being issued from cleavage of OPA1-L) and DRP1 (protein involved in mitochondrial fission). Protein levels were quantified by ImageJ software and their expression levels were normalized to actin as an internal loading control. Results are expressed as mean ± SD, two-tailed unpaired t test was used to evaluate the statistical significance of differences among the groups (exact p values: OPA1-L: pMADM2 = 0.772, pMADM3 = 0.385; OPA1-S: pMADM2 = 0.10, pMADM3 = 0.10; DRP1: pMADM2 = 0.0015, pMADM3 = 0.042). *p < 0.05, **p < 0.01, ns not significant (n = 3 and n = 4 independent experiments respectively for OPA1 and DRP1). Source data are provided as a Source Data file.
Fig. 3
Fig. 3. Respiratory chain composition and function is impaired in MADaM fibroblasts.
a Representative western blots of respiratory chain proteins of complex I (NDUFS1, NDUFA9), complex II (SDHA), complex III (CORE I), complex IV (COX1, COX2), and complex V (ATP5B) in whole lysates from healthy control (WT), MADM2, MADM3, and HGPS fibroblasts. Protein levels were quantified by ImageJ software and their expression levels were normalized to REVERT total protein. b Quantitative analysis of western blots of respiratory chain proteins from complex I (NDUFS1, NDUFA9), complex II (SDHA), complex III (CORE I), complex IV (COX1, COX2), and complex V (ATP5B) from a healthy control (WT), MADM2, MADM3, and HGPS fibroblasts. Protein expression levels were normalized to Revert total protein using ImageJ software. Results are expressed as the mean, for ATP5B the mean ± SD is shown; n = 3 independent experiments for ATP5B and n = 2 independent experiments for all other proteins. One-way anova was performed comparing patients’ values to control (exact p values: NDUFS1: pMADM2 = 0.0034, pMADM3 = 0.002, pHGPS = 0.008; NDUFA9: pMADM2 = 0.041, pMADM3 = 0.025, pHGPS = 0.140; SDHA: pMADM2 = 0.954, pMADM3 = 0.89, pHGPS = 0.689; COREI: pMADM2 = 0.0188, pMADM3 = 0.0154, pHGPS = 0.011; COX1: pMADM2 = 0.0014, pMADM3 = 0.0011, pHGPS = 0.0012; COX2: pMADM2 = 0.1129, pMADM3 = 0.074, pHGPS = 0.0257; ATP5B: pMADM2 = 0.0035, pMADM3 = 0.0034, pHGPS = 0.0016) (p values: *p < 0,05, **p < 0.01, ns not significant. c Basal (R), oligomycin (O), and FCCP (F) respirations were studied in healthy (WT) and MADM2 and MADM3 fibroblast cell lines at passage P8. Respiratory ratios, including RCR (O/F) and RCRp (R-O/F) are also expressed for the respiration measured at 48 h. Data are expressed as mean ± SD of n = 4 independent experiments; statistical significance was analyzed using two-tailed Mann–Whitney test, 95% CI; *p = 0.015 in all cases. d The graph (left panel) shows quantification of tetramethylrhodamine methyl ester (TMRM, 50 nM) mean fluorescence intensity (MFI) signal measured by FACS analysis (right panel) in control (WT) and MADM2 and MADM3 fibroblasts. The counts shown in the right panel indicate the number of mitochondria quantified in this study, obtained from n = 3 independent experiments. Data are expressed as mean ± SD; statistical significance was analyzed using two-tailed unpaired Student’s t test, 95% CI; *pMADM2 = 0.015. FACS sequential gating/sorting strategies are provided in Supplementary Fig. 12 and source data are provided as a Source Data file.
Fig. 4
Fig. 4. MADaM fibroblasts resist to apoptosis induction and show increased LC3C-dependent mitophagy.
a Control, MADM2 and MADM3 fibroblasts were treated with 100 ng of TNFα and 10 ng of cycloheximide (CHX) for 18 h. Cell death was determined using trypan blue assay. The percentage of dead cells upon drug exposure is shown and error bars represent the SD; n = 3 independent experiments. Two-tailed unpaired t test was used to evaluate the statistical significance of differences among the groups (exact p values: pMADM2 = 4.03712E−05, pMADM3 = 2.12719E-07); ***p < 0.001. b Control, MADM2 and MADM3 fibroblasts were treated with 1 µM of staurosporine for 24 h. Cell death was determined using trypan blue essay. The percentage of dead cells upon drug exposure is shown and error bars represent the SD; n = 3 independent experiments. Two-tailed unpaired t test was used to evaluate the statistical significance of differences among the groups (exact p values: pMADM2 = 3.70103E−07, pMADM3 = 0.0004); ***p < 0.001. c Fibroblasts were treated with 1 µM of Staurosporine for 6 h and caspase cleavage was determined by western blot. REVERT total protein was used as loading control. One experiment was performed per condition. d Immunoblot of LC3B-I and LC3B-II expression in fibroblasts of patients (MADM2 and MADM3) and a control (WT). Protein levels were quantified by ImageJ software and their expression levels were normalized to actin. e Quantitative analysis of LC3B-II/ LC3B-I ratio from immunoblots. Protein levels were quantified by ImageJ software and their expression levels were normalized to actin values. Graph bars show the mean ± SD from n = 3 independent experiments. Two-tailed unpaired t test was used (exact p values: pMADM2 = 0.0002, pMADM3 = 0.026); *p < 0.05, ***p < 0.001. f, g Indirect immunofluorescence staining of LC3C, LAMP2 (green), Mitotracker (red), and DAPI (blue) in patients’ (MADM2 and MADM3) and control fibroblasts. Cytoplasmic colocalization of LC3C and LAMP2 with mitochondria can be seen in patients’ cells (arrows). n = 2 independent experiments were performed for LAMP2 and LC3C staining. Scale bar, 10 µm. Source data are provided as a Source Data file.
Fig. 5
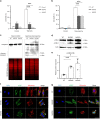
Fig. 5. MTX2 deficiency induces similar nuclear defects in patients’ fibroblasts and C. elegans cells.
a Proliferation rates were analyzed by the determination of doubling times in hours (n = 12 independent experiments). Results are expressed as mean ± SD. Statistical significance was analyzed using two-tailed Mann–Whitney test (95% CI); ***p < 0.001 (exact p values: pMADM2 = 7.39E−07; pMADM3 = 1.47E−06). b Senescence levels were assessed by SA-β-galactosidase quantification on n = 225 (WT), 183 (MADM2), 168 (MADM3) and 171 (HGPS) cells at the same passage number from one experiment. Scale bar, 25 µm. c Fluorescence images of nuclei labeled by DAPI staining, showing nuclear morphological abnormalities. Scale bar, 50 µm. d Quantification of cells with abnormal nuclear morphology. The average percentage mean values of normal and abnormal nuclei was calculated as described; n = 150 independent cells for each cell line at the same passage number were counted from n = 3 independent experiment. Chi-square test was used (exact p values: pMADM2 = 3.16E−13, pMADM3 = 1E−15, pHGPS = 1E−15); ***p < 0.001. e A representative western blot of fibroblasts’ whole lysates showing Lamin A/C, progerin vs. actin expression in control (WT), MADM2, MADM3, and HGPS from one experiment. f Immunofluorescence staining of Lamin A/C (green), Mitotracker (red), and DAPI (blue) in patients’ and control fibroblasts showing nuclear blebbing and aberrant folding with altered Lamin A/C staining. The images are representative of n = 3 independent experiments. Scale bar, 10 µm. g mtx-2 downregulation by siRNA causes nuclear aggregates in C. elegans. Wild-type C. elegans expressing lmn-1:gfp (Ce-lamin-GFP) were transfected with either mtx-2 RNAi or empty vectors (EV). Representative images of Ce-lamin-GFP nuclear aggregates monitored at days 2, 5, and 7 after transfection. Scale bar, 10 µm. h Graphical representation of the number of nuclear aggregates in aging animals transfected with either empty vector (EV) or mtx-2 siRNA (mtx-2); Y axis: percent of nuclei in each of three categories (class I: 0 aggregates, class II: 1–5 aggregates, class III: >5 aggregates), X axis: day of adulthood (2, 5, 7) upon transfection; (n = 145–148 nuclei were counted from ten independent animals for each condition; average: 14,6 nuclei per worm, cf. Source Data File). Fisher’s exact test p values: ***pday2 = 1.14E−04, ***pday5 = 1.00E−08, **pday7 = 0.00242572; *p < 0.05, **p < 0.01, ***p < 0.001). i Representative images of the different mitochondrial morphologies observed, subdivided in normal and abnormal as described. Lower panels: magnification of the region surrounded by a rectangle in the upper panels. Scale bar: 5 µm. j quantification of mitochondrial morphologies in mitogfp strain (n = 17 biologically independent animals) and mtx-2 KO; mitogfp strain (n = 68 biologically independent animals). The data are representative of two independent experiments. Source data are provided as a Source Data file.
Fig. 6
Fig. 6. MTX2 overexpression by cDNA transfection rescues pathological phenotypes.
a Western blots were performed 24 and 48 h post MTX2-cDNA transfection in MADM2 and MADM3 patients’ fibroblasts (NT nontransfected, T transfected). The data are representative of one experiment. b Immunofluorescence staining of MTX2 (green), Mitotracker (red), and DAPI (blue) in control fibroblasts showing colocalization of MTX2 with mitochondria. The data are representative of one experiment. Scale bar, 10 µm. c Immunofluorescence staining of MTX2 (green) and Mitotracker (red) 48 h post MTX2-cDNA transfection in MADM2 and MADM3 patients’ fibroblasts (PT post transfection). Colocalization of overexpressed MTX2 with mitochondria is shown (arrows in the zoomed images). The data shown are representative of one experiment. Scale bar, 10 µm. d Mitochondrial network analysis using the MINA toolset on healthy and MADM2 and MADM3 patients’ fibroblasts before and after MTX2-cDNA transfection showing improved mitochondrial footprint, individuals, networks, and branches per network for all parameters in PT conditions, when compared either to the patient’s nontransfected cells or to control cells. Box plots show median (horizontal lines), first to third quartile (box), and the most extreme values within 1.5 times the interquartile range (vertical lines). Outliers are shown as well. n = 29 (WT), 27 (MADM2), 27 (MADM2-PT), 28 (MADM3), and 25 (MADM3-PT) cells from one experiment were blindly scored. Differences between control and patients were analyzed by Kruskal–Wallis test with multiple-comparison and exact p values are indicated in the figure. *p < 0.05, **p < 0.01, ***p < 0.001, ns not significant. Source data are provided as a Source Data file.

References

    1. Novelli G, et al. Mandibuloacral dysplasia is caused by a mutation in LMNA-encoding lamin A/C. Am. J. Hum. Genet. 2002;71:426–431. - PMC - PubMed
    1. Agarwal AK, Fryns JP, Auchus RJ, Garg A. Zinc metalloproteinase, ZMPSTE24, is mutated in mandibuloacral dysplasia. Hum. Mol. Genet. 2003;12:1995–2001. - PubMed
    1. Puente XS, et al. Exome sequencing and functional analysis identifies BANF1 mutation as the cause of a hereditary progeroid syndrome. Am. J. Hum. Genet. 2011;88:650–656. - PMC - PubMed
    1. Weedon MN, et al. An in-frame deletion at the polymerase active site of POLD1 causes a multisystem disorder with lipodystrophy. Nat. Genet. 2013;45:947–950. - PMC - PubMed
    1. Lessel D, et al. POLD1 germline mutations in patients initially diagnosed with Werner syndrome. Hum. Mutat. 2015;36:1070–1079. - PMC - PubMed

Publication types

MeSH terms

Supplementary concepts