

Compositional and functional differences of the mucosal microbiota along the intestine of healthy individuals
- PMID: 32917913
- PMCID: PMC7486370
- DOI: 10.1038/s41598-020-71939-2
Compositional and functional differences of the mucosal microbiota along the intestine of healthy individuals
Abstract
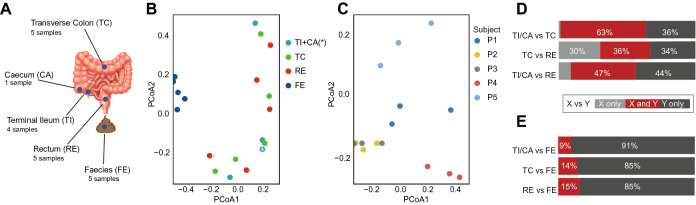
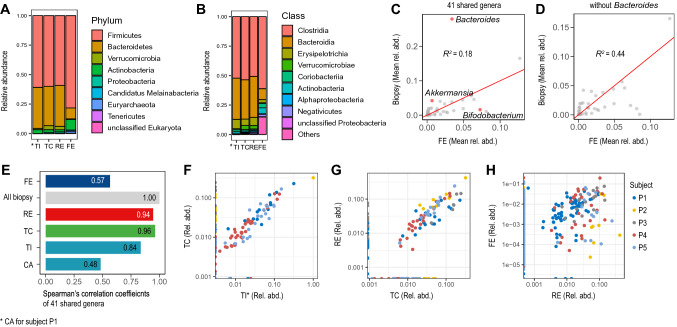
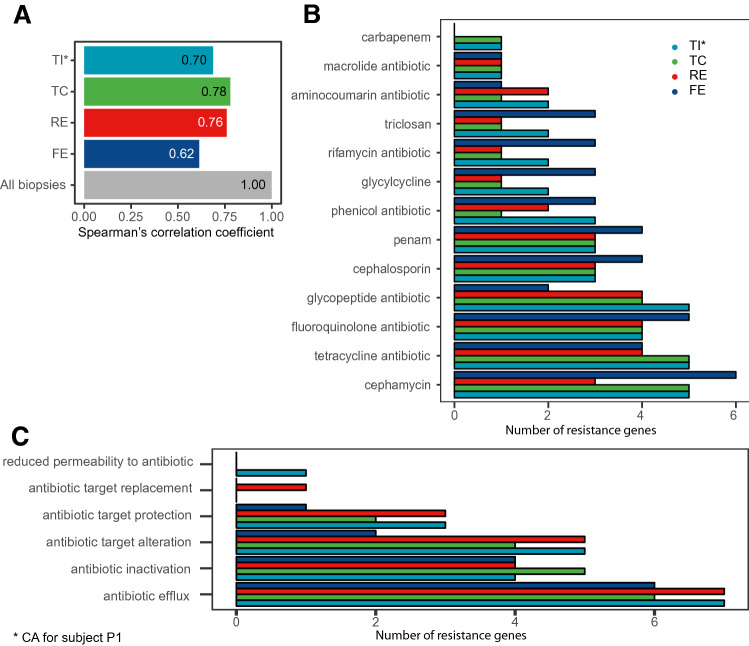
Gut mucosal microbes evolved closest to the host, developing specialized local communities. There is, however, insufficient knowledge of these communities as most studies have employed sequencing technologies to investigate faecal microbiota only. This work used shotgun metagenomics of mucosal biopsies to explore the microbial communities' compositions of terminal ileum and large intestine in 5 healthy individuals. Functional annotations and genome-scale metabolic modelling of selected species were then employed to identify local functional enrichments. While faecal metagenomics provided a good approximation of the average gut mucosal microbiome composition, mucosal biopsies allowed detecting the subtle variations of local microbial communities. Given their significant enrichment in the mucosal microbiota, we highlight the roles of Bacteroides species and describe the antimicrobial resistance biogeography along the intestine. We also detail which species, at which locations, are involved with the tryptophan/indole pathway, whose malfunctioning has been linked to pathologies including inflammatory bowel disease. Our study thus provides invaluable resources for investigating mechanisms connecting gut microbiota and host pathophysiology.
Conflict of interest statement
N.J.T. reports personal fees from Allergans PLC (GI Development Programs) , personal fees from Viscera Labs (IBS), personal fees from IM Health Sciences (FD), personal fees from Napo Pharmaceutical (IBS), personal fees from Outpost Medicine (IBS), from ProgenityInc San Diego (capsule SIBO), from Allakos (gastric eosinophilic disease), personal fees from Samsung Bioepis (IBD), personal fees from Synergy (IBS), personal fees from Takeda (gastroparesis), personal fees from Theravance (gastroparesis), grants and personal fees from Viscera USA (IBS), grants from Commonwealth Diagnostics (International) Inc (IBS), non-financial support from HVN National Science Challenge NZ (IBS), grants and personal fees from GI therapies (constipation), personal fees from Cadila Pharmaceuticals (CME), personal fees from Planet Innovation (Gas capsule), personal fees from Danone (Probiotic), personal fees from Pfizer (IBS), from Dr. Reddy's Laboratories (Webinar), personal fees from Arlyx (IBS), personal fees from Sanofi (Probiotic), outside the submitted work; In addition, Dr. Talley has a patent Biomarkers of IBS licensed, a patent Licensing Questionnaires Talley Bowel Disease Questionnaires licensed to Mayo/Talley, a patent Nestec European Patent licensed, a patent Singapore Provisional Patent “Microbiota Modulation Of BDNF Tissue Repair Pathway” issued, and a patent Nepean Dyspepsia Index licensed to Talley copyright and Committees: Australian Medical Council (AMC) [Council Member]; Australian Telehealth Integration Programme; MBS Review Taskforce; NHMRC Principal Committee (Research Committee) Asia Pacific Association of Medical Journal Editors. Boards: GESA Board Member, Sax Institute, Committees of the Presidents of Medical Colleges. Community group: Advisory Board, IFFGD (International Foundation for Functional GI Disorders). Miscellaneous: Avant Foundation (judging of research grants). Editorial: Medical Journal of Australia (Editor in Chief), Up to Date (Section Editor), Precision and Future Medicine, Sungkyunkwan University School of Medicine, South Korea. All the other authors have no conflict of interests to declare.
Figures

References
Publication types
MeSH terms
Grants and funding
LinkOut - more resources
Full Text Sources
Medical
