. 2020 Sep 11;10(1):14970.
doi: 10.1038/s41598-020-71804-2.

Genetic variation regulates opioid-induced respiratory depression in mice

Affiliations

Genetic variation regulates opioid-induced respiratory depression in mice

Jason A Bubier et al. Sci Rep. .

Abstract

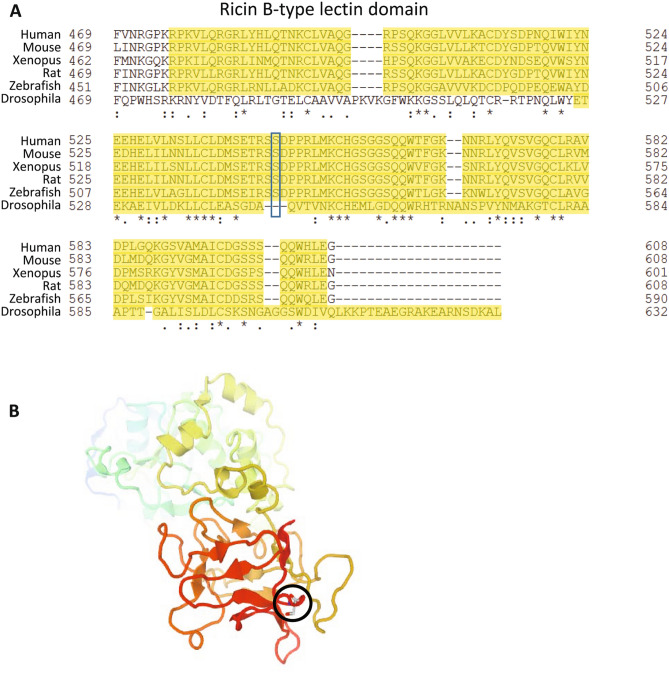
In the U.S., opioid prescription for treatment of pain nearly quadrupled from 1999 to 2014. The diversion and misuse of prescription opioids along with increased use of drugs like heroin and fentanyl, has led to an epidemic in addiction and overdose deaths. The most common cause of opioid overdose and death is opioid-induced respiratory depression (OIRD), a life-threatening depression in respiratory rate thought to be caused by stimulation of opioid receptors in the inspiratory-generating regions of the brain. Studies in mice have revealed that variation in opiate lethality is associated with strain differences, suggesting that sensitivity to OIRD is genetically determined. We first tested the hypothesis that genetic variation in inbred strains of mice influences the innate variability in opioid-induced responses in respiratory depression, recovery time and survival time. Using the founders of the advanced, high-diversity mouse population, the Diversity Outbred (DO), we found substantial sex and genetic effects on respiratory sensitivity and opiate lethality. We used DO mice treated with morphine to map quantitative trait loci for respiratory depression, recovery time and survival time. Trait mapping and integrative functional genomic analysis in GeneWeaver has allowed us to implicate Galnt11, an N-acetylgalactosaminyltransferase, as a gene that regulates OIRD.


Conflict of interest statement

B.F.O. and K.D.D. are co-founders and co-owners of Signal Solutions that manufactures and sells the Piezoelectric technology utilized in this study.

Figures

Figure 1
Figure 1
Simultaneous piezoelectric floor sensor and plethysmography signals are compared for extracting mean respiration rates over short-time intervals. (A) Example of low activity, sleep-like segment with piezoelectric signal generated from thorax motion with a strict correspondence to the changing air pressure driving the plethysmography signal. (B) Example of moderate body motion signal (head motion, slow walking) reducing the dominance from the thorax motion on the piezoelectric sensor.
Figure 2
Figure 2
PiezoSleep output for a mouse that recovers and a mouse that fails to recover after opioid treatment. Baseline respiratory rate is first established for 24 h. Time 0, is the time at which morphine is administered. The blue line represents the derived respiratory rate trajectories relative to the baseline [defined as the average respiratory rate over the first 24 h (set at 100%)]. Respiratory depression is defined as the lowest percentage of baseline reached after morphine treatment (purple dotted arrow). For a mouse that recovers, the green vertical arrow indicates recovery time when the respiratory rate returns to baseline. For a mouse that does not recover, the red vertical arrow indicates survival time when breathing stops (i.e., piezo output becomes machine noise never returning to baseline).
Figure 3
Figure 3
Strain- and sex-specific effect of morphine on respiratory sensitivity. Respiratory depression (top left panel), recovery time (middle left panel) and survival time (bottom left panel) were determined using the probe dose of 436 mg/kg and the PiezoSleep system. The traits of recovery time or survival time are censored such that a mouse does not appear in both graphs as each mouse displays only one of these two phenotypes. Empty bars indicate that no mice fell into this category (i.e., either all recovered, or none recovered). Scatterplot of percent respiratory depression vs recovery time (top right panel) showing a weak correlation of R2 of 0.08; and a scatterplot of percent respiratory depression vs survival time (bottom right panel) showing no significant correlation. Microsoft 365 https://www.microsoft.com/en-us/microsoft-365?rtc=1 and JMP 15.0.0 https://www.jmp.com.
Figure 4
Figure 4
The morphine LD50 by strain and sex. The morphine LD50 was determined for each of the eight founder strains and sex using at least six mice in each group and at least three doses of morphine, with at least two doses flanking the LD50. (A) Logistic 2-paramater survival curves separated by strain and sex are shown at the top and composites of all strains separated by sex are shown at the bottom. (B) The LD50 as calculated using the drc package in R and ranged from 212 to 882 mg/kg. JMP 15.0.0 https://www.jmp.com.
Figure 5
Figure 5
Respiratory response to morphine in Diversity Outbred mice. DO mice were given 486 mg/kg dose of morphine and the respiratory responses were determined by the Piezo Sleep system. The distribution of respiratory responses is shown for respiratory depression (top panel), recovery time (middle panel) and survival time (bottom panel). R/qtl2 https://kbroman.org/qtl2/.
Figure 6
Figure 6
QTL mapping of respiratory depression in DO mice. (A) Genome wide scan for QTL regulating the phenotype of respiratory depression in 300 DO mice. (B) Allele effect plot of the LOD 9.2 QTL on chromosome 5 for respiratory depression showing a strong narrow peak with LOD confidence interval of 24.98–26.16 MBp. (C) A 2MBp interval around the peak locus on chromosome 5 showing the SNPs driving the QTL as well as the genomic features within the interval on chromosome 5. R/qtl2 https://kbroman.org/qtl2/.
Figure 7
Figure 7
Protein sequence alignment between WSB/EiJ (WSB) and NOD/ShiLtJ (NOD) mice isoforms of GALNT11. The translated GALTNT11 protein sequence encoded by QTL driving alleles WSB and NOD demonstrate sequence homology except for S545L (red circle). Yellow = C (capable of disulfide bonding), Green = A, I, L, M, G, P, V (Hydrophobic) Dark Blue = D, E (Negative Charge) , Dark Green = H, W, Y, F (Aromatic/Hydrophobic) Magenta = R, K (Positive Charge) light blue/purple = T, S, Q, N (Polar) Clustal Omega https://www.clustal.org/omega/.
Figure 8
Figure 8
S545L occurs in the Ricin B lectin domain of GALNT11. (A) Multi-species alignment of the Ricin B lectin domain of GALNT11 showing that the S545L mutation occurs in a domain conserved across multiple vertebrates, including humans, mice, rats, Xenopus, and zebrafish. (B) Protein domain map of human GALNT11 showing the localization of the conserved S545L in the Ricin B lectin domain (black circle). The 3D structure rendered showing secondary structure as a cartoon type with coloring as a rainbow from N- to C-terminus. Clustal Omega https://www.clustal.org/omega/ Jmol https://jmol.sourceforge.net/.

References

    1. Boscarino JA, et al. Risk factors for drug dependence among out-patients on opioid therapy in a large US health-care system. Addiction. 2010;105:1776–1782. - PubMed
    1. Cicero TJ, Kasper ZA, Ellis MS. Increased use of heroin as an initiating opioid of abuse: Further considerations and policy implications. Addict. Behav. 2018;87:267–271. - PubMed
    1. Schmid CL, et al. Bias factor and therapeutic window correlate to predict safer opioid analgesics. Cell. 2017;171:1165–1175.e13. - PMC - PubMed
    1. Tomassoni AJ, et al. Multiple fentanyl overdoses—New Haven, Connecticut, June 23, 2016. Morb. Mortal. Wkly. Rep. 2017;66:107–111. - PMC - PubMed
    1. Comer SD, Cahill CM. Fentanyl: Receptor pharmacology, abuse potential, and implications for treatment. Neurosci. Biobehav. Rev. 2019;106:49–57. - PMC - PubMed

Publication types