. 2021 Jan;15(1):41-54.
doi: 10.1038/s41396-020-00752-6. Epub 2020 Sep 11.

A single-cell polony method reveals low levels of infected Prochlorococcus in oligotrophic waters despite high cyanophage abundances

Affiliations

A single-cell polony method reveals low levels of infected Prochlorococcus in oligotrophic waters despite high cyanophage abundances

Noor Mruwat et al. ISME J. 2021 Jan.

Abstract

Long-term stability of picocyanobacteria in the open oceans is maintained by a balance between synchronous division and death on daily timescales. Viruses are considered a major source of microbial mortality, however, current methods to measure infection have significant methodological limitations. Here we describe a method that pairs flow-cytometric sorting with a PCR-based polony technique to simultaneously screen thousands of taxonomically resolved individual cells for intracellular virus DNA, enabling sensitive, high-throughput, and direct quantification of infection by different virus lineages. Under controlled conditions with picocyanobacteria-cyanophage models, the method detected infection throughout the lytic cycle and discriminated between varying infection levels. In North Pacific subtropical surface waters, the method revealed that only a small percentage of Prochlorococcus (0.35-1.6%) were infected, predominantly by T4-like cyanophages, and that infection oscillated 2-fold in phase with the diel cycle. This corresponds to 0.35-4.8% of Prochlorococcus mortality daily. Cyanophages were 2-4-fold more abundant than Prochlorococcus, indicating that most encounters did not result in infection and suggesting infection is mitigated via host resistance, reduced phage infectivity and inefficient adsorption. This method will enable quantification of infection for key microbial taxa across oceanic regimes and will help determine the extent that viruses shape microbial communities and ecosystem level processes.


Conflict of interest statement

The authors declare that they have no conflict of interest.

Figures

Fig. 1
Fig. 1. iPolony: a polony method for quantifying virally infected cyanobacteria.
a First, Prochlorococcus and Synechococcus are sorted based on size and their autofluorescence properties using a flow cytometer from fixed samples. b Then, thousands of sorted cells per slide are screened for the presence of intracellular viral DNA using a solid-phase PCR polony method. Percent infection is determined based on the fraction of input cells that resulted in polonies at the end of the analysis.
Fig. 2
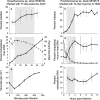
Fig. 2. The iPolony method detects viral infection throughout the infection cycle.
Cultures of Synechococcus sp. strain WH8109 infected by the T7-like cyanopodovirus, Syn5 (a, c, e) and Prochlorococcus sp. strain MIT9515 infected by the T4-like cyanomyovirus, S-TIM4 (b, d, f) at MOI = 3. a, b Percent infection was determined using the polony method over the infection cycle. c, d Virus DNA replication (solid lines) and host genomic DNA degradation (dashed lines) were assessed by qPCR in infected cultures. Host and virus DNA concentrations were normalized to initial or maximum concentrations, respectively. Shaded regions indicate the period of virus genome replication. Lysis was assessed from an increase in plaque forming units measured by the plaque assay for Syn5 (e) or the appearance of extracellular virus DNA measured by qPCR for S-TIM4 (f). Note that Syn5 infections shown in (c) and (e) were not synchronized at 5 min post infection as in (a) and are shown for comparison of the timing of different phases of infection. Average and standard deviation of biological triplicates are shown in all panels.
Fig. 3
Fig. 3. The iPolony method quantifies infection across a wide range of infection values.
Synechococcus WH8109 was infected by the T7-like cyanophage, Syn5, at different MOIs to test the ability of the polony method to detect differences in percent infection compared to a the MOI in each experiment and to b a culture-based assay for percent infection [37]. Trend lines represent significant linear regressions between percent infection using the iPolony method and MOI values (F = 143.1, R2 = 0.87, p < 0.001) or percent infection based on the lysis-based assay (F = 55.60, R2 = 0.70, p < 0.001).
Fig. 4
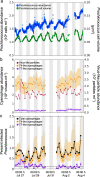
Fig. 4. Diel dynamics of Prochlorococcus and cyanophages in the North Pacific Subtropical Gyre in 2015.
Shaded regions indicate nighttime hours. a Abundances (blue) and cell volume (green) of Prochlorococcus following a Lagrangian water mass in the upper mixed layer. b Abundances of virus-like particles (red), T4-like (orange), and T7-like (purple) cyanophages. Shaded regions indicate the 95% confidence intervals of cyanophage abundance measurements. c Percent of virally infected Prochlorococcus by T4-like cyanomyoviruses (orange), T7-like cyanopodoviruses (purple), and total cyanophage (black) determined with the iPolony method. Shaded regions indicate bounds of infection assuming infection was entirely synchronous, and cells were either in the late stages of infection (lower bound) or in the early stages of infection (upper bound). Dashed lines indicate the limits of accurate detection for cyanophage infection. Prochlorococcus cell size, abundance and cyanophage infection all had statistically significant diel periodicity (RAIN rhythmicity test, p-values < 0.001), whereas VLP, T7-like, and T4-like cyanophage abundances were not periodic (RAIN rhythmicity test, p-value = 0.62, 0.42, 0.40 for VLP, T7-like, and T4-like cyanophage, respectively).

References

    1. Zwirglmaier K, Jardillier L, Ostrowski M, Mazard S, Garczarek L, Vaulot D, et al. Global phylogeography of marine Synechococcus and Prochlorococcus reveals a distinct partitioning of lineages among oceanic biomes. Environ Microbiol. 2008;10:147–61. - PubMed
    1. Malmstrom RR, Coe A, Kettler GC, Martiny AC, Frias-Lopez J, Zinser ER, et al. Temporal dynamics of Prochlorococcus ecotypes in the Atlantic and Pacific oceans. ISME J. 2010;4:1252–64. - PubMed
    1. Rii YM, Karl DM, Church MJ. Temporal and vertical variability in picophytoplankton primary productivity in the North Pacific Subtropical Gyre. Mar Ecol Prog Ser. 2016;562:1–18.
    1. Liu H, Nolla HA, Campbell L. Prochlorococcus growth rate and contribution to primary production in the equatorial and subtropical North Pacific Ocean. Aquat Micro Ecol. 1997;12:39–47.
    1. Vaulot D, Marie D, Olson RJ, Chisholm SW. Growth of Prochlorococcus, a photosynthetic prokaryote, in the Equatorial Pacific. Ocean Sci. 1995;268:1480–2. - PubMed

Publication types