. 2020 Oct;24(20):12141-12153.
doi: 10.1111/jcmm.15859. Epub 2020 Sep 11.

Doxorubicin cardiomyopathy is ameliorated by acacetin via Sirt1-mediated activation of AMPK/Nrf2 signal molecules

Affiliations

Doxorubicin cardiomyopathy is ameliorated by acacetin via Sirt1-mediated activation of AMPK/Nrf2 signal molecules

Wei-Yin Wu et al. J Cell Mol Med. 2020 Oct.

Abstract

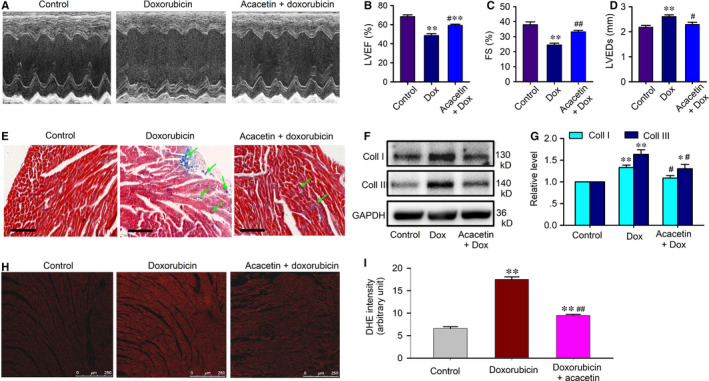
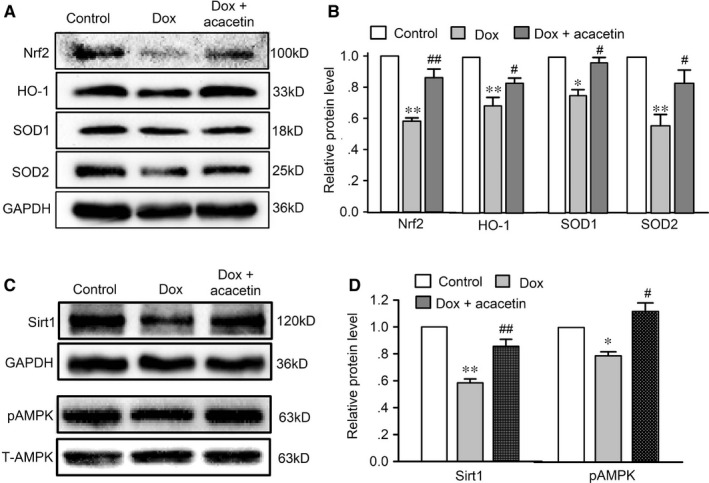
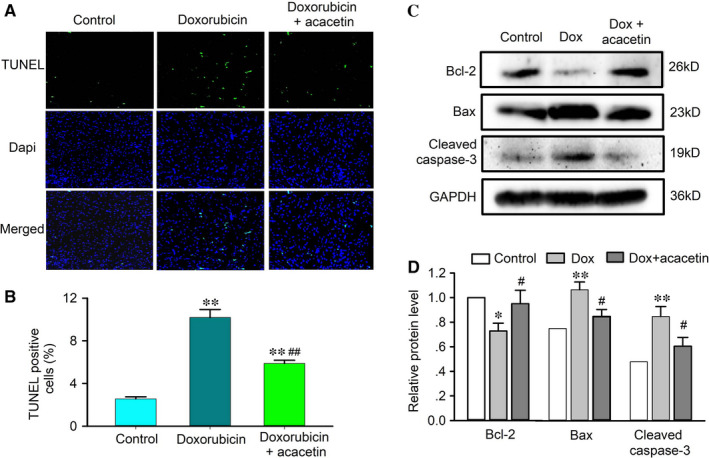
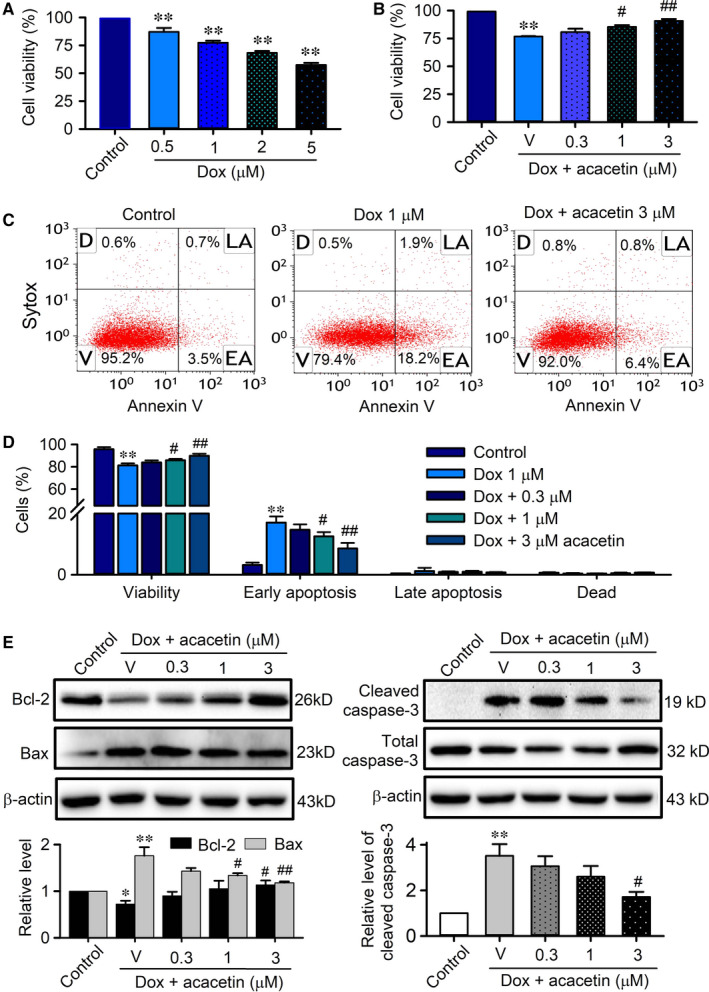
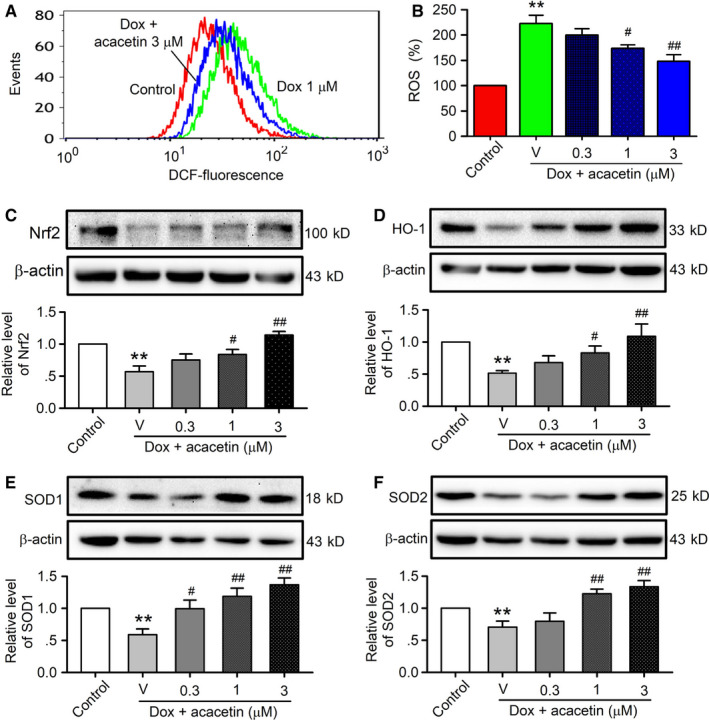
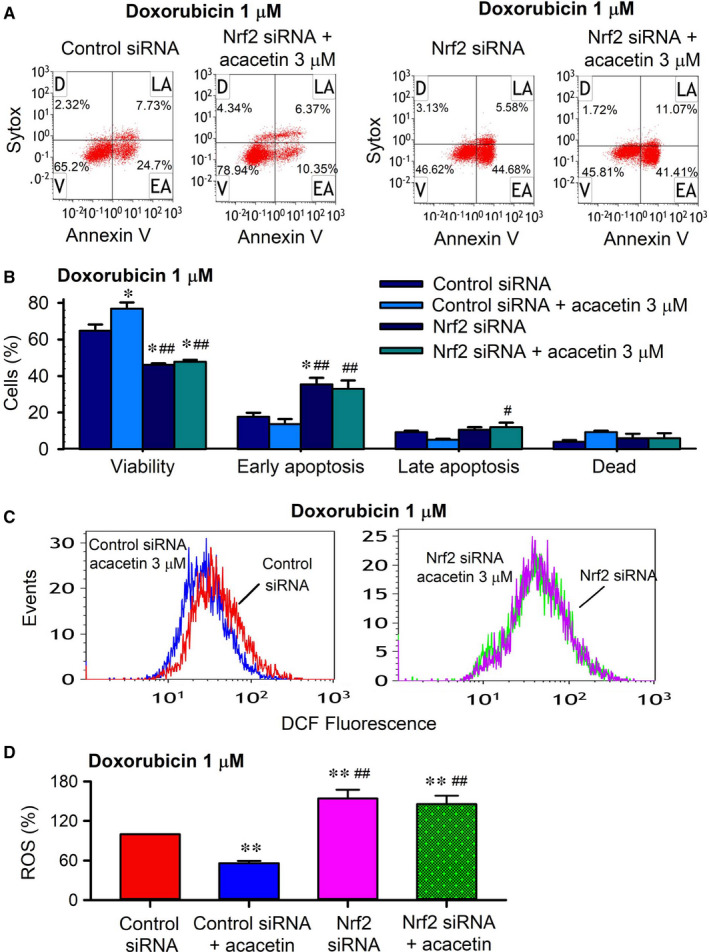
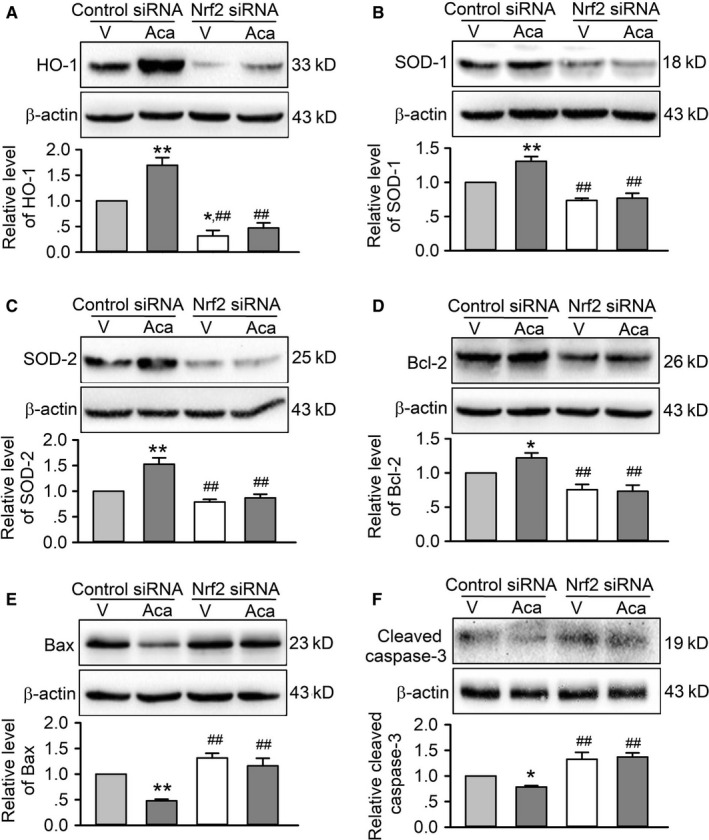
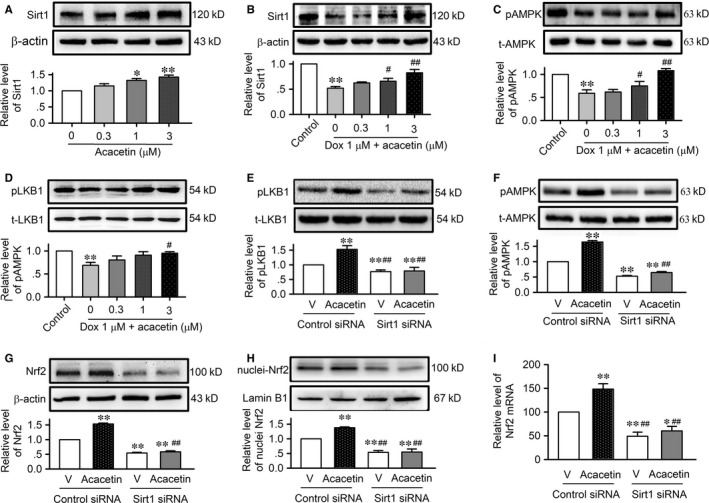
Doxorubicin cardiotoxicity is frequently reported in patients undergoing chemotherapy. The present study investigates whether cardiomyopathy induced by doxorubicin can be improved by the natural flavone acacetin in a mouse model and uncovers the potential molecular mechanism using cultured rat cardiomyoblasts. It was found that the cardiac dysfunction and myocardial fibrosis induced by doxorubicin were significantly improved by acacetin in mice with impaired Nrf2/HO-1 and Sirt1/pAMPK molecules, which is reversed by acacetin treatment. Doxorubicin decreased cell viability and increased ROS production in rat cardiomyoblasts; these effects are significantly countered by acacetin (0.3-3 μM) in a concentration-dependent manner via activating Sirt1/pAMPK signals and enhancing antioxidation (Nrf2/HO-1 and SOD1/SOD2) and anti-apoptosis. These protective effects were abolished in cells with silencing Sirt1. The results demonstrate for the first time that doxorubicin cardiotoxicity is antagonized by acacetin via Sirt1-mediated activation of AMPK/Nrf2 signal molecules, indicating that acacetin may be a drug candidate used clinically for protecting against doxorubicin cardiomyopathy.

Keywords: Sirt1; acacetin; antioxidant; cardiotoxicity; doxorubicin; oxidative stress.


Conflict of interest statement

The authors declare no conflict of interest.

Figures

FIGURE 1
FIGURE 1
Acacetin prevention of cardiac dysfunction in C57BL/6 mice induced by doxorubicin. A, Representative echocardiographs in C57BL/6 mice treated with vehicle, doxorubicin or acacetin prodrug plus doxorubicin. B, Mean values of left ventricular ejection fraction (LVEF) in mice treated with vehicle, doxorubicin or acacetin prodrug plus doxorubicin. C, Mean values of fractional shortening (FS) in mice treated with vehicle, doxorubicin or acacetin prodrug plus doxorubicin. D, Mean values of left ventricular end‐systolic dimension (LVEDs) in mice treated with vehicle, doxorubicin or acacetin prodrug plus doxorubicin. E, Left ventricular tissue slices stained with Masson's trichrome in mice treated with vehicle, doxorubicin or acacetin prodrug plus doxorubicin. F, Western blots of collagen (Coll) I and collagen III in mice treated with vehicle, doxorubicin or acacetin prodrug plus doxorubicin. G, Mean values of collagen I and collagen III proteins in ventricular tissues of hearts in C57BL/6 mice treated with vehicle, doxorubicin or acacetin prodrug plus doxorubicin. H, Representative photomicrographs showing ROS level as assessed by DHE staining in ventricular tissues of mice treated with vehicle (control), doxorubicin and acacetin prodrug plus doxorubicin. I, Mean values of DHE intensity in ventricular tissues of mice treated with vehicle (control), doxorubicin and acacetin prodrug plus doxorubicin (n = 5, ** P < 0.01 vs control; ## P < 0.01 vs doxorubicin alone)
FIGURE 2
FIGURE 2
Effects of acacetin on related‐protein expression in ventricular tissues of mice treated with doxorubicin. A, Western blots of Nrf2, HO‐1, SOD1 and SOD2 in ventricular tissues of mice administered with vehicle (Control), doxorubicin (Dox) and acacetin prodrug plus doxorubicin. B, Summarized relative levels of Nrf2, HO‐1, SOD1 and SOD2 expression in ventricular tissues of mice from Western blots as shown in A. C, Western blots of Bcl‐2, Bax and cleaved caspase‐3 in ventricular tissues of mice with the same treatment as in A. C, Western blots and relative level of Sirt1 in ventricular tissues of mice with the same treatment as in A. D, Western blots and relative level of pAMPK and total AMPK (T‐AMPK) in ventricular tissues of mice with the same treatment as in A (n = 5 individual experiments, * P < 0.05, ** P < 0.01 vs control; # P < 0.05, ## P < 0.01 vs doxorubicin alone)
FIGURE 3
FIGURE 3
Effect of acacetin on myocardial apoptosis in mouse hearts with doxorubicin. A, Representative ventricular sections stained with TUNEL and Dapi to determine apoptotic cardiomycytes in mice treated with vehicle (control), doxorubicin or doxorubicin plus acacetin. B, Percentage of apoptotic cardiomyocytes in mouse hearts treated with vehicle (control), doxorubicin or doxorubicin plus acacetin. C, Western blots of Bcl‐2, Bax and cleaved caspase‐3 in ventricular tissues of mice administered with vehicle (Control), doxorubicin (Dox) and acacetin prodrug plus doxorubicin. D, Summarized relative levels of Bcl‐2, Bax and cleaved caspase‐3 expression in ventricular tissues of mice from Western blots as shown in C (n = 5 individual experiments, * P < 0.05, ** P < 0.01 vs control; # P < 0.05, ## P < 0.01 vs doxorubicin alone)
FIGURE 4
FIGURE 4
Effects of acacetin on cell viability and apoptosis in rat cardiomyoblasts treated with doxorubicin. A, Cell viability determined by MTT in rat cardiomyoblasts treated with 0, 0.5, 1, 2 or 5 μM of doxorubicin (Dox). B, Cell viability in cardiomyoblasts treated with 1 μM doxorubicin in the absence (V, vehicle) and presence of 0.3, 1 or 3 μM acacetin. C, Flow cytometry graphs show cell viability and apoptosis populations of rat cardiomyoblasts without (control) with 1 μM doxorubicin treatment in the absence or presence of 3 μM acacetin. Cells were labelled with Annexin V‐APC and stained with SYTOX (V, viability; D, dead cells; LA, late apoptosis; EA, early apoptosis). D, Mean per cent values of cell viability, early apoptosis, late apoptosis and dead cells in rat cardiomyoblasts treated with 1 μM doxorubicin in the absence or presence of 0.3, 1 or 3 μM acacetin. E, Western blots and relative mean values of Bcl‐2, Bax and cleaved caspase‐3 in rat cardiomyoblasts treated with 1 μM doxorubicin in the absence or presence of 0.3, 1 or 3 μM acacetin (n = 5 individual experiments, * P < 0.05, ** P < 0.01 vs control; # P < 0.05, ## P < 0.01 vs doxorubicin alone)
FIGURE 5
FIGURE 5
Effects of acacetin on ROS production and antioxidative proteins in cells treated with doxorubicin. A, Flow cytometry graphs showing ROS levels in rat cardiomyoblasts treated without (control) or with 1 μM doxorubicin (Dox) in the absence or presence of 3 μM acacetin. B, Mean per cent values of ROS level in rat cardiomyoblasts without (control) or with doxorubicin exposure in the absence (V, vehicle) or presence of 0.3, 1 or 3 μM acacetin. C‐F, Western blots and mean relative levels of Nrf2 (C), HO‐1 (D), SOD1 (E), SOD2 (F) in rat cardiomyoblasts treated with doxorubicin in the absence and presence of 0.3, 1 or 3 μM acacetin (n = 5 individual experiments, ** P < 0.01 vs control; # P < 0.05, ## P < 0.01 vs doxorubicin alone)
FIGURE 6
FIGURE 6
Acacetin protection against doxorubicin cardiotoxicity was abolished in cells with silenced Nrf2. A, Flow cytometry graphs showing cell viability, early apoptosis, late apoptosis and dead cells in rat cardiomyoblasts transfected with control siRNA or Nrf2 siRNA for 48 h and then subjected to 1 μM doxorubicin exposure in the absence or presence of 3 μM acacetin. B, Mean per cent values of cell viability, early apoptosis, late apoptosis and dead cells from flow cytometry graphs as shown in A. C, Flow cytometry graphs showing ROS levels in rat cardiomyoblasts transfected with control siRNA or Nrf2 siRNA and then subjected to 1 μM doxorubicin in the absence or presence of 3 μM acacetin. D, Summarized ROS levels in rat cardiomyoblasts transfected with control siRNA or Nrf2 siRNA from flow cytometry graphs as shown in C (n = 5 individual experiments, * P < 0.05, ** P < 0.01 vs control siRNA; # P < 0.05, ## P < 0.01 vs control siRNA with acacetin)
FIGURE 7
FIGURE 7
Effects of silencing Nrf2 on antioxidation and apoptosis‐related proteins in cells with doxorubicin exposure. A, Western blots and relative levels of HO‐1 in H9C2 cardiomyoblasts transfected with control siRNA or Nrf2 siRNA and subjected to doxorubicin injury in the absence (V, vehicle) or presence of 3 μM acacetin (Aca). B, Western blots and relative levels of SOD1 in H9C2 cardiomyoblasts with the same treatment as in A. C, Western blots and relative levels of SOD2 in H9C2 cardiomyoblasts with the same treatment as in A. D, Western blots and relative levels of Bcl‐2 in H9C2 cardiomyoblasts with the same treatment as in A. E, Western blots and relative levels of Bax in H9C2 cardiomyoblasts with the same treatment as in A. F, Western blots and relative levels of cleaved caspase‐3 in H9C2 cardiomyoblasts with the same treatment as in A (n = 5 individual experiments, * P < 0.05, ** P < 0.01 vs vehicle of control siRNA; ## P < 0.01 vs control siRNA with acacetin)
FIGURE 8
FIGURE 8
Effects of acacetin on Sirt1 and the dominant signal molecules. A, Western blots and relative level of Sirt1 in rat cardiomyoblasts in the absence and presence of 0.3, 1 or 3 μM acacetin. B, Western blots and mean relative levels of Sirt1 in rat cardiomyoblasts treated with 1 μM doxorubicin in the absence and presence of 0.3, 1 or 3 μM acacetin. C, Western blots and mean relative levels of pAMPK in rat cardiomyoblasts with the same treatment as in B. D, Western blots and mean relative levels of pLKB in rat cardiomyoblasts with the same treatment as in B. E, Western blots and relative level of pLKB and total LKB (t‐LKB) in rat cardiomyoblasts transfected with control siRNA or Sirt1 siRNA in the absence (V, vehicle) or presence of 3 μM acacetin. F, Western blots and relative level of pAMPK and total AMPK (t‐AMPK) in rat cardiomyoblasts transfected with control siRNA or Sirt1 siRNA and treated as in E. G, Western blots and relative level of Nrf2 in rat cardiomyoblasts with the same treatment as in E. H, Western blots and relative level of nuclei Nrf2 in rat cardiomyoblasts with the same treatment as in E. I, Relative Nrf2 mRNA level measured with real‐time PCR in rat cardiomyoblasts with the same treatment as in E. (n = 5 individual experiments, * P < 0.05, ** P < 0.01 vs control or vehicle of control siRNA; # P < 0.05, ## P < 0.01 vs control siRNA with acacetin)

Similar articles

Cited by

References

    1. Takemura G, Fujiwara H. Doxorubicin‐induced cardiomyopathy from the cardiotoxic mechanisms to management. Prog Cardiovasc Dis. 2007;49:330‐352. - PubMed
    1. Octavia Y, Tocchetti CG, Gabrielson KL, Janssens S, Crijns HJ, Moens AL. Doxorubicin‐induced cardiomyopathy: from molecular mechanisms to therapeutic strategies. J Mol Cell Cardiol. 2012;52:1213‐1225. - PubMed
    1. Singal PK, Iliskovic N. Doxorubicin‐induced cardiomyopathy. N Engl J Med. 1998;339:900‐905. - PubMed
    1. Nebigil CG, Desaubry L. Updates in anthracycline‐mediated cardiotoxicity. Front Pharmacol. 2018;9:1262. - PMC - PubMed
    1. Vejpongsa P, Yeh ET. Prevention of anthracycline‐induced cardiotoxicity: challenges and opportunities. J Am Coll Cardiol. 2014;64:938‐945. - PubMed

Publication types

MeSH terms