Meta-Analysis
. 2021 Mar 2;60(3):1260-1272.
doi: 10.1093/rheumatology/keaa453.

Impact of overweight and obesity on patient-reported health-related quality of life in systemic lupus erythematosus

Affiliations
Meta-Analysis

Impact of overweight and obesity on patient-reported health-related quality of life in systemic lupus erythematosus

Alvaro Gomez et al. Rheumatology (Oxford). .

Abstract

Objectives: Associations between BMI and health-related quality of life (HRQoL) in SLE have been implied, but data are scarce. We determined the impact of overweight and obesity on HRQoL in a large SLE population.

Methods: We pooled cross-sectional baseline data from the BLISS-52 (NCT00424476) and BLISS-76 (NCT00410384) trials (N = 1684). HRQoL was evaluated using the 36-item Short Form Health Survey (SF-36), Functional Assessment of Chronic Illness Therapy (FACIT)-Fatigue scale and the European Quality of Life 5-dimension questionnaire (EQ-5D). Comparisons between BMI groups were conducted using the Mann-Whitney U test and adjustments using linear regression. Clinical relevance was determined by minimal clinically important differences (MCIDs).

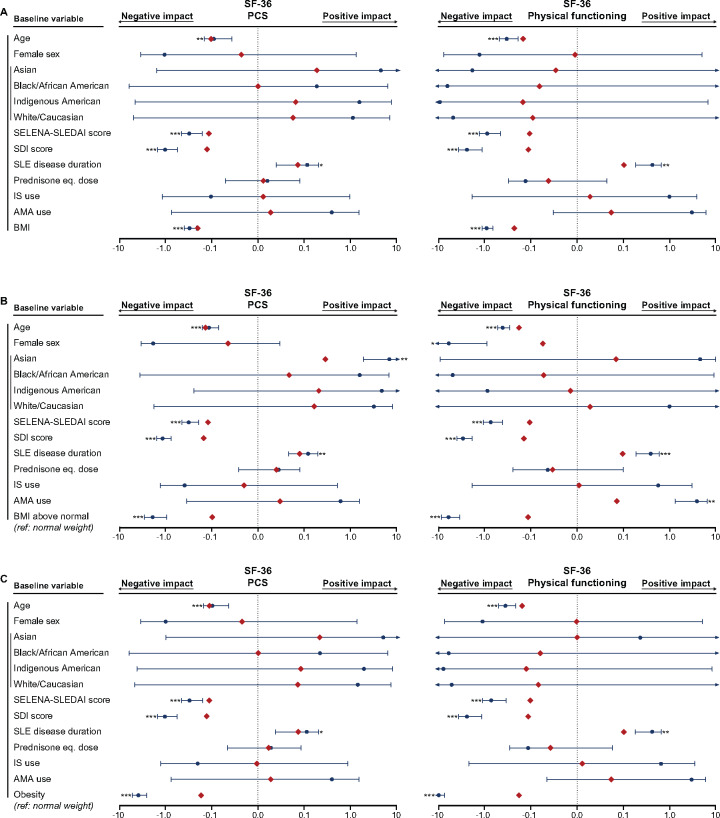
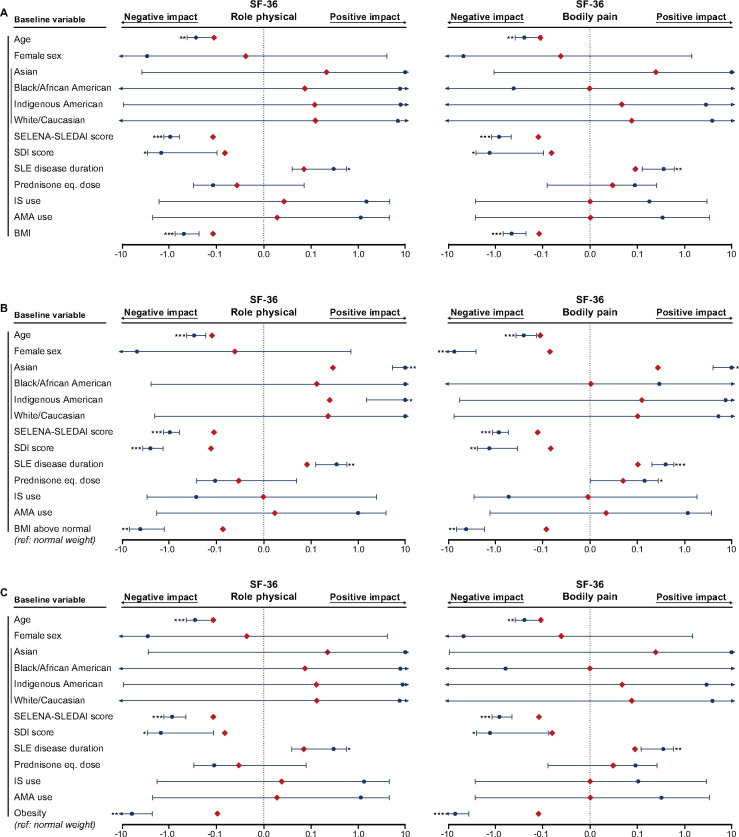
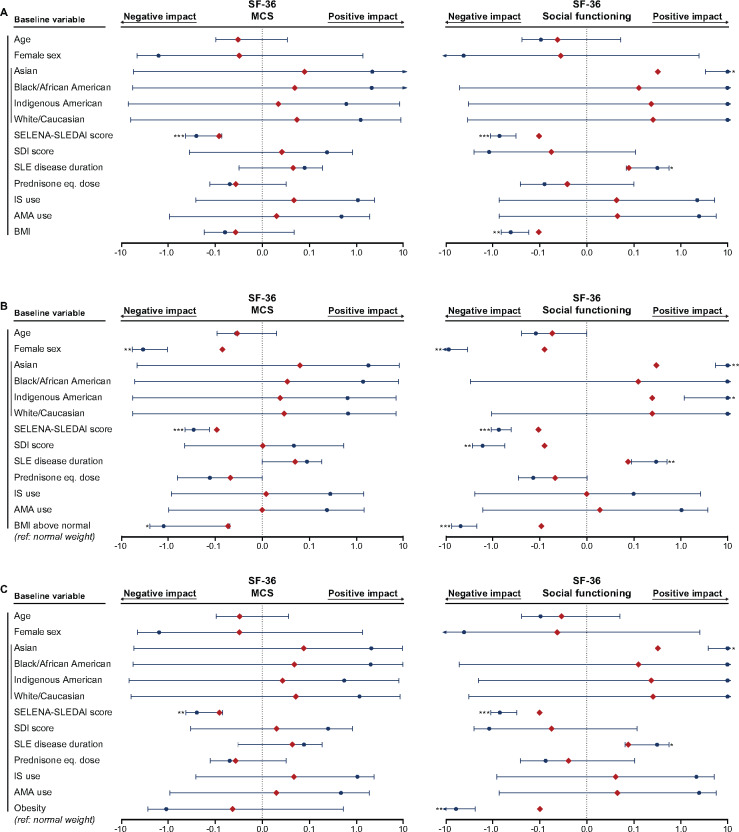
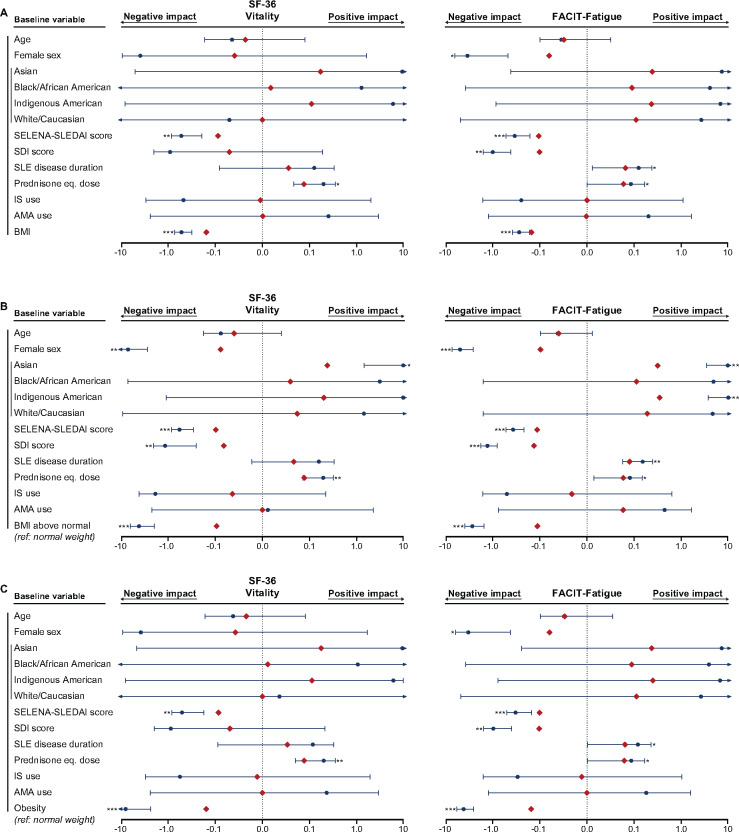
Results: In total, 43.2% of the patients had BMI above normal and 17.4% were obese. Overweight and obese patients reported worse SF-36 physical component summary (PCS), physical functioning, role physical, bodily pain and FACIT-Fatigue scores than normal weight patients. Divergences were greater than corresponding MCIDs and more prominent with increasing BMI. Despite no clinically important difference in SF-36 mental component summary scores across BMI categories, patients experienced progressively diminished vitality and social functioning with increasing BMI. In linear regression analysis, BMI above normal and obesity were associated with worse PCS (standardized coefficient β = -0.10, P < 0.001 and β = -0.17, P < 0.001, respectively), FACIT-Fatigue (β = -0.11, P < 0.001 and β = -0.16, P < 0.001) and EQ-5D (β = -0.08, P = 0.001 and β = -0.12, P < 0.001) scores, independently of demographic and disease-related factors. The impact of BMI on the PCS and FACIT-Fatigue was more pronounced than that of SLE activity.

Conclusion: Patients with SLE and BMI above normal experienced clinically important HRQoL diminutions in physical aspects, fatigue and social functioning. A survey of potential causality underlying this association is warranted.

Keywords: SLE; health-related quality of life; obesity; patient-reported outcomes.


Figures

<sc>Fig</sc>. 1
Fig. 1
HRQoL indices across different BMI groups of SLE patients Groups are based on BMI measures, according to cut-off values established by the World Health Organization. The heights of the boxes represent mean scores and the whiskers indicate s.d. Upper bounds of bars below the dashed lines represent means that differ from the mean scores in the corresponding normal weight group by more than the MCID, the latter denoted by double-sided arrows. Symbols above the whiskers indicate statistically significant differences. Since the number of observations in the subgroups may differ from the total number of patients due to missing data, the number of available observations (n) is provided.
<sc>Fig</sc>. 2
Fig. 2
Associations of BMI with SF-36 PCS and PF The forest plots illustrate results from multiple linear regression models. (A) BMI was analysed as a continuous variable. Separate models for the (B) BMI above normal and (C) obesity groups were created, with the normal weight group as the reference comparator in both cases. The dark blue circles represent the unstandardized coefficients and the whiskers represent the 95% CIs. The red diamonds represent the standardized coefficients. Asterisks indicate statistically significant associations. Level of significance: *P < 0.05, **P < 0.01, ***P < 0.001. AMA: antimalarial agents.
<sc>Fig</sc>. 3
Fig. 3
Associations of BMI with SF-36 RP and BP The forest plots illustrate results from multiple linear regression models. (A) BMI was analysed as a continuous variable. Separate models for the (B) BMI above normal and (C) obesity groups were created, with the normal weight group as the reference comparator in both cases. The dark blue circles represent the unstandardized coefficients and the whiskers represent the 95% CIs. The red diamonds represent the standardized coefficients. Asterisks indicate statistically significant associations. Level of significance: *P < 0.05, **P < 0.01, ***P < 0.001. IS: immunosuppressants; AMA: antimalarial agents.
<sc>Fig</sc>. 4
Fig. 4
Associations of BMI with SF-36 MCS and SF The forest plots illustrate results from multiple linear regression models. (A) BMI was analysed as a continuous variable. Separate models for the (B) BMI above normal and (C) obesity groups were created, with the normal weight group as the reference comparator in both cases. The dark blue circles represent the unstandardized coefficients and the whiskers represent the 95% CIs. The red diamonds represent the standardized coefficients. Asterisks indicate statistically significant associations. Level of significance: *P < 0.05, **P < 0.01, ***P < 0.001. IS: immunosuppressants; AMA: antimalarial agents.
<sc>Fig</sc>. 5
Fig. 5
Associations of BMI with SF-36 VT and FACIT-Fatigue The forest plots illustrate results from multiple linear regression models. (A) BMI was analysed as a continuous variable. Separate models for the (B) BMI above normal and (C) obesity groups were created, with the normal weight group as the reference comparator in both cases. The dark blue circles represent the unstandardized coefficients and the whiskers represent the 95% CIs. The red diamonds represent the standardized coefficients. Asterisks indicate statistically significant associations. Level of significance: *P < 0.05, **P < 0.01, ***P < 0.001. IS: immunosuppressants; AMA: antimalarial agents.

References

    1. Tselios K, Gladman DD, Sheane BJ, Su J, Urowitz M.. All-cause, cause-specific and age-specific standardised mortality ratios of patients with systemic lupus erythematosus in Ontario, Canada over 43 years (1971–2013). Ann Rheum Dis 2019;78:802–6. - PubMed
    1. Azizoddin DR, Gandhi N, Weinberg S. et al. Fatigue in systemic lupus: the role of disease activity and its correlates. Lupus 2019;28:163–73. - PubMed
    1. Pettersson S, Lövgren M, Eriksson LE. et al. An exploration of patient-reported symptoms in systemic lupus erythematosus and the relationship to health-related quality of life. Scand J Rheumatol 2012;41:383–90. - PubMed
    1. Campbell R Jr, Cooper GS, Gilkeson GS.. Two aspects of the clinical and humanistic burden of systemic lupus erythematosus: mortality risk and quality of life early in the course of disease. Arthritis Rheum 2008;59:458–64. - PMC - PubMed
    1. Zhu LW, Zhang T, Pan HF, Li XP, Ye DQ.. BMI, disease activity, and health-related quality-of-life in systemic lupus erythematosus. Clin Rheumatol 2010;29:1413–7. - PubMed

Publication types

Associated data