. 2020 Dec;11(6):1688-1704.
doi: 10.1002/jcsm.12615. Epub 2020 Sep 12.

Cancer cachexia in a mouse model of oxidative stress

Affiliations

Cancer cachexia in a mouse model of oxidative stress

Jacob L Brown et al. J Cachexia Sarcopenia Muscle. 2020 Dec.

Abstract

Background: Cancer is associated with muscle atrophy (cancer cachexia) that is linked to up to 40% of cancer-related deaths. Oxidative stress is a critical player in the induction and progression of age-related loss of muscle mass and weakness (sarcopenia); however, the role of oxidative stress in cancer cachexia has not been defined. The purpose of this study was to examine if elevated oxidative stress exacerbates cancer cachexia.

Methods: Cu/Zn superoxide dismutase knockout (Sod1KO) mice were used as an established mouse model of elevated oxidative stress. Cancer cachexia was induced by injection of one million Lewis lung carcinoma (LLC) cells or phosphate-buffered saline (saline) into the hind flank of female wild-type mice or Sod1KO mice at approximately 4 months of age. The tumour developed for 3 weeks. Muscle mass, contractile function, neuromuscular junction (NMJ) fragmentation, metabolic proteins, mitochondrial function, and motor neuron function were measured in wild-type and Sod1KO saline and tumour-bearing mice. Data were analysed by two-way ANOVA with Tukey-Kramer post hoc test when significant F ratios were determined and α was set at 0.05. Unless otherwise noted, results in abstract are mean ±SEM.

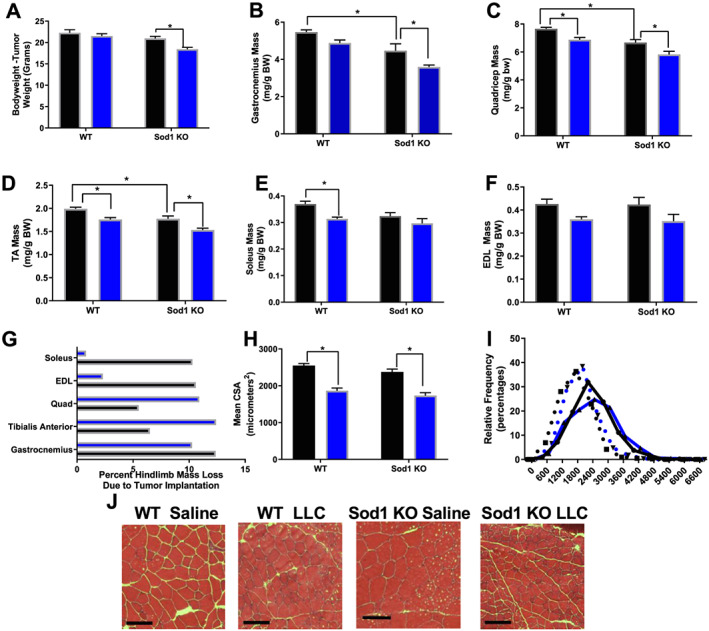
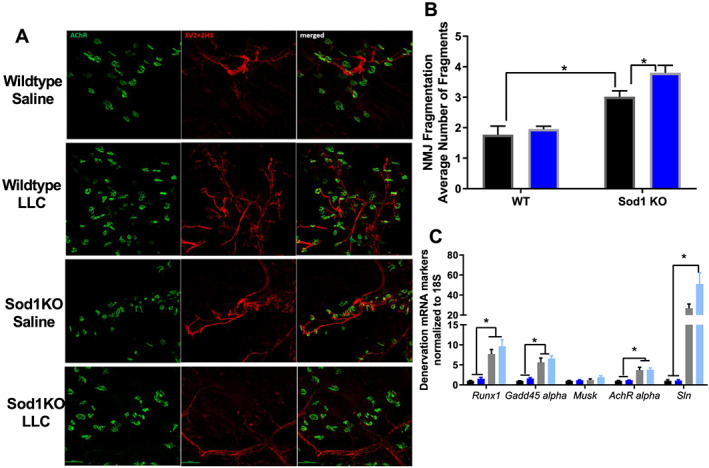
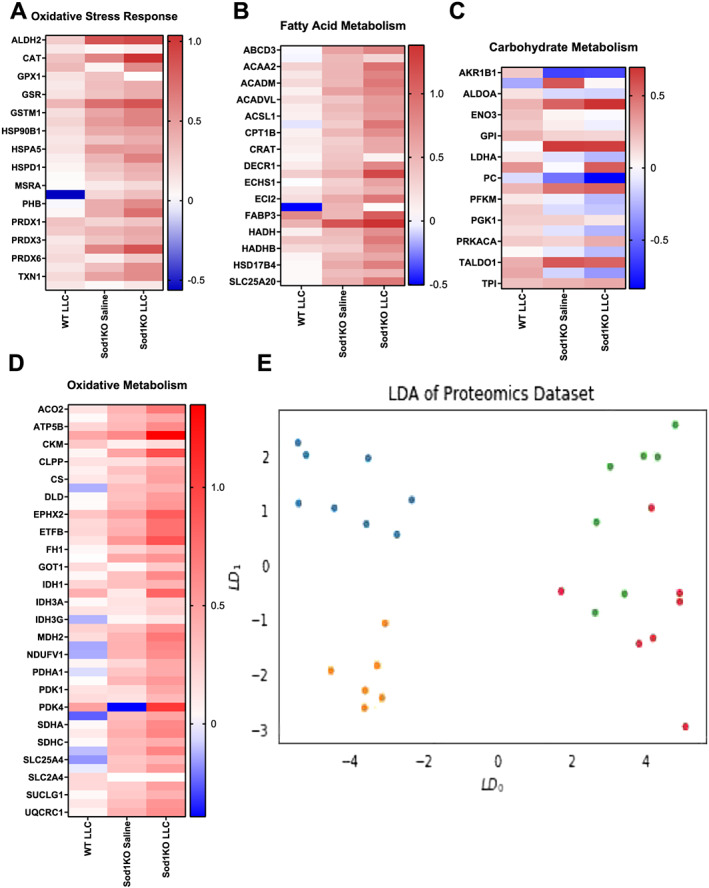
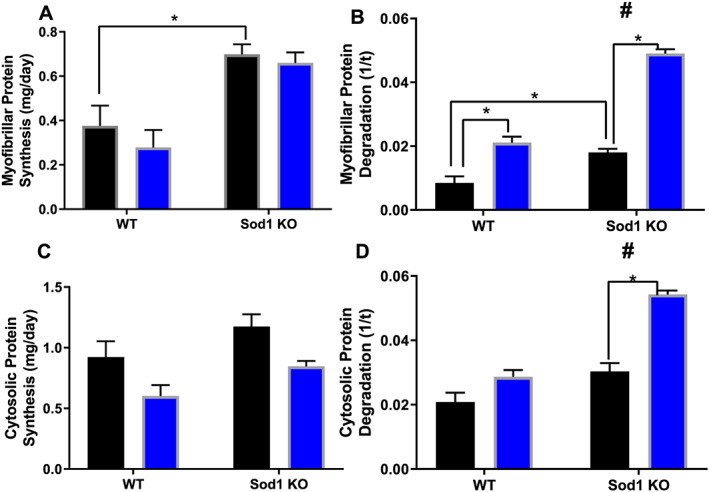
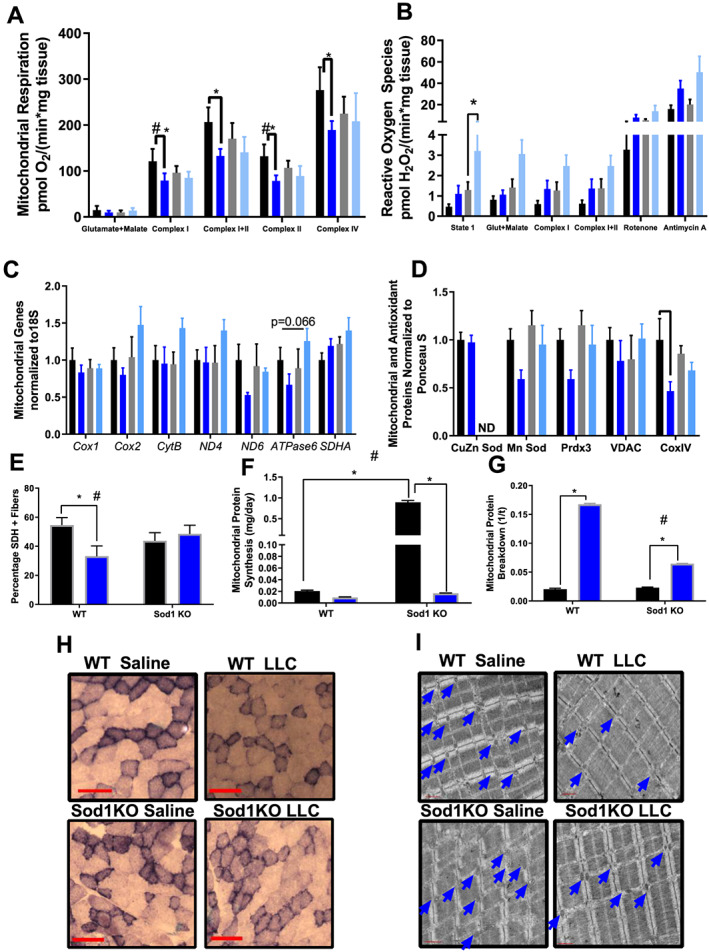
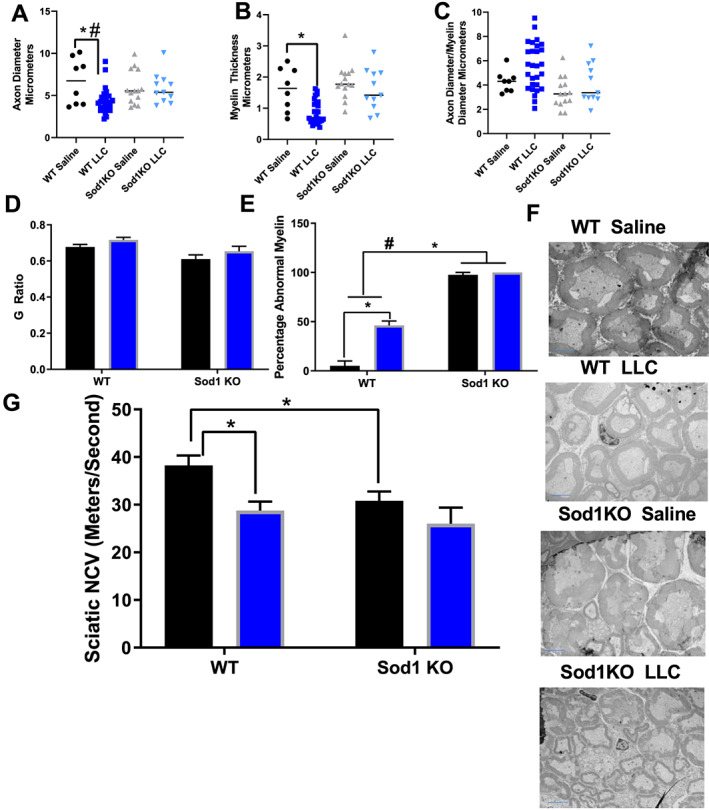
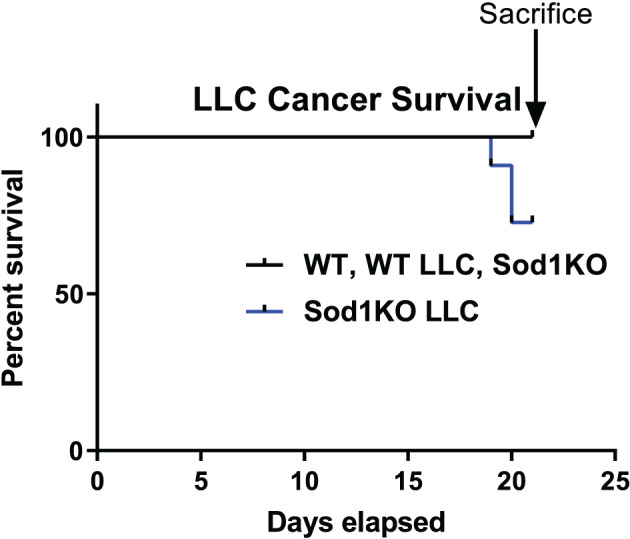
Results: Muscle mass and cross-sectional area were significantly reduced, in tumour-bearing mice. Metabolic enzymes were dysregulated in Sod1KO mice and cancer exacerbated this phenotype. NMJ fragmentation was exacerbated in tumour-bearing Sod1KO mice. Myofibrillar protein degradation increased in tumour-bearing wild-type mice (wild-type saline, 0.00847 ± 0.00205; wildtype LLC, 0.0211 ± 0.00184) and tumour-bearing Sod1KO mice (Sod1KO saline, 0.0180 ± 0.00118; Sod1KO LLC, 0.0490 ± 0.00132). Muscle mitochondrial oxygen consumption was reduced in tumour-bearing mice compared with saline-injected wild-type mice. Mitochondrial protein degradation increased in tumour-bearing wild-type mice (wild-type saline, 0.0204 ± 0.00159; wild-type LLC, 0.167 ± 0.00157) and tumour-bearing Sod1KO mice (Sod1KO saline, 0.0231 ± 0.00108; Sod1 KO LLC, 0.0645 ± 0.000631). Sciatic nerve conduction velocity was decreased in tumour-bearing wild-type mice (wild-type saline, 38.2 ± 0.861; wild-type LLC, 28.8 ± 0.772). Three out of eleven of the tumour-bearing Sod1KO mice did not survive the 3-week period following tumour implantation.

Conclusions: Oxidative stress does not exacerbate cancer-induced muscle loss; however, cancer cachexia may accelerate NMJ disruption.

Keywords: CuZn superoxide dismutase knockout mice (Sod1KO); Lewis lung carcinoma cells (LLC); Lung cancer; Oxidative stress; Reactive oxygen species (ROS).


Conflict of interest statement

All authors declare no conflicts of interest.

Figures

Figure 1
Figure 1
Characterization of LLC‐induced cancer cachexia in wild‐type (WT) and Sod1KO mice. (A) Body weights (BW—tumour weight) of WT saline, WT Lewis lung carcinoma (LLC), Sod1KO saline, and Sod1KO LLC tumour‐bearing mice. (B) Gastrocnemius mass in all groups normalized to BW. (C) Quadricep mass in all groups normalized to BW. (D) Tibialis anterior (TA) mass in all groups normalized to BW. (E) Soleus mass in all groups normalized to BW. (F) Extensor digitorum longus (EDL) mass in all groups normalized to BW. (G) Percent mass lost from cancer in hindlimb muscles of WT and Sod1KO mice. (H) Mean cross‐sectional area (CSA) analysis for all groups. (I) Frequency distribution of small fibres, average fibres, and large fibres. Groups for frequency distribution are displayed as shown here. (J) Representative images for haematoxylin and eosin stain across all groups. Scale bar is 100 μM. N of 6–8 was used for each group. Saline, black bar; LLC, blue bar. Asterisk denotes post hoc differences at an alpha set at P < 0.05.
Figure 2
Figure 2
Oxidative stress‐induced contractile dysfunction is not exacerbated in tumour‐bearing mice. (A) Twitch contractile force for EDL muscle ex vivo. (B) Maximal contractile force for EDL muscle ex vivo. (C) Specific maximal contractile force for EDL muscle ex vivo. Saline, black bar; Lewis lung carcinoma, blue bar. Asterisk denotes post hoc differences at an alpha set at P < 0.05. EDL, extensor digitorum longus; WT, wild type.
Figure 3
Figure 3
Cancer does not exacerbate neuromuscular junction disruption. (A) Representative images for NMJ staining in all groups. (B) NMJ fragmentation in all groups. Saline, black bar; LLC, blue bar. (C) Colours for graphs displayed in (C) are displayed here. Wild‐type saline, black bar; wild‐type LLC, dark blue bar; Sod1KO saline, grey bar; Sod1KO LLC, light blue bar. Denervation mRNA markers in all groups. For NMJ staining, an N of 2 animals per group was used. N of 6–8 per group was used in mRNA denervation markers.. Number sign denotes an interaction. Asterisk denotes post hoc differences at an alpha set at P < 0.05. LLC, Lewis lung carcinoma; NMJ, neuromuscular junction; WT, wild type.
Figure 4
Figure 4
Metabolic enzymes are altered in Sod1KO mice and tumour‐bearing mice. (A) Heat map for oxidative stress enzymes relative to wild‐type saline mice. (B) Heat map for fatty acid metabolism enzymes relative to wild‐type saline mice. (C) Heat map for carbohydrate metabolism enzymes relative to wild‐type saline mice. (D) Heat map for oxidative metabolism enzymes relative to wild‐type saline mice. Targeted proteomics of glycolysis enzymes in all groups. (E) LDA analysis for the proteomics data set. Red, wild‐type saline; green, wild‐type LLC; orange, Sod1KO saline; blue, Sod1KO LLC. N of 6–8 per group was used. LDA, linear discriminant analysis; LLC, Lewis lung carcinoma; WT, wild type.
Figure 5
Figure 5
Tumour‐bearing mice have protein imbalance favouring degradation, despite an oxidative stress associated increase in myofibrillar protein synthesis. (A) Myofibrillar protein synthesis between all groups. (B) Myofibrillar protein degradation between all groups. (C) Cytosolic protein synthesis between all groups. (D) Cytosolic protein degradation between all groups. Saline, black bar; Lewis lung carcinoma, blue bar. Number sign denotes if there was an interaction. Asterisk denotes post hoc differences at an alpha set at P < 0.05. WT, wild type.
Figure 6
Figure 6
Tumour‐bearing mice have impaired mitochondrial function, increased reactive oxygen species production, and a loss of oxidative fibres. (A) Respiration measurements normalized to muscle wet weight. (B) Peroxide assessments normalized to muscle wet weight. There were main effects for both the genotype and LLC for an increase in hydroperoxide production for state 1, glutamate malate, complex I, complex I + II, and complex II stimulated ROS production. There was an ME for cancer‐induced increased in ROS production after antimycin A electron transport chain inhibition. Colours for graphs (C–E) are displayed here. (C) mRNA content of mitochondria genes. (D) Protein content of mitochondrial and antioxidant proteins. (E) Percent area stained positive for SDH. (F) Mitochondrial protein synthesis measurement using CoxIV as a mitochondrial content marker (Figure 6D). (G) Mitochondrial protein breakdown measurement using CoxIV as a mitochondrial content marker (Figure 6D). (H) SDH stain representative images. (I) TEM representative images. For TEM imaging, an N of 2 per group was used. N of 6–8 per group was used for all other measurements. (A–D) Wild‐type saline, black bar; wild‐type LLC, dark blue bar; Sod1KO saline, grey bar; Sod1KO LLC, light blue bar. (E–G) Saline, black bar; LLC, blue bar. Number sign denotes an interaction. Asterisk denotes post hoc differences at an alpha set at P < 0.05. LLC, Lewis lung carcinoma; WT, wild type.
Figure 7
Figure 7
Motor neuron dysfunction is present in Sod1KO mice and tumour‐bearing mice. (A) Axon diameter measurements from sciatic nerve TEM images in all groups. (B) Myelin diameter measurements from sciatic nerve TEM images in all groups. (C) Axon diameter/myelin diameter from sciatic nerve TEM images in all groups. (D) G ratio from sciatic nerve TEM images in all groups. (E) Percent abnormal myelin from sciatic nerve TEM images in all groups. (F) Representative sciatic nerve TEM images. (G) Sciatic nerve conduction velocity assessment in all groups. For TEM image analysis, an N of 1 animal per group was used. N of 6–8 per group was used for nerve conduction velocity. (A–C) Wild‐type saline, black circles; wild‐type LLC, dark blue squares; Sod1KO saline, grey triangles; Sod1KO LLC, light blue inverted triangles. (D–G) Saline, black bar; LLC, blue bar. Number sign denotes an interaction. Asterisk denotes post hoc differences at an alpha set at P < 0.05. LLC, Lewis lung carcinoma; WT, wild type.
Figure 8
Figure 8
LLC‐injection induced death of Sod1KO mice within 3 weeks. Survival curve of tumour‐bearing WT (n = 8) and Sod1KO (n = 11) mice. Black line, wildtype saline, wildtype LLC, and Sod1KO saline. Blue line, Sod1KO LLC. LLC, Lewis lung carcinoma; WT, wild type.

References

    1. Fearon KC, Glass DJ, Guttridge DC. Cancer cachexia: mediators, signaling, and metabolic pathways. Cell sMetab 2012;16:153–166. - PubMed
    1. Fearon K, Strasser F, Anker SD, Bosaeus I, Bruera E, Fainsinger RL, et al. Definition and classification of cancer cachexia: an international consensus. Lancet Oncol 2011;12:489–495. - PubMed
    1. Onesti JK, Guttridge DC. Inflammation based regulation of cancer cachexia. Biomed Res Int 2014;2014:168407. - PMC - PubMed
    1. Xiao J, Caan BJ, Weltzien E, Cespedes Feliciano EM, Kroenke CH, Meyerhardt JA, et al. Associations of pre‐existing co‐morbidities with skeletal muscle mass and radiodensity in patients with non‐metastatic colorectal cancer. J Cachexia Sarcopenia Muscle 2018;9:654–663. - PMC - PubMed
    1. Davis MP, Panikkar R. Sarcopenia associated with chemotherapy and targeted agents for cancer therapy. Ann Palliat Med 2019;8:86–101. - PubMed

Publication types

Substances