

In situ monitoring of photocatalyzed isomerization reactions on a microchip flow reactor by IR-MALDI ion mobility spectrometry
- PMID: 32918557
- PMCID: PMC7550389
- DOI: 10.1007/s00216-020-02923-y
In situ monitoring of photocatalyzed isomerization reactions on a microchip flow reactor by IR-MALDI ion mobility spectrometry
Abstract
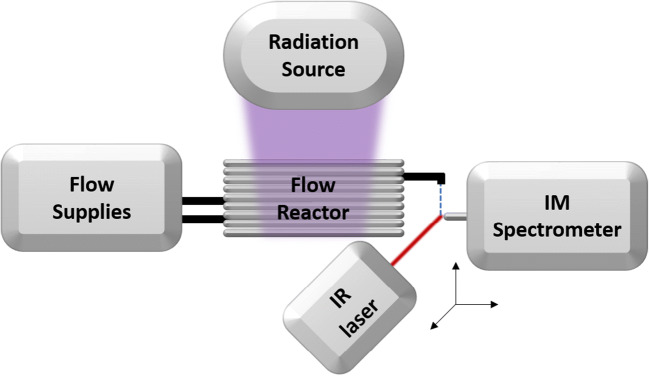
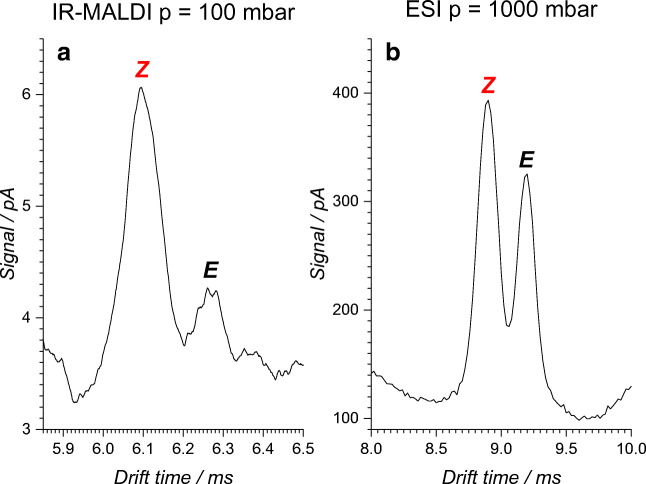
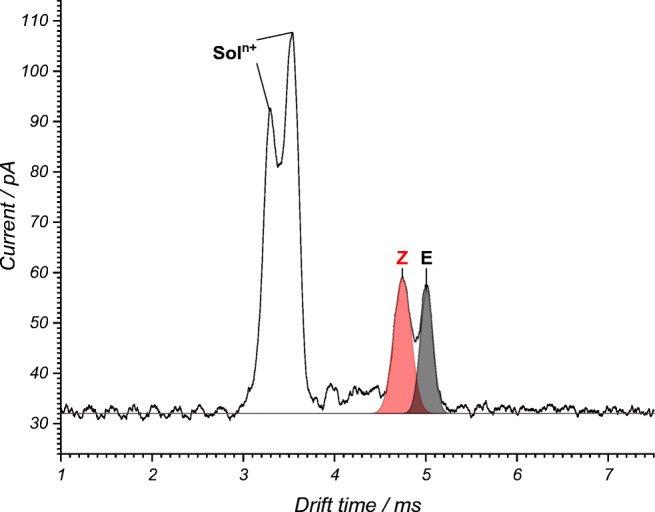
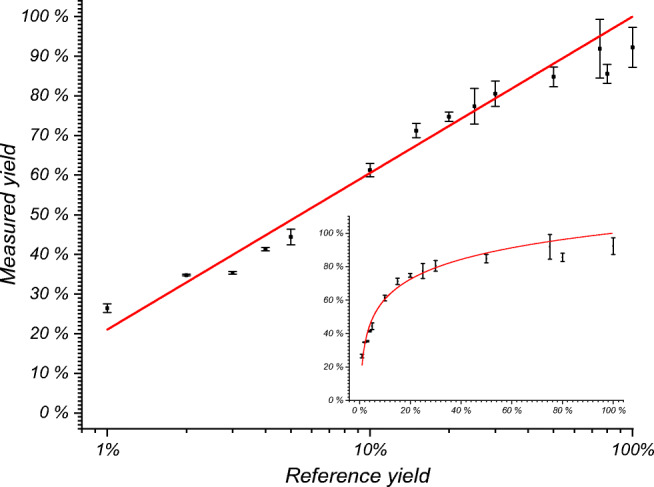
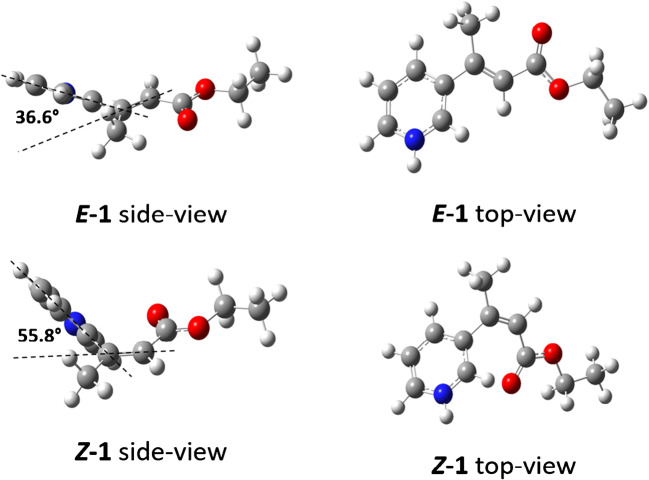
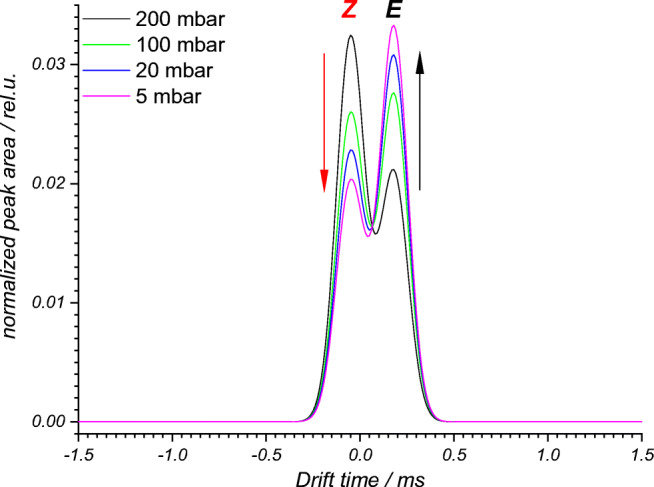
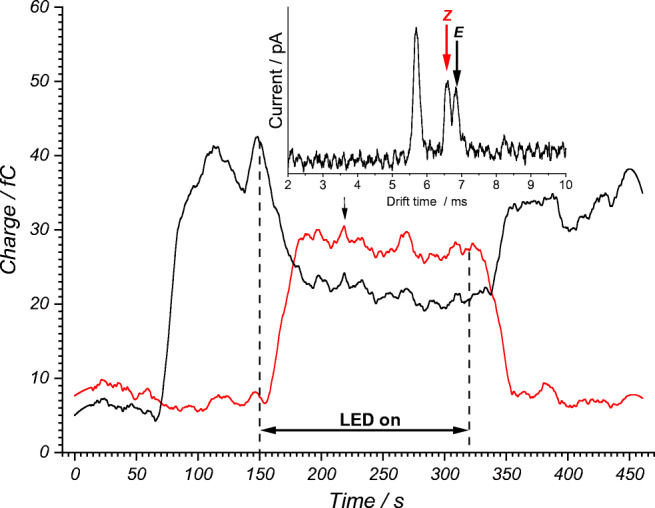
The visible-light photocatalytic E/Z isomerization of olefins can be mediated by a wide spectrum of triplet sensitizers (photocatalysts). However, the search for the most efficient photocatalysts through screenings in photo batch reactors is material and time consuming. Capillary and microchip flow reactors can accelerate this screening process. Combined with a fast analytical technique for isomer differentiation, these reactors can enable high-throughput analyses. Ion mobility (IM) spectrometry is a cost-effective technique that allows simple isomer separation and detection on the millisecond timescale. This work introduces a hyphenation method consisting of a microchip reactor and an infrared matrix-assisted laser desorption ionization (IR-MALDI) ion mobility spectrometer that has the potential for high-throughput analysis. The photocatalyzed E/Z isomerization of ethyl-3-(pyridine-3-yl)but-2-enoate (E-1) as a model substrate was chosen to demonstrate the capability of this device. Classic organic triplet sensitizers as well as Ru-, Ir-, and Cu-based complexes were tested as catalysts. The ionization efficiency of the Z-isomer is much higher at atmospheric pressure which is due to a higher proton affinity. In order to suppress proton transfer reactions by limiting the number of collisions, an IM spectrometer working at reduced pressure (max. 100 mbar) was employed. This design reduced charge transfer reactions and allowed the quantitative determination of the reaction yield in real time. Among 14 catalysts tested, four catalysts could be determined as efficient sensitizers for the E/Z isomerization of ethyl cinnamate derivative E-1. Conversion rates of up to 80% were achieved in irradiation time sequences of 10 up to 180 s. With respect to current studies found in the literature, this reduces the acquisition times from several hours to only a few minutes per scan.
Keywords: IR-MALDI; Ion mobility spectrometry; Microchip; Olefin isomerization; Photocatalysis; Photochemistry; Reaction monitoring.
Conflict of interest statement
The authors declare that they have no conflict of interest.
Figures
Similar articles
-
Application of Hydroxyaromatic Aldehydes in Ultra-Efficient and Metal-Free Photocatalytic E→Z Isomerization of Olefin.ChemSusChem. 2025 Feb 1;18(3):e202401387. doi: 10.1002/cssc.202401387. Epub 2024 Nov 5. ChemSusChem. 2025. PMID: 39499229
-
Sub-ambient pressure IR-MALDI ion mobility spectrometer for the determination of low and high field mobilities.Anal Bioanal Chem. 2020 Sep;412(22):5247-5260. doi: 10.1007/s00216-020-02735-0. Epub 2020 Jun 2. Anal Bioanal Chem. 2020. PMID: 32488389
-
IR-MALDI ion mobility spectrometry.Anal Bioanal Chem. 2016 Sep;408(23):6259-68. doi: 10.1007/s00216-016-9739-x. Epub 2016 Jul 2. Anal Bioanal Chem. 2016. PMID: 27370689
-
Screening of synthetic PDE-5 inhibitors and their analogues as adulterants: analytical techniques and challenges.J Pharm Biomed Anal. 2014 Jan;87:176-90. doi: 10.1016/j.jpba.2013.04.037. Epub 2013 May 6. J Pharm Biomed Anal. 2014. PMID: 23721687 Review.
-
Surface analysis of lipids by mass spectrometry: more than just imaging.Prog Lipid Res. 2013 Oct;52(4):329-53. doi: 10.1016/j.plipres.2013.04.005. Epub 2013 Apr 24. Prog Lipid Res. 2013. PMID: 23623802 Review.
Cited by
-
Technological Innovations in Photochemistry for Organic Synthesis: Flow Chemistry, High-Throughput Experimentation, Scale-up, and Photoelectrochemistry.Chem Rev. 2022 Jan 26;122(2):2752-2906. doi: 10.1021/acs.chemrev.1c00332. Epub 2021 Aug 10. Chem Rev. 2022. PMID: 34375082 Free PMC article. Review.
References
Grants and funding
LinkOut - more resources
Full Text Sources
