Review
. 2020 Sep;4(9):e416-e423.
doi: 10.1016/S2542-5196(20)30178-9.

Climate change could shift disease burden from malaria to arboviruses in Africa

Affiliations
Review

Climate change could shift disease burden from malaria to arboviruses in Africa

Erin A Mordecai et al. Lancet Planet Health. 2020 Sep.

Abstract

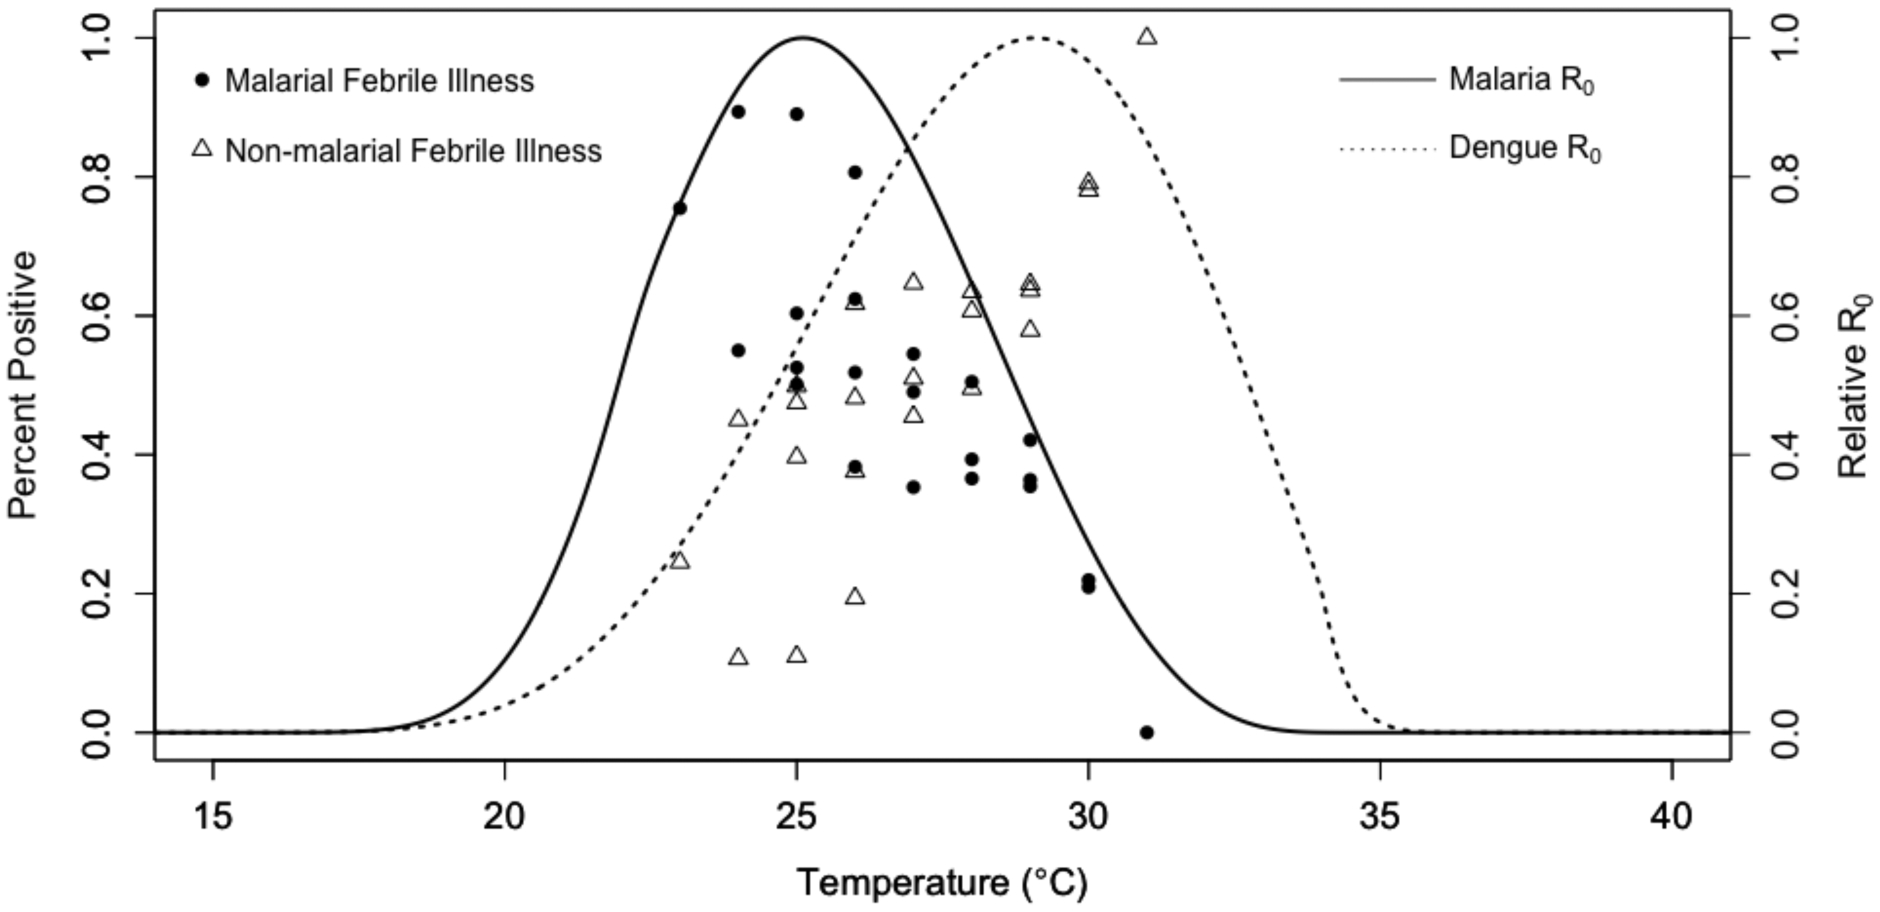
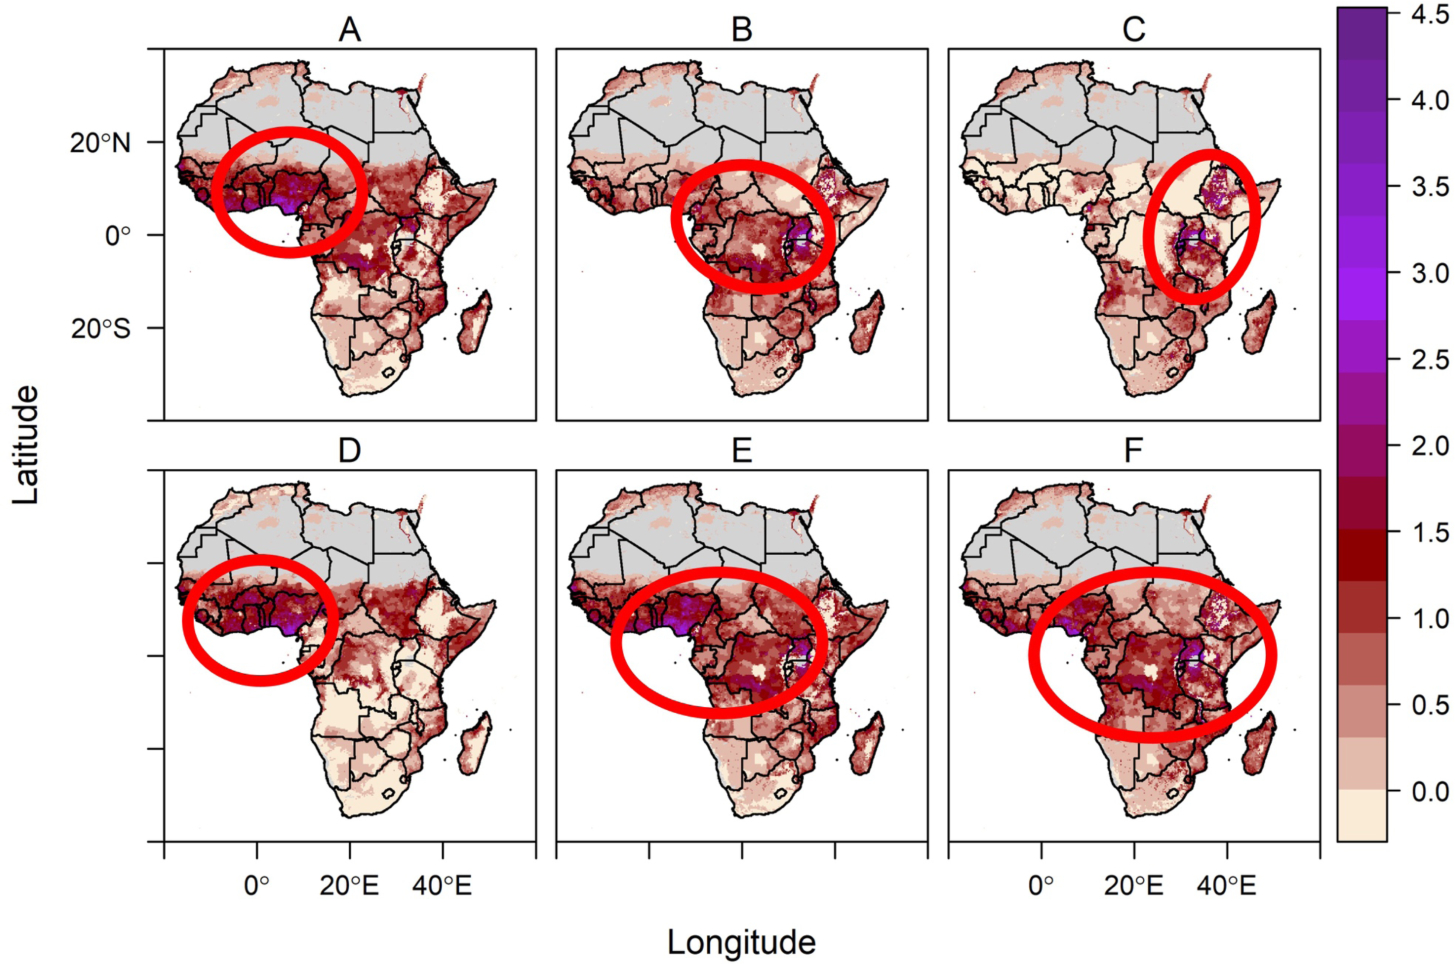
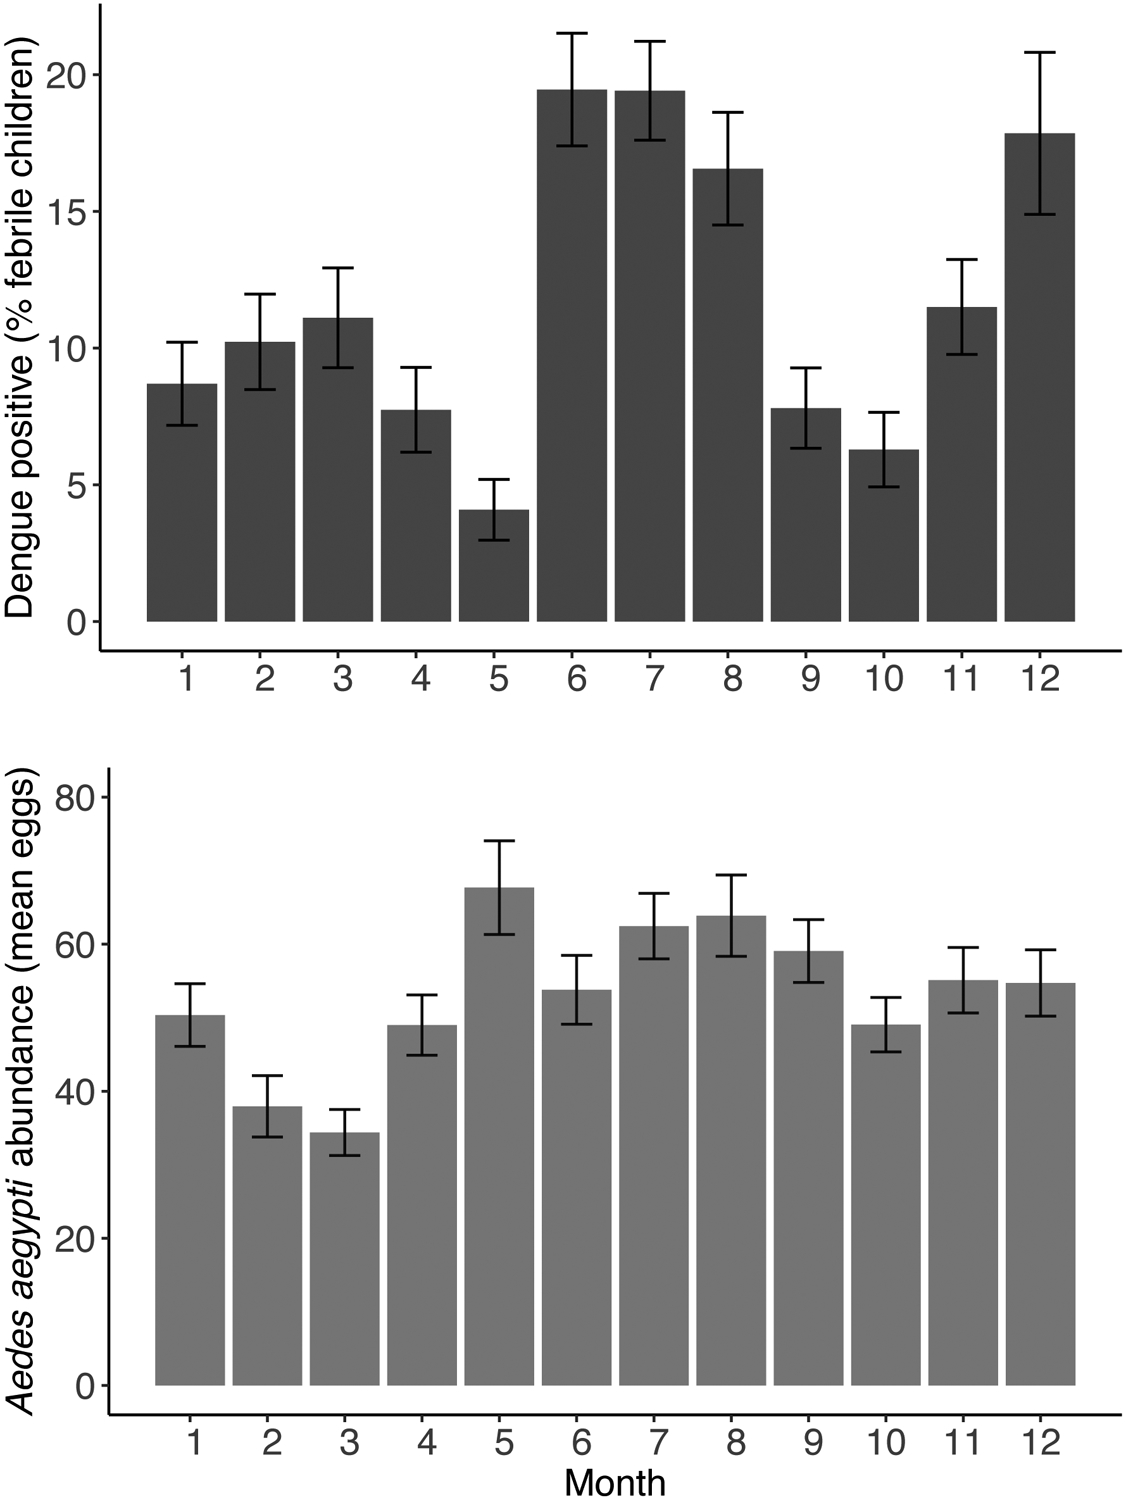
Malaria is a long-standing public health problem in sub-Saharan Africa, whereas arthropod-borne viruses (arboviruses) such as dengue and chikungunya cause an under-recognised burden of disease. Many human and environmental drivers affect the dynamics of vector-borne diseases. In this Personal View, we argue that the direct effects of warming temperatures are likely to promote greater environmental suitability for dengue and other arbovirus transmission by Aedes aegypti and reduce suitability for malaria transmission by Anopheles gambiae. Environmentally driven changes in disease dynamics will be complex and multifaceted, but given that current public efforts are targeted to malaria control, we highlight Ae aegypti and dengue, chikungunya, and other arboviruses as potential emerging public health threats in sub-Saharan Africa.


Conflict of interest statement

Declaration of Interests: The authors declare no conflicts of interest.

Figures

Figure 1.
Figure 1.. Malarial and non-malarial fever among Kenyan children from 2014–2018 versus temperature, overlaid on basic reproduction number curves for malaria and dengue.
Points represent proportion of children with positive malaria smears (filled circles) and proportion of children with non-malarial fever (open triangles) over temperature. Land surface temperatures at each participant visit were calculated as 30-day mean temperatures lagged by one month (the time window in which we expect temperature to affect transmission), specific to each of the four clinic sites. Proportions were calculated at 1°C intervals of temperature (x-axis) at each of the four different outpatient clinic sites in western and coastal Kenya where children with undifferentiated fever were recruited, for up to four points per temperature bin (,–36). Lines represent predicted basic reproduction number (R0, rescaled to range from zero to one) for malaria (solid line) and dengue (dashed line) as a function of temperature from ecological models based on laboratory mosquito and parasite data (–17). For methods detail, see Supplementary Materials, pages 2–3.
Figure 2.
Figure 2.
Temperature-driven malaria risk hotspot (red circles; top row [A-C]) shifts to high elevations in East Africa while Aedes aegypti-transmitted arbovirus risk hotspot (red circles; bottom row [D-F]) expands throughout sub-Saharan Africa from current (left column [A, D]) to 2050 (middle column [B, E]) to 2080 (right column [C, F]). Color scale indicates the number of months per year predicted to have highly suitable (relative R0 > 0.5) temperatures for transmission, multiplied by population density (log(1 + population density)), for a scaled index of person-months of high risk for transmission. Temperature suitability for transmission is based on the upper 50th percentile of relative R0 from temperature-dependent R0 models (15,16). All climate projections are based on the business as usual climate scenario RCP 8.5, using the HadGEM2-ES General Circulation Model. The red circles indicating hotspots are shown to ease visualization of the areas of highest person-months of risk. An aridity mask (gray) blocks out regions that are too dry for malaria transmission (39). This figure is intended to illustrate one possible scenario of temperature-driven risk, rather than making a specific prediction about future disease burden, which additionally depends on moisture availability, human population growth and mobility, and other factors. For Methods details, see Supplementary Materials, pages 4–8.
Figure 3.
Figure 3.. High rates of dengue virus infection in febrile children (A) and consistently high abundance of Aedes aegypti mosquitoes (B) in four villages in Kenya suggests that arboviruses are an underrecognized public health burden.
The rates of dengue positivity (A) are measured as the percentage of children <18 years of age with undifferentiated febrile illness attending outpatient care who tested positive by PCR or IgG ELISA for dengue virus infection (69). Data were compiled from four different clinics in western and coastal Kenya during each calendar month between 2014 and 2018. Aedes aegypti abundance (B) was measured as the monthly average number of Aedes aegypti eggs per household recovered from ovitraps placed in and around houses. Error bars indicate standard errors of the mean. For Methods, see Supplementary Materials, page 3.

Comment in

Similar articles

Cited by

References

    1. Rogers DJ, Randolph SE. Climate change and vector-borne diseases. Adv Parasitol. 2006;62:345–81. - PubMed
    1. Liu-Helmersson J, Stenlund H, Wilder-Smith A, Rocklöv J. Vectorial capacity of Aedes aegypti: effects of temperature and implications for global dengue epidemic potential. PLoS ONE. 2014. March 6;9(3):e89783. - PMC - PubMed
    1. Altizer S, Ostfeld RS, Johnson PTJ, Kutz S, Harvell CD. Climate Change and Infectious Diseases: From Evidence to a Predictive Framework. Science. 2013. August 2;341(6145):514–9. - PubMed
    1. Parham P, Michael E. Modeling the Effects of Weather and Climate Change on Malaria Transmission. Environ Health Perspect. 2010;118(5):620–6. - PMC - PubMed
    1. Bhatt S, Weiss DJ, Cameron E, Bisanzio D, Mappin B, Dalrymple U, et al. The effect of malaria control on Plasmodium falciparum in Africa between 2000 and 2015. Nature. 2015. September 16;526:207–11. - PMC - PubMed

Publication types