

Geometric Perfusion Deficits: A Novel OCT Angiography Biomarker for Diabetic Retinopathy Based on Oxygen Diffusion
- PMID: 32918905
- PMCID: PMC8015788
- DOI: 10.1016/j.ajo.2020.09.007
Geometric Perfusion Deficits: A Novel OCT Angiography Biomarker for Diabetic Retinopathy Based on Oxygen Diffusion
Abstract
Purpose: To develop geometric perfusion deficits (GPD), an optical coherence tomography angiography (OCTA) biomarker based on oxygen diffusion, and to evaluate its utility in a pilot study of healthy subjects and patients with diabetic retinopathy (DR).
Design: Retrospective cross-sectional study.
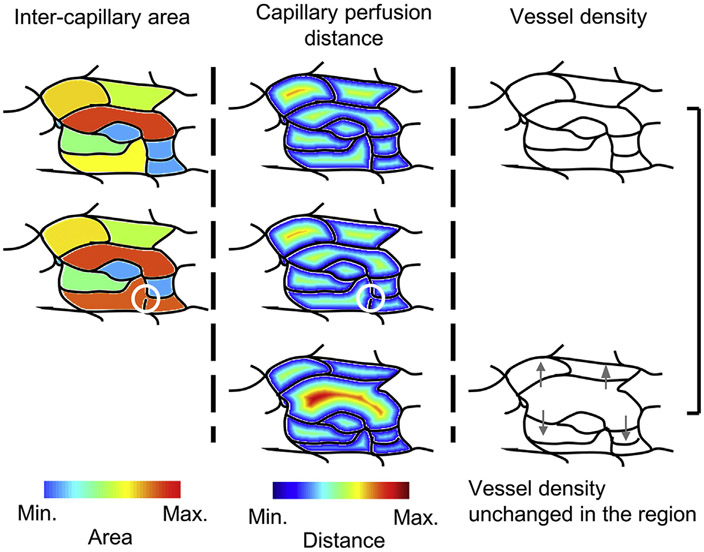
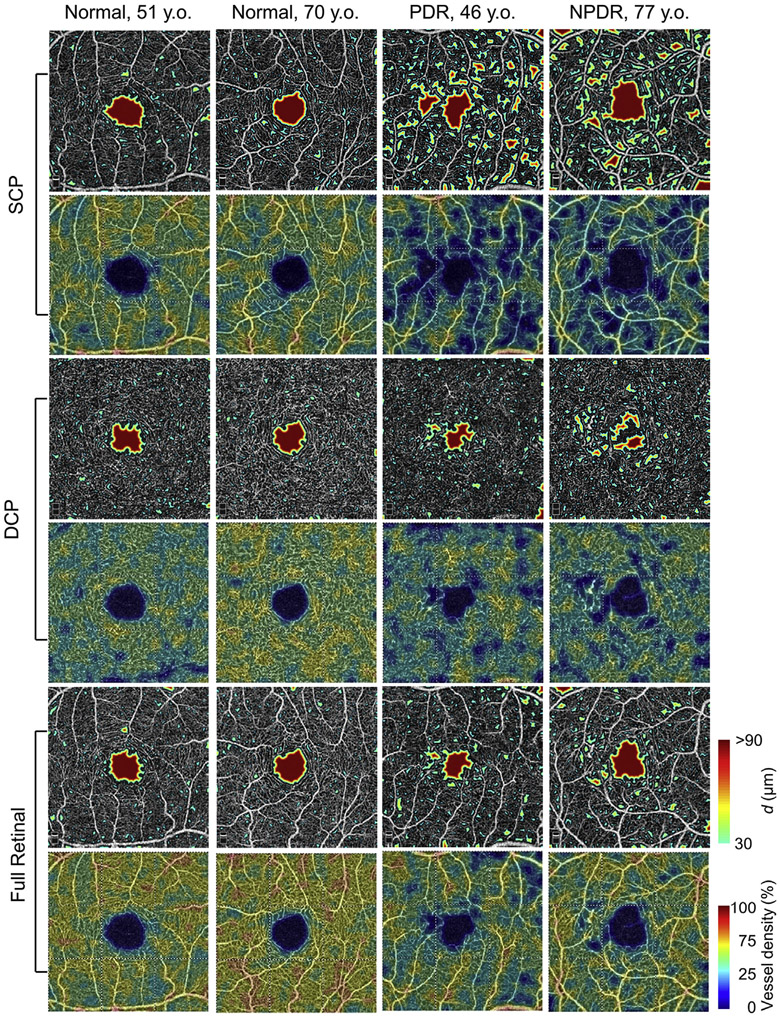
Methods: Commercial spectral-domain optical coherence tomography angiography (OCTA) instruments were used to acquire repeated 3 × 3-mm2 and 6 × 6-mm2 motion-corrected macular OCTA volumes. En face OCTA images corresponding to the superficial capillary plexus (SCP), deep capillary plexus (DCP), and full retinal projections were obtained using automatic segmentation. For each projection, the GPD percentage and the vessel density percentage, the control metric, were computed, and their values were compared between the normal and DR eyes. The repeated OCTA acquisitions were used to assess the test-retest repeatability of the GPD and vessel density percentages.
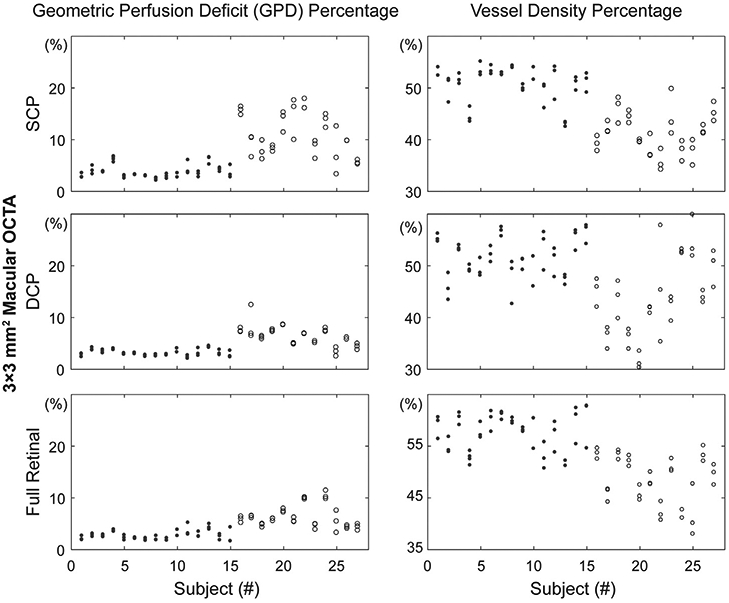
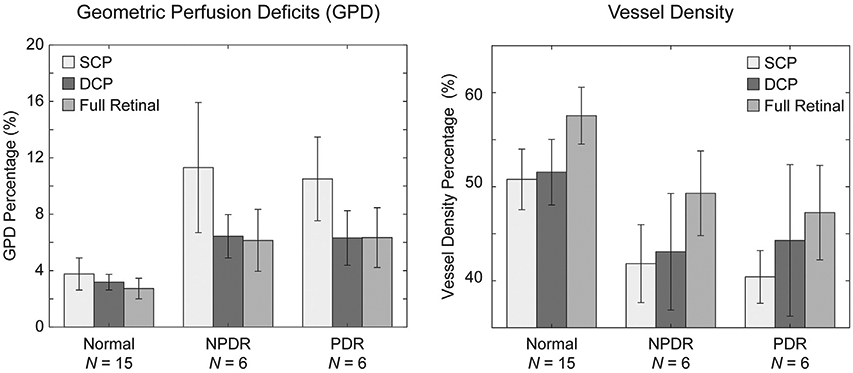
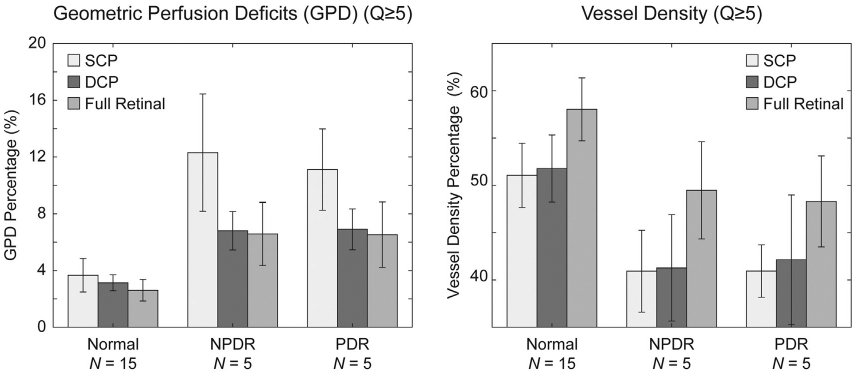
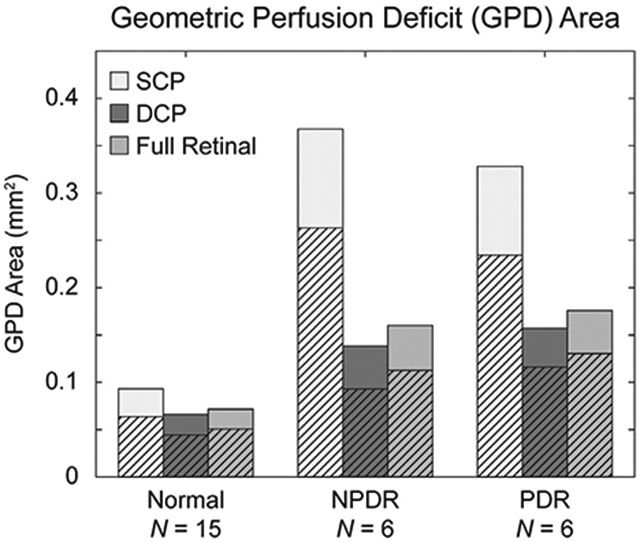
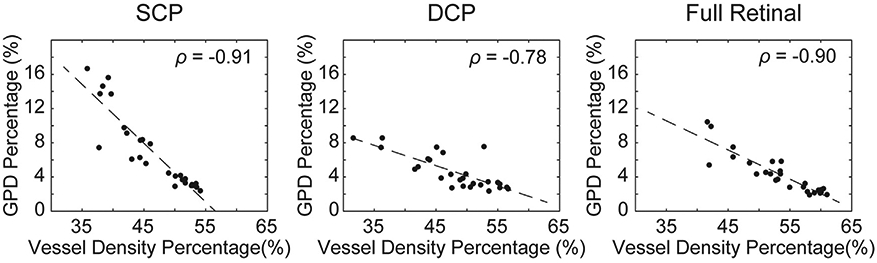
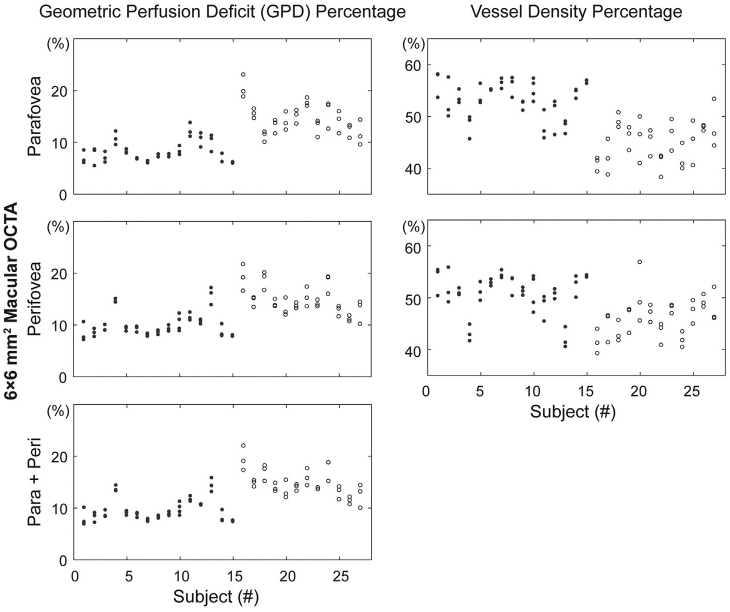
Results: Repeated OCTA scans of 15 normal eyes and 12 DR eyes were obtained. For all en face projections, GPD percentages were significantly higher in DR eyes than in normal eyes; vessel density percentages were significantly lower in all but 1 projection (DCP). Large GPD areas were used to identify focal perfusion deficits. Test-retest analysis showed that the GPD percentage had superior repeatability than the vessel density percentage in most cases. A strong negative correlation between the GPD percentage and the vessel density percentage was also found.
Conclusions: Geometric perfusion deficits, an OCTA biomarker based on oxygen diffusion, provides a quantitative metric of macular microvascular remodeling with a strong physiological underpinning. The GPD percentage may serve as a useful biomarker for detecting and monitoring DR.
Copyright © 2020 Elsevier Inc. All rights reserved.
Figures
Similar articles
-
Deep Capillary Geometric Perfusion Deficits on OCT Angiography Detect Clinically Referable Eyes with Diabetic Retinopathy.Ophthalmol Retina. 2022 Dec;6(12):1194-1205. doi: 10.1016/j.oret.2022.05.028. Epub 2022 Jun 2. Ophthalmol Retina. 2022. PMID: 35661804 Free PMC article.
-
Macular Capillary Perfusion in Chinese Patients With Diabetic Retinopathy Obtained With Optical Coherence Tomography Angiography.Ophthalmic Surg Lasers Imaging Retina. 2019 Apr 1;50(4):e88-e95. doi: 10.3928/23258160-20190401-12. Ophthalmic Surg Lasers Imaging Retina. 2019. PMID: 30998251
-
Volumetric Measures of Capillary Nonperfusion on Optical Coherence Tomography Angiography Detect Early Ischemia in Diabetes Without Retinopathy.Invest Ophthalmol Vis Sci. 2025 Apr 1;66(4):2. doi: 10.1167/iovs.66.4.2. Invest Ophthalmol Vis Sci. 2025. PMID: 40168154 Free PMC article.
-
Early Detection of Microvascular Impairments With Optical Coherence Tomography Angiography in Diabetic Patients Without Clinical Retinopathy: A Meta-analysis.Am J Ophthalmol. 2021 Feb;222:226-237. doi: 10.1016/j.ajo.2020.09.032. Epub 2020 Sep 22. Am J Ophthalmol. 2021. PMID: 32976846
-
Application of optical coherence tomography angiography in diabetic retinopathy: a comprehensive review.Can J Ophthalmol. 2019 Oct;54(5):519-528. doi: 10.1016/j.jcjo.2019.02.010. Epub 2019 Apr 8. Can J Ophthalmol. 2019. PMID: 31564340 Review.
Cited by
-
Retinal Mid-Peripheral Capillary Free Zones Are Enlarged in Diabetic Patients With No Evidence of Clinical Retinopathy.Transl Vis Sci Technol. 2025 Jul 1;14(7):10. doi: 10.1167/tvst.14.7.10. Transl Vis Sci Technol. 2025. PMID: 40673733 Free PMC article.
-
Glaucoma detection using non-perfused areas in OCTA.Sci Rep. 2024 May 5;14(1):10306. doi: 10.1038/s41598-024-60839-4. Sci Rep. 2024. PMID: 38705883 Free PMC article.
-
OCT angiography and its retinal biomarkers [Invited].Biomed Opt Express. 2023 Aug 10;14(9):4542-4566. doi: 10.1364/BOE.495627. eCollection 2023 Sep 1. Biomed Opt Express. 2023. PMID: 37791289 Free PMC article. Review.
-
Perivenular Capillary Rarefaction in Diabetic Retinopathy: Interdevice Characterization and Association to Clinical Staging.Ophthalmol Sci. 2023 Jan 3;3(2):100269. doi: 10.1016/j.xops.2023.100269. eCollection 2023 Jun. Ophthalmol Sci. 2023. PMID: 36875334 Free PMC article.
-
The Impact of Hypertension on Macular Perfusion in Patients With Referable Diabetic Retinopathy: An OCTA Analysis.Transl Vis Sci Technol. 2025 Jul 1;14(7):2. doi: 10.1167/tvst.14.7.2. Transl Vis Sci Technol. 2025. PMID: 40590780 Free PMC article.
References
-
- Hammes H-P, Lin J, Renner O, et al. Pericytes and the pathogenesis of diabetic retinopathy. Diabetes 2002;51(10): 3107–3112. - PubMed
-
- Frank RN. Diabetic retinopathy. N Engl J Med 2004;350(1): 48–58. - PubMed
-
- Aiello LP, Avery RL, Arrigg PG, et al. Vascular endothelial growth factor in ocular fluid of patients with diabetic retinopathy and other retinal disorders. N Engl J Med 1994;331(22): 1480–1487. - PubMed
-
- Early Treatment Diabetic Retinopathy Study Research Group. Classification of diabetic retinopathy from fluorescein angiograms: ETDRS report number 11. Ophthalmology 1991; 98(5, Supplement):807–822. - PubMed
-
- Conrath J, Giorgi R, Raccah D, Ridings B. Foveal avascular zone in diabetic retinopathy: quantitative vs qualitative assessment. Eye 2005;19(3):322–326. - PubMed
Publication types
MeSH terms
Substances
Grants and funding
LinkOut - more resources
Full Text Sources
Other Literature Sources
Medical
Research Materials
Miscellaneous
