. 2020 Dec:42:101079.
doi: 10.1016/j.molmet.2020.101079. Epub 2020 Sep 9.

Maternal obesity causes fetal hypothalamic insulin resistance and disrupts development of hypothalamic feeding pathways

Affiliations

Maternal obesity causes fetal hypothalamic insulin resistance and disrupts development of hypothalamic feeding pathways

L Dearden et al. Mol Metab. 2020 Dec.

Abstract

Objective: Perinatal exposure to maternal obesity results in predisposition of offspring to develop obesity later in life. Increased weight gain in offspring exposed to maternal obesity is usually associated with hyperphagia, implicating altered central regulation of food intake as a cause. We aimed to define how maternal obesity impacts early development of the hypothalamus to program lasting dysfunction in feeding regulatory pathways.

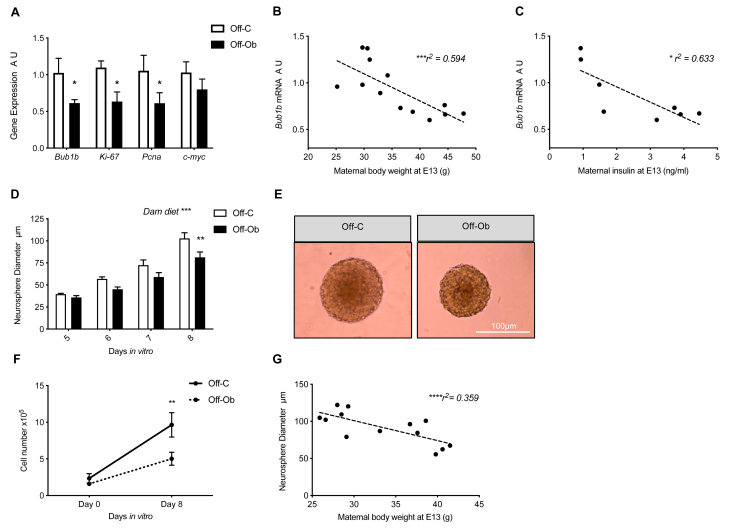
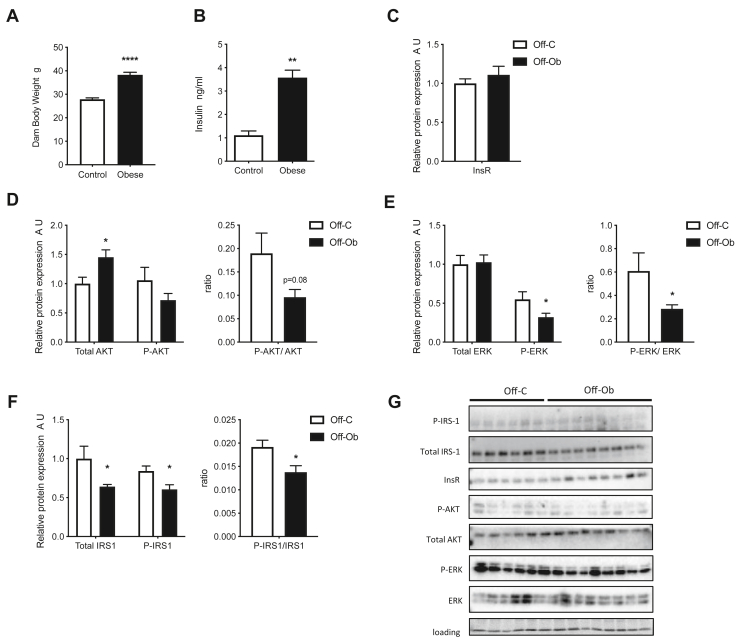
Methods: Mice offspring of diet-induced obese mothers were compared to the offspring of lean control mothers. We analysed gene expression in the fetal hypothalamus, alongside neurosphere assays to investigate the effects of maternal obesity on neural progenitor cell proliferation in vitro. Western blotting was used to investigate the insulin signalling pathway in the fetal hypothalamus. Characterisation of cell type and neuropeptide profile in adulthood was linked with analyses of feeding behaviour.

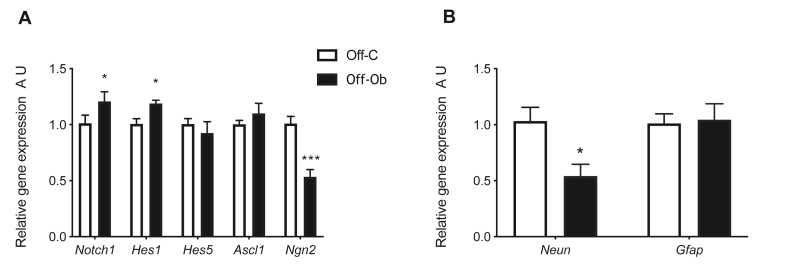
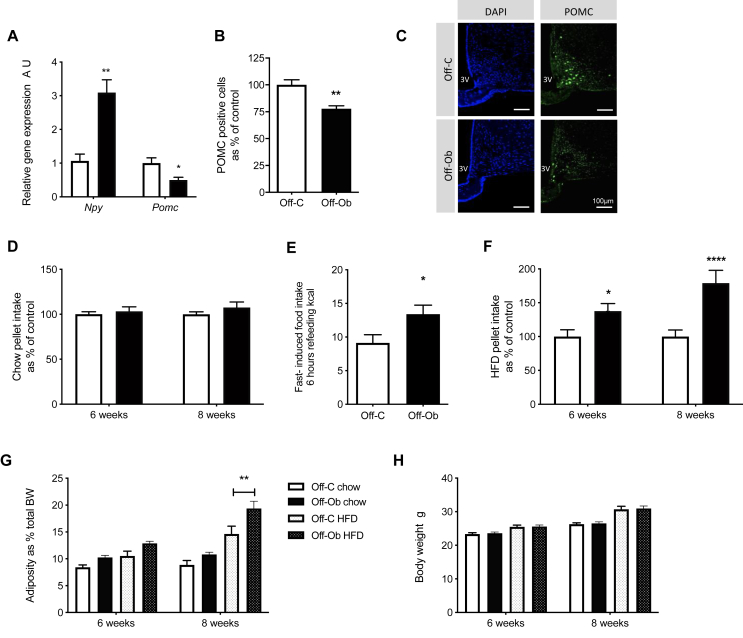
Results: There was a reduction in the expression of proliferative genes in the fetal hypothalamus of offspring exposed to maternal obesity. This reduction in proliferation was maintained in vitro when hypothalamic neural progenitor cells were grown as neurospheres. Hypothalamic fetal gene expression and neurosphere growth correlated with maternal body weight and insulin levels. Foetuses of obese mothers showed hypothalamic insulin resistance, which may be causative of reduced proliferation. Furthermore, maternal obesity activated the Notch signalling pathway in neonatal offspring hypothalamus, resulting in decreased neurogenesis. Adult offspring of obese mothers displayed an altered ratio of anorexigenic and orexigenic signals in the arcuate nucleus, associated with an inability to maintain energy homeostasis when metabolically challenged.

Conclusions: These findings show that maternal obesity alters the molecular signature in the developing hypothalamus, which is associated with disrupted growth and development of hypothalamic precursor cells and defective feeding regulation in adulthood. This is the first report of fetal hypothalamic insulin resistance in an obese pregnancy and suggests a mechanism by which maternal obesity causes permanent changes to hypothalamic structure and function.

Keywords: Hypothalamus; Insulin; Maternal obesity; Neurogenesis; Notch.


Figures

Figure 1
Figure 1
Maternal obesity reduces proliferation of hypothalamic neural progenitor cells. A) Quantitative real-time PCR analysis of Bub1b, Ki67, Pcna and Cmyc in fetal hypothalamic tissue (A.U., expressed as relative to Off-C, n = 6–7) B) Correlation between maternal body weight (g) at E13 and fetal hypothalamic expression of Bub1b (n = 13) C) Correlation between maternal serum insulin (ng/ml) at E13 and fetal hypothalamic expression of Bub1b (n = 8) D) Diameter of neurospheres grown from fetal hypothalamic NPC after 5–8 DIV (significant effect of dam diet over time course by two-way ANOVA; n = 7–8) E) Representative images of neurospheres grown from control and obese fetal hypothalamus after 8 DIV (scale bar = 100 μm) F) Dissociated cell number at the beginning of neurosphere culture (0DIV) and after 8DIV (n = 7) G) Correlation between maternal body weight (g) at E13 and neurosphere width after 8 DIV (n = 13). Off-C = white bars or solid line, Off-Ob = black bars or dashed line. Data are presented as mean +/− SEM. ∗p < 0.05, ∗∗p < 0.01, ∗∗∗p < 0.001. Outlier was excluded from (A) Pcna; Off-C (Grubb's method, alpha = 0.2, G = 2.198, outlier excluded value 4.42).
Figure 2
Figure 2
Maternal obesity impacts on fetal hypothalamic insulin signalling pathways. A) Maternal body weight (g) and B) fed serum insulin levels (ng/ml) on embryonic day 13 (n = 4–7) C) Expression of InsR protein in fetal hypothalamus (A.U., expressed as relative to Off-C; n = 6–8) D-F) Expression of total protein and phosphorylated protein (A.U., expressed as relative to Off-C) and the ratio of phosphorylated/total protein for AKT, ERK and IRS1 (n = 6–8) G) Images of western blots represented by graphs in Figure 2 plus loading control. A-B) Control dam = white bars, Obese dam = black bars. C–F) Off-C = white bars, Off-Ob = black bars. b chow = black bars, Off-C HFD = white patterned bars, Off-Ob HFD = black patterned bars. Data are presented as mean +/− SEM. ∗p < 0.05, ∗∗p < 0.01, ∗∗∗∗p < 0.0001. Outlier was excluded from (B) control (Grubb's method, alpha = 0.2, G = 1.493, outlier excluded value = 6.621).
Figure 3
Figure 3
Exposure to maternal obesity activates the hypothalamic Notch signalling pathway and reduces neuronal markers. A) Quantitative real-time PCR analysis of Notch1, Hes1, Hes5, Ascl1 and Ngn2 in neonatal hypothalamic tissue (A.U., expressed as relative to Off-C, n = 5–6) B) Quantitative real-time PCR analysis of NeuN and Gfap in the neonatal hypothalamic tissue (A.U., expressed as relative to Off-C, n = 5–6). Off-C = white bars, Off-Ob = black bars. Data are presented as mean +/− SEM. ∗p < 0.05,∗∗∗p < 0.001.
Figure 4
Figure 4
Altered hypothalamic development is associated with disrupted feeding control and increased adiposity in offspring of obese mothers in adulthood. A) Quantitative real-time PCR analysis of Npy and Pomc in arcuate nucleus of 8-week-old mice (A.U., expressed as relative to Off-C, n = 5–6) B) Number of POMC-positive cells in arcuate nucleus of 8-week-old mice as asssessed by immunofluorescence (A.U., expressed as relative to Off-C, n = 5–6) C) Representative images of POMC staining in the ARC of 8 week old offspring of control and obese mothers (scale bar = 100 μm) D) Ad lib intake of chow pellet in offspring at 6 and 8 weeks of age (A.U., expressed as relative to Off-C, n = 15) E) 6-h cumulative food intake of chow pellet after overnight fast (kCal, n = 7–10) F) Ad lib intake of HFD pellet in offspring at 6 and 8 weeks of age (A.U., expressed as relative to Off-C, n = 20) G) Adipose tissue mass as percentage of total body weight in offspring at 6 and 8 weeks of age (n = 13, 12, 20, 13) H) Body weight in offspring at 6 and 8 weeks of age (n = 14, 13, 21, 15). A-F) Off-C = white bars, Off-Ob = black bars. G&H) Off-C chow = white bars, Off-Ob chow = black bars, Off-C HFD = white patterned bars, Off-Ob HFD = black patterned bars. Data are presented as mean +/− SEM. ∗p < 0.05,∗∗p < 0.01, ∗∗∗∗p < 0.0001. Outlier was excluded from (A) Npy; Off-Ob (Grubb's method, alpha = 0.2, G = 1.739, outlier excluded value 0.08), and (E) Off-C (Grubb's method, alpha = 0.2, G = 2.512, outlier excluded value = 29.6).

Similar articles

Cited by

References

    1. Davies S. Department of Health; London: 2015. Annual report of the chief medical officer, 2014, the Health of the 51%: women.
    1. Perng W., Oken E., Dabelea D. Developmental overnutrition and obesity and type 2 diabetes in offspring. Diabetologia. 2019;62(10):1779–1788. - PubMed
    1. Smith J., Cianflone K., Biron S., Hould F.S., Lebel S., Marceau S. Effects of maternal surgical weight loss in mothers on intergenerational transmission of obesity. Journal of Clinical Endocrinology & Metabolism. 2009;94(11):4275–4283. - PubMed
    1. Dearden L., Ozanne S.E. Early life origins of metabolic disease: developmental programming of hypothalamic pathways controlling energy homeostasis. Frontiers in Neuroendocrinology. 2015;39:3–16. - PubMed
    1. van der Klaauw A.A., Croizier S., Mendes de Oliveira E., Stadler L.K.J., Park S., Kong Y. Human semaphorin 3 variants link melanocortin circuit development and energy balance. Cell. 2019;176(4):729–742. - PMC - PubMed

Publication types

MeSH terms