. 2020 Sep-Oct;131(1-2):267-276.
doi: 10.1016/j.ymgme.2020.08.006. Epub 2020 Sep 3.

Prospective evaluation of kidney and liver disease in autosomal recessive polycystic kidney disease-congenital hepatic fibrosis

Affiliations

Prospective evaluation of kidney and liver disease in autosomal recessive polycystic kidney disease-congenital hepatic fibrosis

Nehna Abdul Majeed et al. Mol Genet Metab. 2020 Sep-Oct.

Abstract

Background and objectives: We have previously published the characteristics of kidney and liver disease in a cohort of 73 individuals with molecularly confirmed autosomal recessive polycystic kidney disease-congenital hepatic fibrosis, based upon cross-sectional data. Here, we present prospective data on the same cohort.

Design, setting, participants, and measurements: Comprehensive biochemical and imaging data on progression of kidney and liver disease in 60 of the 73 patients were prospectively collected at the NIH Clinical Center on multiple visits between 2003 and 2019.

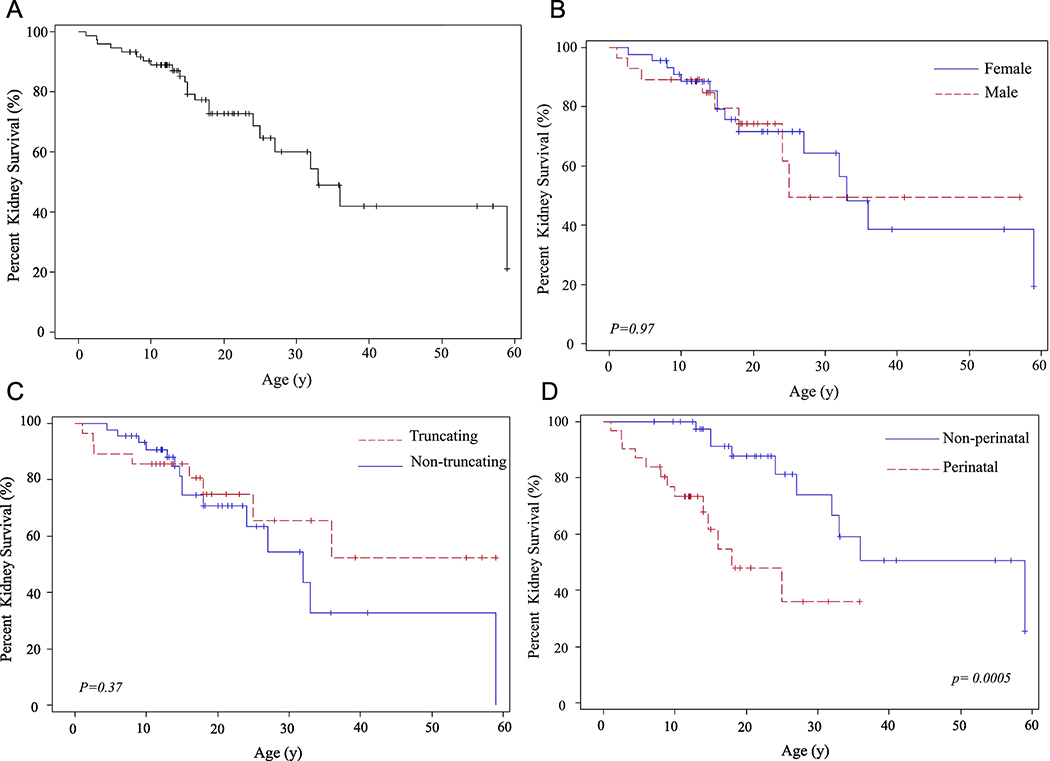
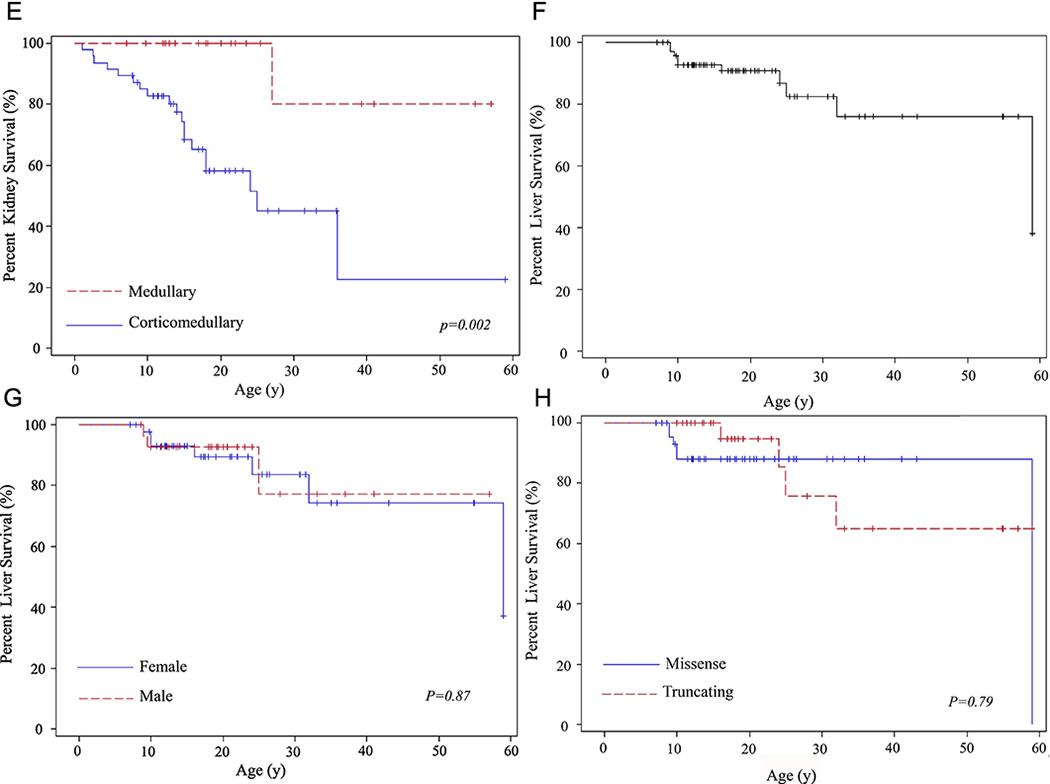
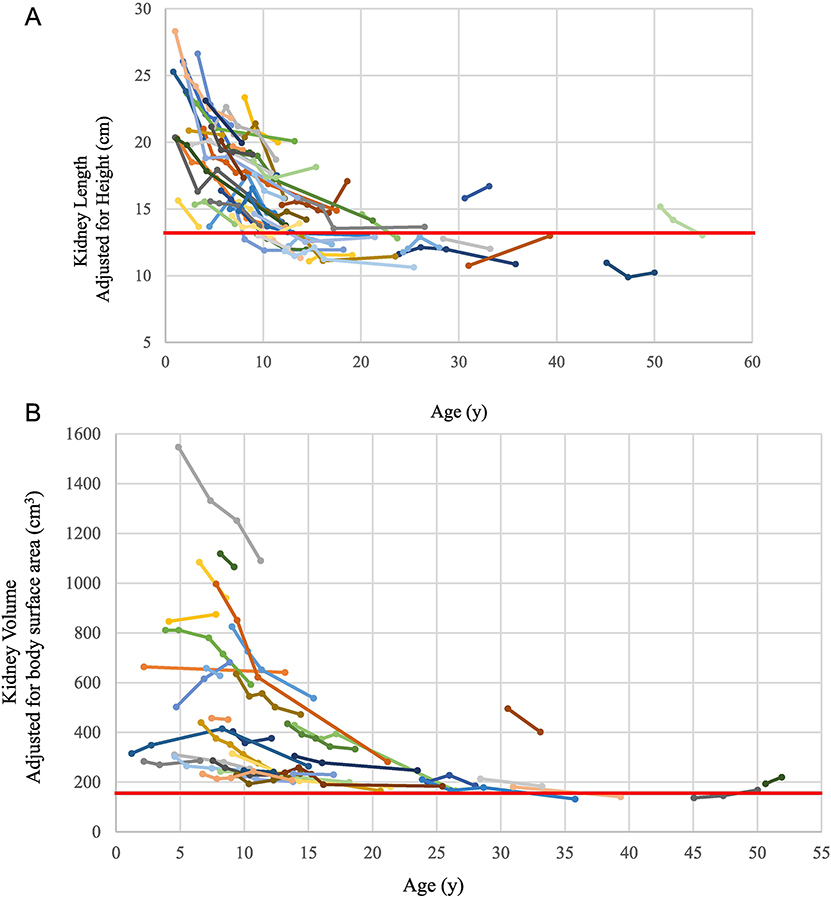
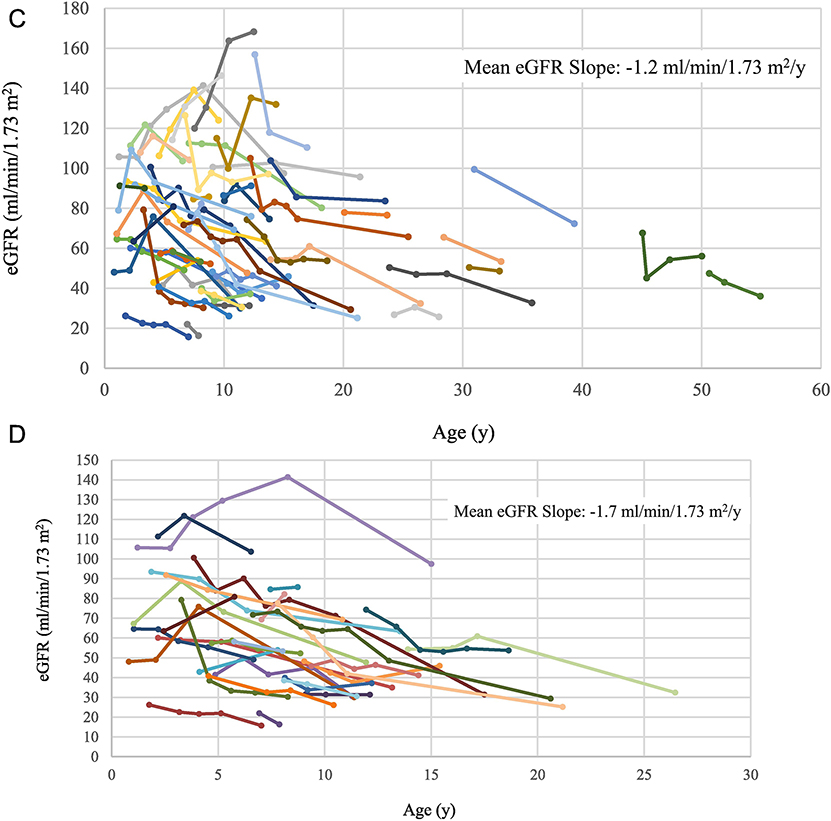
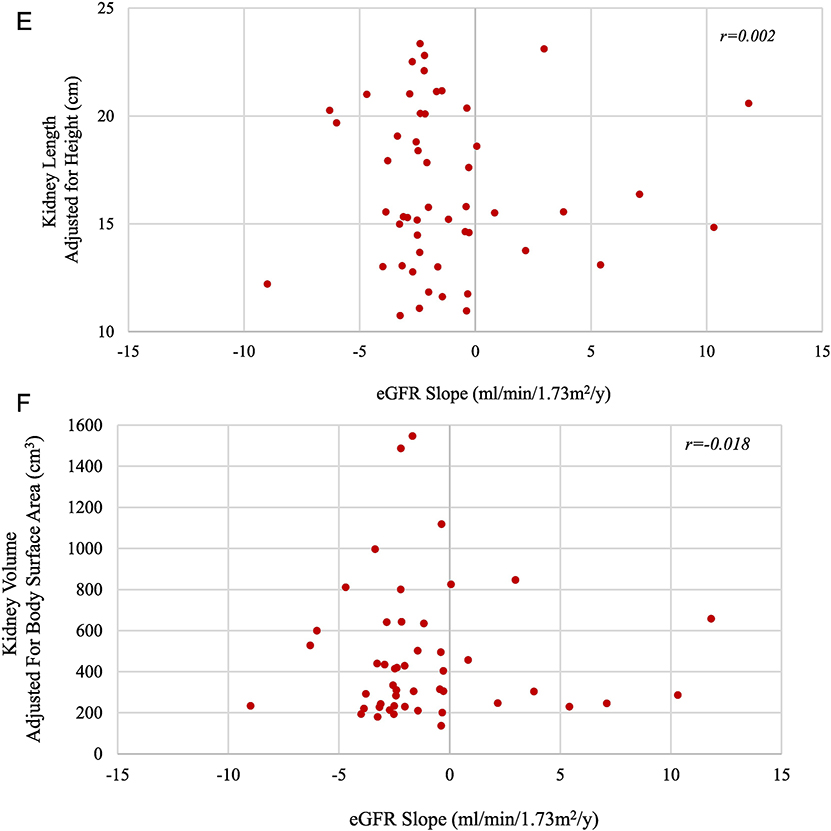
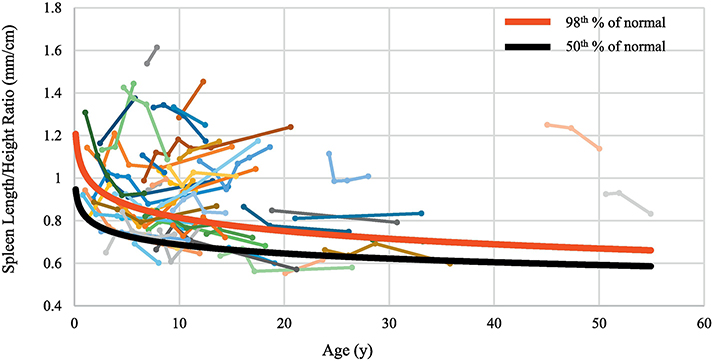
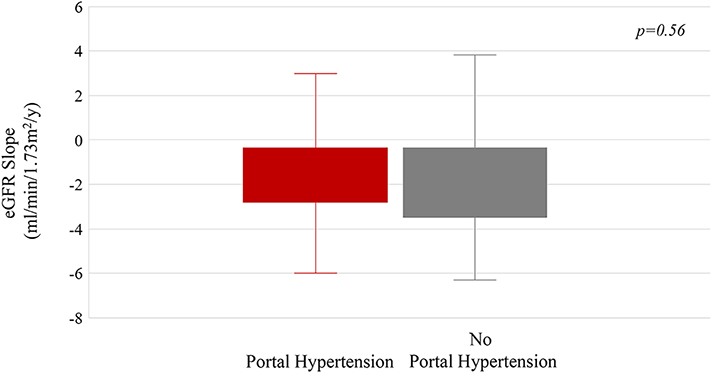
Results and conclusions: Of the 73 patients, 23 received a renal allograft at an average age of 17.5 years and 10 underwent liver transplantation at an average age of 20.3 years. Patients who presented perinatally and those who had corticomedullary disease required kidney transplantation significantly earlier. The mean eGFR slope in patients with corticomedullary disease was -1.6 ml/min/1.73 m2/y, in comparison to -0.6 ml/min/1.73 m2/y in those with medullary disease. Kidney size remained the same over time and normalized to the upper limit of normal by 20-25 years of age. The extent of renal disease on ultrasound remained largely unchanged; no patient progressed from the "medullary" to the "corticomedullary" group. There was no correlation between eGFR slope and kidney size. The synthetic function of the liver remained largely intact even in patients with advanced portal hypertension. Based on spleen length/height ratio, two thirds of patients had portal hypertension which remained stable in 39% and worsened in 61%. Patients with portal hypertension had lower platelet counts and relatively higher levels of AST, GGT, direct bilirubin and ammonia. The progression rates of kidney and liver disease were independent of each other. Patients with bi-allelic non-truncating PKHD1 variants had similar progression of kidney and liver disease in comparison to those who were compound heterozygous for a non-truncating and a truncating variant.


Figures

Figure 1.
Figure 1.. Kidney and liver survival rates based on age at organ transplantation.
A) Percent kidney survival of the entire cohort of 73 patients. B) Kidney survival rates in males and females. C) Kidney survival rates in patients with “truncating” and “non-truncating” PKHD1 variants D) Kidney survival rates in patients who became symptomatic perinatally in comparison to those who presented after 1 month of age. E) Kidney survival rates in patients with “corticomedullary” disease compared to those with “medullary” disease. F) Liver survival of the entire cohort of 73 patients. G) Liver survival rates in males and females. H) Liver survival rates in patients with missense (“non-truncating”) and “truncating” PKHD1 variants.
Figure 2.
Figure 2.. Changes in kidney size and function as ARPKD patients grow older.
A) Changes in kidney length by age. Each group of dots connected by the same color line represents height-adjusted kidney length measurements of the same patient at multiple NIH visits. The red line represents the upper limit of normal kidney length for an average size adult. B) Changes in kidney volume by age. Each group of dots connected by the same color line represents the body surface area-adjusted kidney volume measurements of the same patient at multiple NIH visits. The red line represents the upper limit of normal kidney volume in an average size adult. C) Changes in eGFR by age of all patients with multiple NIH evaluations. Each group of dots connected by the same color line represents the eGFR values of the same patient calculated at multiple NIH visits. D) Changes in eGFR by age for children with corticomedullary disease. E) Height-adjusted kidney length on USG at first NIH visit plotted against the eGFR slope calculated based on multiple NIH visits. F) Kidney volume adjusted for body surface area based on MRI at first NIH visit plotted against the eGFR slope based on multiple NIH visits.
Figure 3.
Figure 3.. Changes in spleen size as patients with ARPKD grew.
A) Spleen length/height (SL/H) ratio plotted against age. Each group of dots connected by the same color line represents the SL/H ratio of the same patient measured at multiple NIH visits. The red and black lines represent the 98th and 50th percentiles of SL/H ratio in healthy individuals. B) The mean eGFR slopes of patients with and without portal hypertension.

References

    1. Zerres K, Rudnik-Schoneborn S, Deget F, Holtkamp U, Brodehl J, Geisert J, Scharer K: Autosomal recessive polycystic kidney disease in 115 children: clinical presentation, course and influence of gender. Arbeitsgemeinschaft fur Padiatrische, Nephrologie. Acta Paediatr, 85: 437–445, 1996 - PubMed
    1. Roy S, Dillon MJ, Trompeter RS, Barratt TM: Autosomal recessive polycystic kidney disease: long-term outcome of neonatal survivors. Pediatric nephrology, 11: 302–306, 1997 - PubMed
    1. Bergmann C, Senderek J, Windelen E, Kupper F, Middeldorf I, Schneider F, Dornia C, Rudnik-Schoneborn S, Konrad M, Schmitt CP, Seeman T, Neuhaus TJ, Vester U, Kirfel J, Buttner R, Zerres K, Apn: Clinical consequences of PKHD1 mutations in 164 patients with autosomal-recessive polycystic kidney disease (ARPKD). Kidney international, 67: 829–848, 2005 - PubMed
    1. Gunay-Aygun M, Avner ED, Bacallao RL, Choyke PL, Flynn JT, Germino GG, Guay-Woodford L, Harris P, Heller T, Ingelfinger J, Kaskel F, Kleta R, LaRusso NF, Mohan P, Pazour GJ, Shneider BL, Torres VE, Wilson P, Zak C, Zhou J, Gahl WA: Autosomal recessive polycystic kidney disease and congenital hepatic fibrosis: summary statement of a first National Institutes of Health/Office of Rare Diseases conference. The Journal of pediatrics, 149: 159–164, 2006 - PMC - PubMed
    1. Adeva M, El-Youssef M, Rossetti S, Kamath PS, Kubly V, Consugar MB, Milliner DM, King BF, Torres VE, Harris PC: Clinical and molecular characterization defines a broadened spectrum of autosomal recessive polycystic kidney disease (ARPKD). Medicine (Baltimore), 85: 1–21, 2006 - PubMed

Publication types

MeSH terms

Substances

Supplementary concepts