Meta-Analysis
. 2020 Sep 7;91(3):e2020025.
doi: 10.23750/abm.v91i3.10020.

RT-qPCR assays based on saliva rather than on nasopharyngeal swabs are possible but should be interpreted with caution: results from a systematic review and meta-analysis

Affiliations
Meta-Analysis

RT-qPCR assays based on saliva rather than on nasopharyngeal swabs are possible but should be interpreted with caution: results from a systematic review and meta-analysis

Matteo Riccò et al. Acta Biomed. .

Abstract

Background and aim of the work: The ongoing pandemic has elicited an increasing interest regarding the SARS-CoV-2 viral RNA detection in saliva specimens rather than through nasopharyngeal swabs. Our aim was to conduct a meta-analysis on the sensitivity and specificity of SARS-CoV-2 viral RNA detection through RT-qPCR based on salivary specimens compared to conventional nasopharyngeal swabs.

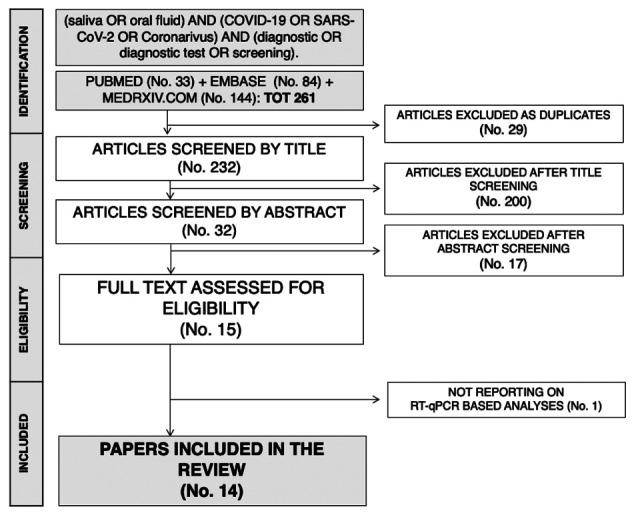
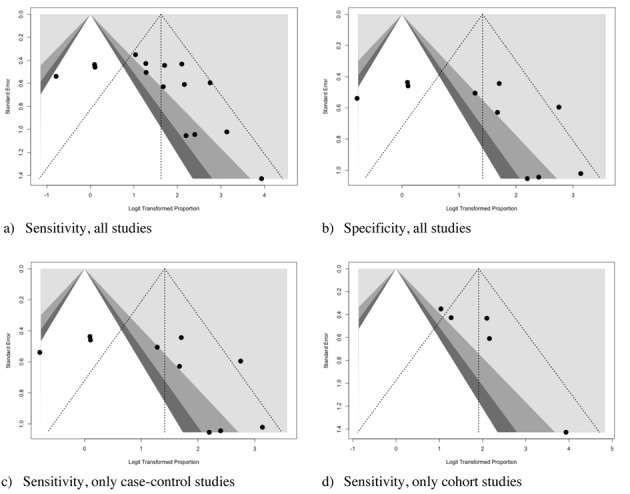
Methods: We reported our meta-analysis according to the PRISMA statement. We searched Pubmed, Embase, and pre-print archive medRxiv.og for eligible studies published up to June 1st, 2020. Raw data included true/false positive and negative tests, and the total number of tests. Sensitivity and specificity data were calculated for every study, and then pooled in a random-effects model. Heterogeneity was assessed using the I2 measure. Reporting bias was assessed by means of funnel plots and regression analysis.

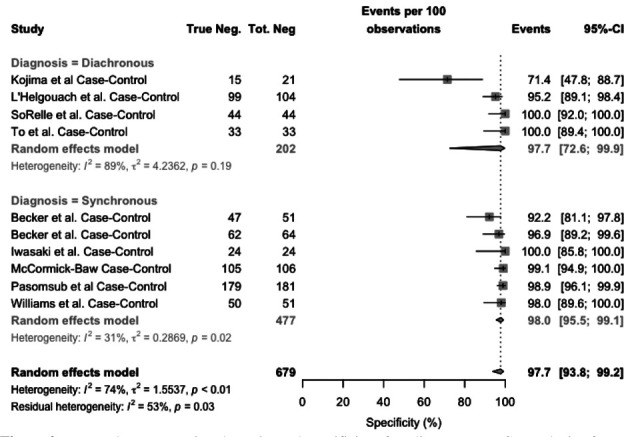
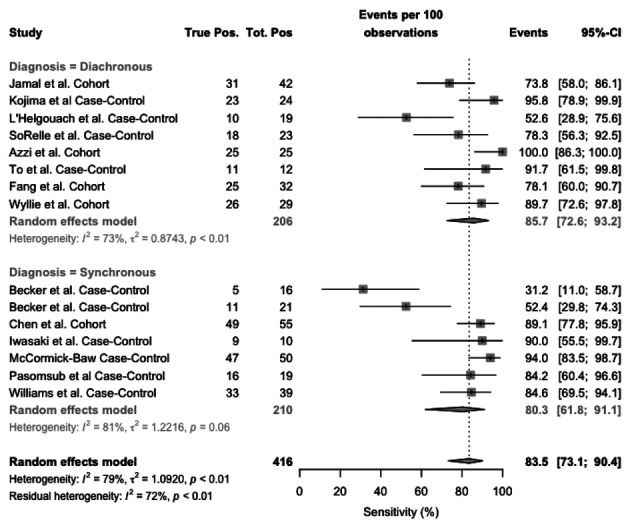
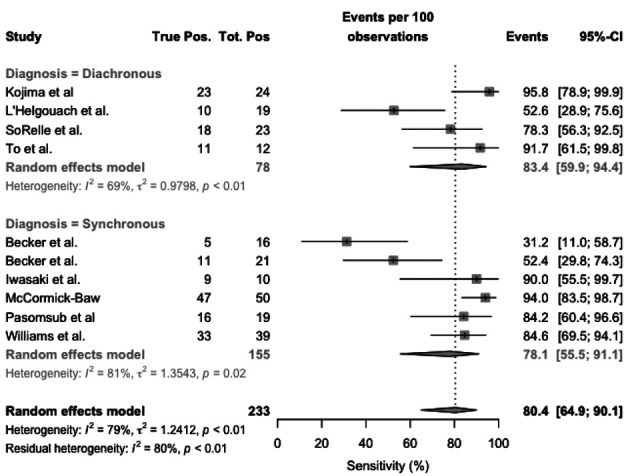
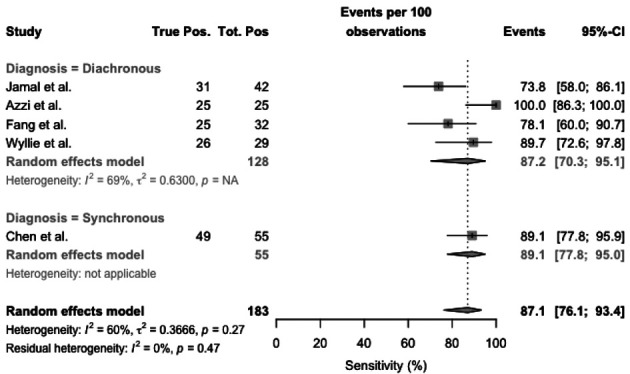
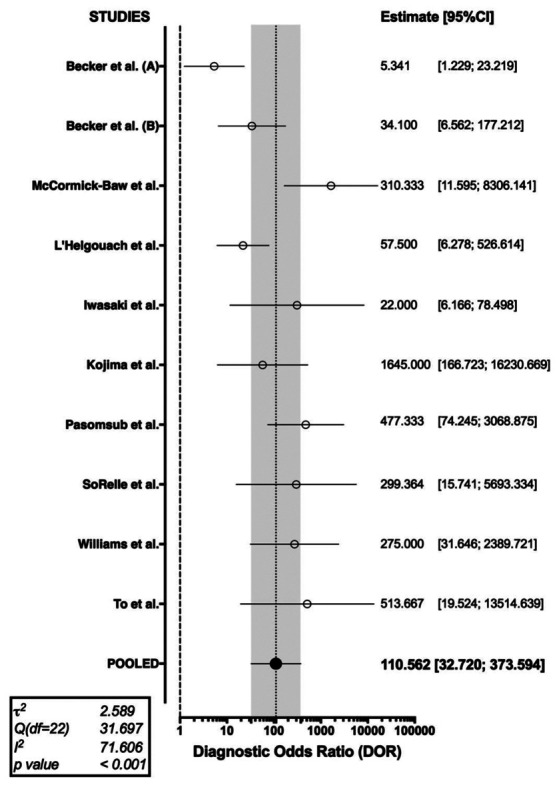
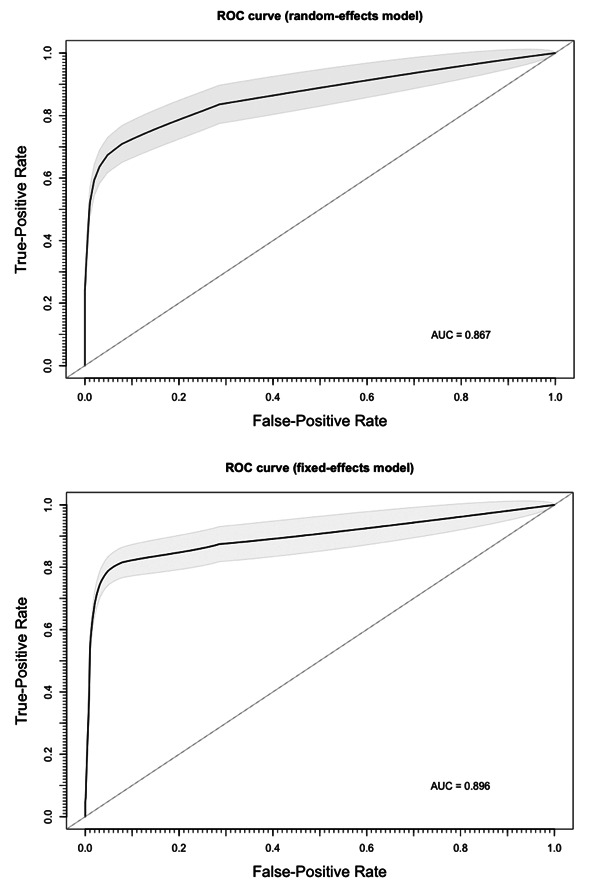
Results: The systematic review eventually retrieved 14 studies including a total of 15 estimates, the were included in quantitative synthesis. We found a pooled specificity of 97.7% (95%CI 93.8-99.2) and a pooled sensitivity of 83.4% (95%CI 73.1-90.4), with an overall agreement assessed by means of Cohen's kappa equals to 0.750, 95%CI 0.62-0.88 (i.e. moderate agreement), with high heterogeneity and risk of reporting bias.

Conclusions: In conclusion, diagnostic tests based on salivary specimens are somewhat reliable, but relatively few studies have been carried out. Moreover, such studies are characterized by low numbers and low sample power. Therefore, the of salivary samples is currently questionable for clinical purposes and cannot substitute other more conventional RT-qPCR based on nasopharyngeal swabs.


Conflict of interest statement

Each author declares that he or she has no commercial associations (e.g. consultancies, stock ownership, equity interest, patent/licensing arrangement etc.) that might pose a conflict of interest in connection with the submitted article. The facts, conclusions, and opinions stated in the article represent the authors’ research, conclusions, and opinions and are believed to be substantiated, accurate, valid, and reliable. However, as this article includes the results of personal researches of the Authors, presenting correspondent, personal conclusions and opinions, parent employers are not forced in any way to endorse or share its content and its potential implications.

Figures

Figure 1.
Figure 1.
The process of studies retrieval and inclusion adopted in the present systematic review and meta-analysis. A total of 14 studies with 15 estimates were retrieved
Figure 2.
Figure 2.
Forest plot representing the estimated specificity of studies on RT-qPCR analysis of salivary fluid for SARS-CoV-2 RNA 2. Mean specificity is 97.7% (95%CI 93.8–99.2), resulting from 97.7% (95%CI 72.6-99.9) for diachronous studies, and 98.0% (95%CI 95.5-99.1) for synchronous studies. Heterogeneity was substantial (I2, 74%), for diachronous studies (I2 = 89%), while it was moderated (I2, 31%) for synchronous studies
Figure 3.
Figure 3.
Forest plot representing the estimated sensitivity of studies on RT-qPCR analysis of salivary fluid for SARS-CoV-2 RNA. Pooled sensitivity was 83.4% (95%CI 73.1–90.4), resulting from 85.7% (95%CI 72.6-93.2) for diachronous studies, and 80.3% (95%CI 61.8-91.1) for synchronous studies. Heterogeneity was substantial (I2, 79%), for both synchronous (I2, 81%) and diachronous stusies (I2 = 73%)
Figure 4.
Figure 4.
Forest plot representing the estimated sensitivity of studies on RT-qPCR analysis of salivary fluid for SARS-CoV-2 RNA, sub-analysis for case-control studies. Pooled sensitivity was 80.4% (95%CI 53.9–90.1), resulting from 83.4% (95%CI 59.9-94.4) for diachronous studies, and 78.1% (95%CI 55.5-91.1) for synchronous studies. Heterogeneity was substantial (I2, 79%), for both synchronous (I2, 81%) and diachronous studies (I2 = 69%)
Figure 5.
Figure 5.
Forest plot representing the estimated sensitivity of studies on RT-qPCR analysis of salivary fluid for SARS-CoV-2 RNA, sub-analysis for cohort studies. Pooled sensitivity was 87.1% (95%CI 76.1–93.4), resulting from 87.2% (95%CI 70.3-95.1) for diachronous studies, and 89.1% (95%CI 77.8-95.0) for synchronous studies. Heterogeneity was substantial (I2, 60%), particularly both diachronous studies (I2 = 69%), while it was not calculated for synchronous studies as including a single report
Figure 6.
Figure 6.
Funnel plots for Sensitivity (a, c, d), and Specificity (d) of studies included in the meta-analysis. Visual inspection suggested a significant asymmetry for all analyses, with subsequent reporting bias. However, regression analysis confirmed a significant reporting bias only for overall analysis of sensitivity (t = 1.8664, df = 13, p value = 0.0847), while it was dismissed for specificity (t = 1.7571, df = 8, p value = 0.117), as well as sensitivity subanalysis both in case-controls (t = 1.7571, df = 8, p value = 0.117) and case-crossover studies (t = 2.3882, df = 3, p value = 0.969), the latter possibly affected by the reduced number of cases included in the analyses
Figure 7.
Figure 7.
Forest plot representing the pooled diagnostic odds ratio (DOR) of RT-qPCR analysis of salivary fluid for SARS-CoV-2 RNA. A substantial heterogeneity in reported studies was identified (I2 71.61%, Cochran’s Q: 31.697 (df=22, p < 0.001))
Figure 8.
Figure 8.
Summary Receiver Operated Characteristics (sROC) curve for RT-qPCR analysis of salivary fluid for SARS-CoV-2 RNA. The slight differences between estimates from a random-effect model (AUC = 0.867) and a fixed-effect model (AUC = 0.896) suggest the absence of a threshold effect in diagnostic performances of assessed tests.

References

    1. Guan W, Liang W, Zhao Y, Liang H, Chen Z, Li Y, et al. Comorbidity and its impact on 1590 patients with Covid-19 in China: A Nationwide Analysis. Eur Respir J. 2020 14;55(5):2000547. doi: 10.1183/13993003.00547-2020. - PMC - PubMed
    1. Huang C, Wang Y, Li X, Ren L, Zhao J, Hu Y, et al. Clinical features of patients infected with 2019 novel coronavirus in Wuhan, China. Lancet. 2020;395(10223):497–506. doi: 10.1016/ S0140-6736(20)30183-5. - PMC - PubMed
    1. Li Q, Guan X, Wu P, Wang X, Zhou L, Tong Y, et al. Early Transmission Dynamics in Wuhan, China, of Novel Coronavirus-Infected Pneumonia. N Engl J Med. 2020;382(13):1199–1207. doi: 10.1056/NEJMoa2001316. - PMC - PubMed
    1. Riccò M, Ferraro P, Gualerzi G, Ranzieri S, Bragazzi NL, Balzarini F, et al. Point-of-Care diagnostic of SARS-CoV-2: knowledge, attitudes, and beliefs (KAP) of medical workforce in Italy. Acta Biomed. 2020;91(2):57–67. doi: 10.23750/abm.v91i2.9573. - PMC - PubMed
    1. European Centre for Diseases Prevention and Control (ECDC) Stockholm: 2020. An overview of the rapid test situation for COVID-19 diagnosis in the EU / EEA. available from: https://www.ecdc.europa.eu/en/publications-data/overview-rapid-test-situ.... (accessed June 9, 2020)